Arima Analysis Of Ferroelectric Lithium Niobate (LiNbO3) THIN Films
Muhammad Nur Aidi1, Ardian Arif Setiawan2, Mahfuddin Zuhri2, Husin Alatas2, and
Irzaman2
1Departmten of Statistics, Faculty of Mathematics and Natural Sciences Bogor
Agricultural University,Kampus IPB Dramaga Bogor Indonesia 16680
2Departmten of Physics, Faculty of Mathematics and Natural Sciences Bogor Agricultural
University, Kampus IPB Dramaga Bogor Indonesia 16680
Email : [email protected], [email protected]
Abstract
Studying atomic and molecular structure of LiNbO3 are very important in order to
studying the LiNbO3 character itself. ARIMA model could be used to analyzed. The
research result showed that FTIR and XRD value on the heated LiNbO3 thin films could
be modelled well by ARIMA.
ARIMA models for Lanthanum Oxide (0 %, 5%, 10 %) doped Lithium Niobate
were high accuracy models, since R2 exceeds than 80 % (99 %, 98 %, 99 % for FTIR data
and
90 %, 89 %, 87 % for XRD data), all ARIMA model parameters were significant, and predicted data from ARIMA model followed behaviour actual data. FTIR data on Lanthanum Oxide (0%, 5%, 10%) Doped Lithium Niobate could be well predicted by
ARIMA (3,0,0) with the equation models are
, ,
, respectively. XRD data on Lanthanum Oxide (0%) Doped Lithium Niobate could be well predicted by ARIMA (4,0,0) with the
equation model are
and XRD data on Lanthanum Oxide (5%, 10 %) Doped Lithium Niobate could be well
predicted by ARIMA (3,0,0) with the equation models are
respectively.
ARIMA model l for FTIR data is more accurate than ARIMA model for XRD data,
since R2 of ARIMA model of FTIR data is greater than R2 of ARIMA model of XRD data
and MAPE of ARIMA model of FTIR data is lower than MAPE of of ARIMA model of XRD data. Lanthanum oxide doped to Lithium Niobate Increasing of FTIR value that
indicated adding Lanthanum Oxide to Lithium Niobate (LiNbO3) can increase absorbing
of LiNbO3 and has lowered the XRD that indicated parameter hints of LiNbO3 decreases
which influenced by the radius of its contituuent ions.
Key word: ARIMA, Fourier Transform Infrared, X-Ray Diffraction, LiNbO3, Lanthanum
1. Introduction
Mastery of basic science and thin film technology are essential in the development of materials science in the future. The role of ferroelectric /pyroelectric / piezoelectric of LiNbO3, LiTaO3, BST, PZT and HgCdTe photon sensor materials, GaAs/AlGaAs are very interesting to examine because they can be applied to DRAM, automatic switching, temperature sensors and solar cells. The pyroelectric and piezoelectric materials are sub-groups of ferroelectric materials. Because of these properties, the ferroelectric material through hysteresis and high dielectric values can be applied to automatic switching [1 - 5] switches, dynamic random access memory (DRAM) [6], non-volatile random access memory (NVRAM) 7] and solar cells [8].
While the operating area of the ferreoelectric sensor (which is also pyro electric)
at ambient temperature is below the Curie temperature (Tc = 490oC) [9].In addition, the
way of making this ferroelectric materials easier than superconductors. Although these ferroelectric materials have weaknesses such as the response time is not as fast as the photovoltaic sensors of HgCdTe, GaAs / AlGaAs and superconductors, but ferroelectric materials have advantage which do not require liquid nitrogen for cooling in ambient temperature, meaning they are easily made at laboratories of campus in Indonesia and world [1 – 5]. Ferro electricity is a symptom of spontaneous electrical polarization without the material receiving an electric from outside the material [1, 2, 10]. Ferroelectrics show that a group of dielectric materials can be polarized internally at a range of temperatures.
Polarization occurs within the dielectric as a result of the external electric field and symmetry on the crystallographic structure inside the unit cell. If the ferroelectric material is subjected to an electric field, certain atoms undergo a shift and generate an electric dipole moment. This dipole moment causes polarization [1, 11 – 12].
The most widely used of ferroelectric materials are LiNbO3 [5] LaTiO3 [4],
PbZrTiO3 [1], PbZrO3, BaxSr1-xTiO3 (BST) [2], and BST doped metal oxide (BST
derivative) [6]. A thin layer of LiNbO3, BST and its derivatives can be prepared by various methods such as sputtering [7, 10, 13-15], chemical solution deposition (CSD) [2 - 5, 16 - 20], pulsed laser deposition (PLD) 21], chemical vapor deposition (CVD) [22 - 23]. CSD method is relatively cheaper and easier compared to sputtering method, PLD, and CVD, then we in this research using CSD method [2 – 5].
Chemical Solution Deposition (CSD) method is one of the method of making thin film by using solution which is placed on the substrate, then rotated with certain speed with spin coating tool. Theoretical model and experiment for improving the quality of ferroelectric thin films by chemical solution deposition (CSD) and spin coating methods based on research done by previous researchers (24-26), were then modified by taking into account factors including surface tension, film viscosity, solution density, fluid flow rate, rotational speed, growth time, substrate form, and solvent evaporation process [27 – 30].
obtain a ferroelectric / pyroelectric / piezoelectric material resembling a p-type
semiconductor (doping acceptor), since the Lanthanum (La3 +) ion will occupy the
position of lithium ion (Li2 +) meaning that the structure has excess a positive ion (type- p)
called hard dopant ions or dopant acceptor. Hard dopant ion can produce stronger ferroelectric materials, such as higher elastic conductivity, lower coercive field properties, higher mechanical quality factors and higher electrical current quality Dopant acceptors
plays an important role in the formation of vacant space in the oxygen ion position (O2-)
of the perovskite structure due to electrostatic processes, and causes Li ions to not easily
leap into the oxygen ion space (O2) due to blocked niobium ionic bonds. [31].
LiNbO3 characteristic was closely related to the composition, its mineral structure,
and its molecular shape. Thus, LiNbO3 detection is crucial to understand the material
characteristic deeper. There are several LiNbO3 detection method such as X-ray powder
diffraction (XRD), and also Fourier-transform infrared spectroscopy (FTIR).
X-ray powder diffraction (XRD) is a fast analysis method that mainly used for identificating crystal material phase and retrieving information about individual cell dimension. Analyzed material is homogenysis and composition. X-ray diffraction was
based on constructive disturbance of monochromatic X-ray and crystal sample [32].X-ray
was emitted by catoda ray tube, filtered to creat monochromatic radiation, collimated for
concentrating, and aimed at the sample [33 – 35]. Interaction between the X-ray and the
sample create constructive interference (and the ray diffracted) if the condition meets the Bragg Law (nλ = 2d sin θ) yang menggunakan panjang gelombang 10 nm- 100 pm dan
frekuensi : 3 x 10¹⁶ – 3 x 10¹⁸ Hz. The law explain the correlation between electromagnetic
radiation wavelength with diffraction angle and grid distance on the cystal sample [36]. Diffracted X-ray is then detected, proceed and calculated. By scanning the sample with range of 2θ angles, all possible direction grid diffraction should be achieved due to the random orientation of the powder material. Conversion diffraction peak to distance-d enables the identification of mineral since each mineral has its unique set of distance-d. Usually, this is achieved by ratio of distance d and the standard benchmark pattern [37].
Fourier-transform infrared spectroscopy is a method used for retrieving infared spectrum in absorbtion or emission of solid-gas, solid or gas which was identified by vibration movement. Molecular vibration was unique for each molecul and usually called finger print vibration. Molecular vibration could be splitted into two groups; stretching vibration and bending vibration. A FTIR spectrometer could simultaniously collect high resolution spectrum data through wide spectrum range. In infrared spectroscopy, infrared spectrum was in the wavelength range from 0.75 to 1000 μm or wavenumber ranges from
1300 to 1 cm-1 with frequency of 3 x 10¹² – 3 x 10 14 Hz. From the application and
instrumentation point of view, infrared spectrum divided into three radiation type which
are near infrared (wavenumber of 12800-4000 cm-1), mid infrared (wavenumber 4000-200
cm-1), and far infrared (wavenumer of 200-10 cm-1). This gives significant advantages over
From the aforementioned explaination, studying atomic and molecular structure
of LiNbO3 are very important in order to studying the LiNbO3 character itself. Analyzing
X-ray Diffracton spectrum data usually with Rietveld model or General Structure Analysis System (GSAS). Both methods are based on reference as benchmark. The XRD data are compared with the reference data which then identified its characteristics [41]. ARIMA model could be used as alternative. ARIMA model does not need any reference pattern as benchmark. The research result showed that FTIR and XRD value on the
heated LiNbO3 thin films could be modelled well by ARIMA [42]. Thus, LiNbO3 study
through atomic and molecular structure could be studied through reflectant function which generated from XRD [43 – 53] and FTIR [54 – 63] value with ARIMA approach.
2. Research Objectives
1. Obtain LiNbO3 ARIMA function from XRD and FTIR data,
2. Compared LiNbO3 ARIMA function with XRD and FTIR data which doped by
Lanthanum Oxide (0 %, 5 % dan 10 %)
3. Research Methodology
LiNbO3 thin films manufacturing was conducted in two stages using chemical
solution deposition method. In the first stage, substrate was prepared by cutting the p-type Si (100) with the size of 8 mm x 8 mm then cleaned by aqua and dried. In the next
stage, the LiNbO3 powder (precursor) was manufactured. There were three prepared
prescursors i.e undoped precursor, 5% lanthanum doped precursor, and 10% lanthanum
doped precursor. Precursors were obtained by mixing LiCH3COO powder, Nb2O5, and
lanthanum oxide and then dissolved in 2.5 ml 2-methoxy methanol. The mixing process was conducted using ultrasonic of Branson 2210 for 90 minutes and then deposited on the substrate by using spin coating at speed of 3000 rpm, 2 times. The next step was annealing process using the furnace of VulcanTM3–130. The annealing process for each substrate
was started from room temperature with the increasing rate of 1.7 oC/min to temperature
of 550oC and than held constantly for 8 hours. After that, cooled until room temperature
[5].
FTIR spectrum characterization from LiNbO3 thin film used FTIR tools type ABB
MB 3000. In this research, FTIR spectrum used belongs to the mid infared radiaton
category (wavenumber of 4000-500 cm-1) with step of 16 cm-1. XRD spectrum
characterization used the XRD tools type GBC EMMA. In this research XRD spectrum
used belongs to angle range of 100 to 800 with step of 0.020 [2 - 5].
done if it was not stationary in variance. If the data was stationary, then ACF (Autocorrelation Function) plot and PACF (Partial Autocorrelation Function) plot were done to get possible assumption model [42]. Next step was to get estimated parameter model and to test the parameter to the models until significant model parameters were
obtained. Selected model was then calculated its coefficient determination (R2), Mean
Absolut Percentage Error (MAPE), and plotted with the XRD data and FTIR to determine
the accuracy of the model [42]. In this research, we used SPSS 15.0 for windows and
Lenovo Computer 2 GB 64 Bit.
4. Result and Discussion
4.1. Raw Data of on LiNbO3 FTIR value
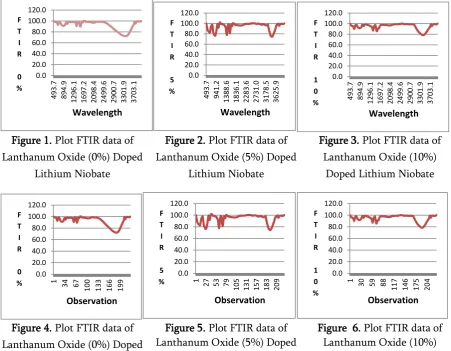
Plot between infrared wavelength value as x-axis and absorbed, reflected, and transmitted percent of infrared as the y-axis on control Lanthanum Oxide (0%) doped Lithium Niobate was showed in Figure 1. Meanwhile in Figure 2 and Figure 3, it showed Plot between infrared wavelength value and absorbed, reflected, and transmitted percent of infrared Lanthanum Oxide (5%, 10%, respectively) doped Lithium Niobate. For ARIMA model, X-axis of FTIR data be changed to with integer number 1, 2, 3,.. which were consistent with wavelength value 1, 2, 3,.... Thus, Figure 1, 2, and 3 could be substitued with Figure 4, 5, and 6.
Figure 1. Plot FTIR data of Lanthanum Oxide (0%) Doped
Lithium Niobate
Figure 2. Plot FTIR data of Lanthanum Oxide (5%) Doped
Lithium Niobate
Figure 3. Plot FTIR data of Lanthanum Oxide (10%)
Doped Lithium Niobate
Figure 4. Plot FTIR data of Lanthanum Oxide (0%) Doped
Figure 5. Plot FTIR data of Lanthanum Oxide (5%) Doped
Figure 6. Plot FTIR data of Lanthanum Oxide (10%)
0.0 20.0 40.0 60.0 80.0 100.0 120.0 493 .7 894 .9 129 6.1 169 7.2 209 8.4 249 9.6 290 0.7 330 1.9 370 3.1 F T I R 0 % Wavelength 0.0 20.0 40.0 60.0 80.0 100.0 120.0 493 .7 941 .2 138 8.6 183 6.1 228 3.6 273 1.0 317 8.5 362 5.9 F T I R 5 % Wavelength 0.0 20.0 40.0 60.0 80.0 100.0 120.0 493 .7 894 .9 129 6.1 169 7.2 209 8.4 249 9.6 290 0.7 330 1.9 370 3.1 F T I R 1 0 % Wavelength 0.0 20.0 40.0 60.0 80.0 100.0 120.0
1 34 67
100 133 166 199 F T I R 0 % Observation 0.0 20.0 40.0 60.0 80.0 100.0 120.0
1 27 53 79
105 131 157 183 209 F T I R 5 % Observation 0.0 20.0 40.0 60.0 80.0 100.0 120.0
1 30 59 88
Lithium Niobate for ARIMA Model
Lithium Niobate for ARIMA Model
Doped Lithium Niobate for ARIMA Model
From Figure 4, 5, 6 and Augmented Dickey–Fuller test (ADF) with p-value < 0.0001, those FTIR data of Lanthanum Oxide (0 %, 5 %, 10 %) Doped Lithium Niobate are stationary in average. Non differensing of ARIMA model will be developed for FTIR data of Lanthanum Oxide (0 %, 5 %, 10 %) Doped Lithium Niobate.
4.2. ARIMA model on LiNbO3 FTIR value
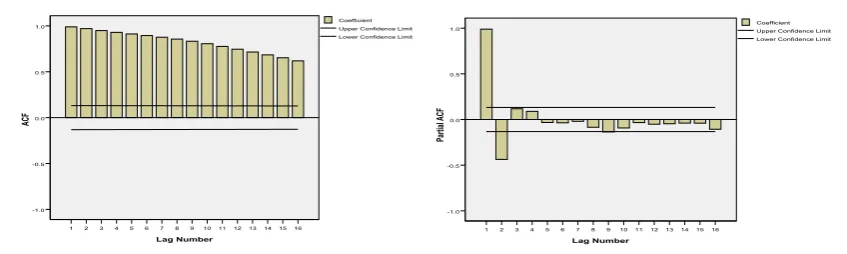
Partial Autocorrelation Function and Autocorrelation Function calculation of FTIR data of Lanthanum Oxide (0 %) doped Lithium Niobate was presented at Figure 7. ACF calculation tails off and PACF calculation cuts off at lag-3. From Figure 7, FTIR data suggest that the suitable model was ARIMA (3,0,0).
Figure 7. Plot ACF and PACF of FTIR data of Lanthanum Oxide (0%) Doped Lithium Niobate
ARIMA (3,0,0) parameters were estimated, those all parameters are significant
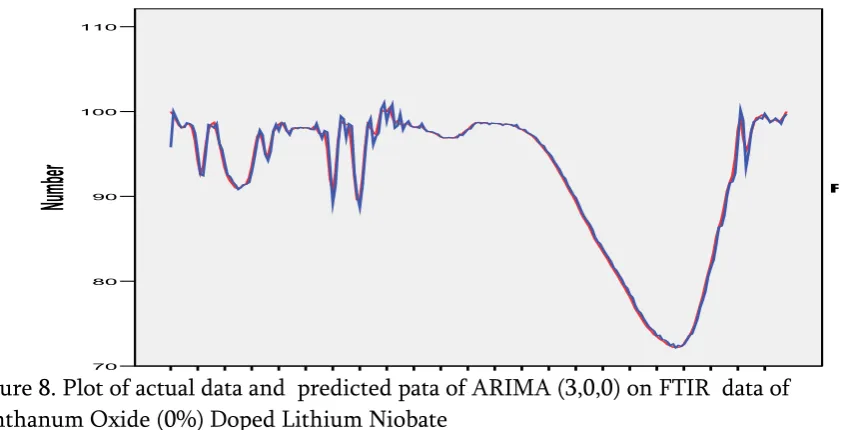
with R2 of 99 % and MAPE of 0,44 % which was presented in Table 1. Plot of actual data
and the predicted data of ARIMA (3,0,0) on FTIR data of Lanthanum Oxide (0%) Doped Lithium Niobate is at Figure 8. Predicted data of ARIMA (3,0,0) on FTIR data of Lanthanum Oxide (0%) Doped Lithium Niobate followed actual data.
Table 1. ARIMA (3,0,0) model parameters for FTIR data of Lanthanum Oxide (0%) Doped Lithium Niobate
ARIMA (3,0,0)
Lag Estimate SE t Significant
Constant 95.785 5.404 17.724 0.000
Lag1 2.085 0.054 38.555 0.000
Lag 2 -1.679 0.099 -16.985 0.000
Lag 3 0.589 0.054 10.888 0.000
Lag Number
16 15 14 13 12 11 10 9 8 7 6 5 4 3 2 1
ACF
1.0
0.5
0.0
-0.5
-1.0
FTIR_0
Lower Confidence Limit Upper Confidence Limit Coefficient
Lag Number
16 15 14 13 12 11 10 9 8 7 6 5 4 3 2 1
Part
ial A
CF
1.0
0.5
0.0
-0.5
-1.0
FTIR_0
Figure 8. Plot of actual data and predicted pata of ARIMA (3,0,0) on FTIR data of Lanthanum Oxide (0%) Doped Lithium Niobate
From the process above, it could be concluded that FTIR data on Lanthanum Oxide (0%) Doped Lithium Niobate could be well predicted by ARIMA (3,0,0) with the equation model is (1):
.
Partial Autocorrelation Function and Autocorrelation Function calculation of FTIR data of Lanthanum Oxide (5 %) doped Lithium Niobate is presented at Figure 9. ACF calculation tails off and PACF calculation cuts off at lag-3. From Figure 9, the suitable model for FTIR data of Lanthanum Oxide (5 %) doped Lithium Niobate was ARIMA (3,0,0).
Figure 9. Plot ACF and PACF of FTIR data of Lanthanum Oxide (5%) Doped Lithium Niobate
ARIMA (3,0,0) parameters were estimated, those all parameters are significant
with R2 of 98 % and MAPE of 0.693 % which was presented in Table 2. Plot of actual data
and the predicted data of ARIMA (3,0,0) on FTIR data of Lanthanum Oxide (5%) Doped Date 221 211 201 191 181 171 161 151 141 131 121 111 101 91 81 71 61 51 41 31 21 11 1
Number
110 100 90 80 70 FTIR_0-Model_1 Fit Observed Lag Number 16 15 14 13 12 11 10 9 8 7 6 5 4 3 2 1 ACF 1.0 0.5 0.0 -0.5 -1.0 FTIR_5Lower Confidence Limit Upper Confidence Limit Coefficient Lag Number 16 15 14 13 12 11 10 9 8 7 6 5 4 3 2 1 Part ial A CF 1.0 0.5 0.0 -0.5 -1.0 FTIR_5
Lithium Niobate was presented at Figure 10. Predicted data ARIMA (3,0,0) of FTIR data of Lanthanum Oxide (5%) Doped Lithium Niobate followed followed actual data.
Table 2. ARIMA (3,0,0) parameters for FTIR data of Lanthanum Oxide (5%) Doped Lithium Niobate
ARIMA (3,0,0)
Lag Estimate SE t Significant
Constant 94.924 2.354 40.321 0.000
Lag1 2.168 0.053 41.233 0.000
Lag 2 -1.806 0.095 -18.940 0.000
Lag 3 0.612 0.052 11.679 0.000
So, it could be concluded that FTIR data of Lanthanum Oxide (5%) Doped Lithium Niobate could be well predicted by ARIMA (3,0,0) with the equation model is (2):
.
Figure 10. Plot of actual data and the predicted data of ARIMA (3,0,0) on FTIR data of Lanthanum Oxide (5%) Doped Lithium Niobate
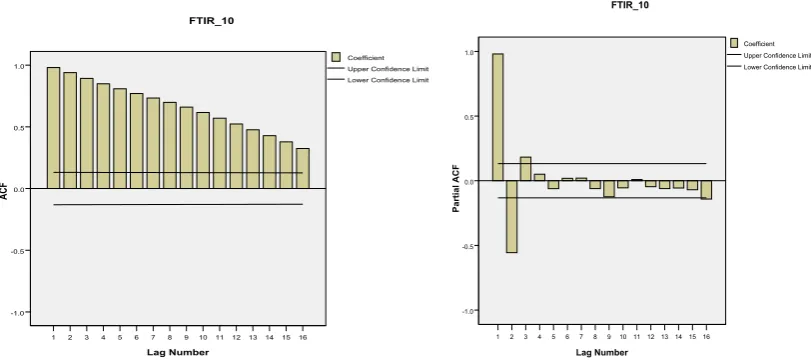
Partial Autocorrelation Function and Autocorrelation Function calculation of FTIR data of Lanthanum Oxide (10 %) doped Lithium Niobate was presented by Figure 11. ACF calculation tails off and PACF calculation cuts off at lag-3. From Figure 11, the suitable model of FTIR of Lanthanum Oxide (10 %) doped Lithium Niobate was ARIMA (3,0,0).
Date
221
211
201
191
181
171
161
151
141
131
121
111
101
91
81
71
61
51
41
31
21
11
1
Number
100
90
80
70
FTIR_5-Model_1
Fit
Figure 11. Plot ACF and PACF of FTIR data of Lanthanum Oxide (10%) Doped Lithium Niobate
ARIMA (3,0,0) model parameters were estimated and was presented at Table 3. From Table 3 showed those ARIMA (3,0,0) model parameters were siginificant.
Table 3. ARIMA (3,0,0) model parameters for FTIR data of Lanthanum Oxide (10 %) Doped Lithium Niobate
ARIMA (3,0,0)
Lag Estimate SE t Significant
Constant 96.031 2.798 44.320 0.000
Lag1 2.124 0.054 39.167 0.000
Lag 2 -1.716 0.099 -17.257 0.000
Lag 3 0.581 0.054 10.717 0.000
ARIMA (3,0,0) model for FTIR data of Lanthanum Oxide (10 %) Doped Lithium Niobate has Coefficient Determination of 99 % and MAPE of 0.403 %. Predicted data of ARIMA (3,0,0) on FTIR data of Lanthanum Oxide (10%) Doped Lithium Niobate followed actual data (Figure 12).
Lag Number
16 15 14 13 12 11 10 9 8 7 6 5 4 3 2 1
ACF
1.0
0.5
0.0
-0.5
-1.0
FTIR_10
Lower Confidence Limit Upper Confidence Limit Coefficient
Lag Number
16 15 14 13 12 11 10 9 8 7 6 5 4 3 2 1
Part
ial A
CF
1.0
0.5
0.0
-0.5
-1.0
FTIR_10
Figure 12. Plot of actual data and the predicted data of ARIMA (3,0,0) on FTIR data of Lanthanum Oxide (10%) Doped Lithium Niobate
So, it could be concluded that FTIR data on Lanthanum Oxide (10%) Doped Lithium Niobate could be well predicted by ARIMA (3,0,0) with the equation model (3):
4.3. Raw Data of on LiNbO3 XRD value
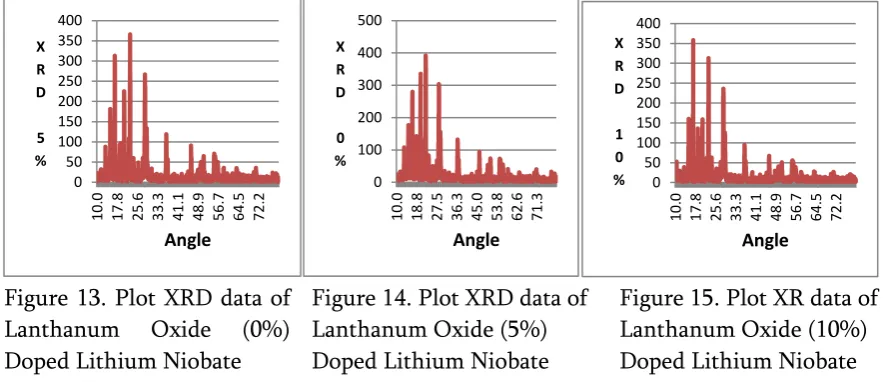
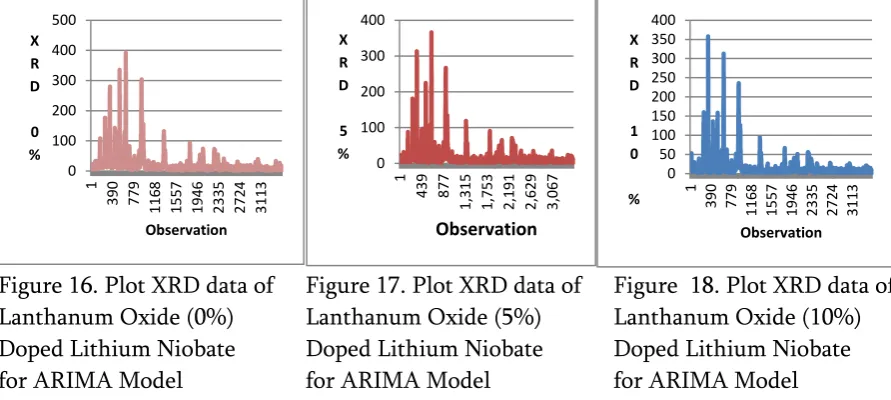
Plot between angle value as x-axis and and reflected intensity value (XRD) as y-axis on Lanthanum Oxide (0%, 5%, 10%) doped Lithium Niobate (Figure 13, 14, 15). For ARIMA model, X-axis of XRD data be changed by integer number 1, 2, 3,.. which were consistent with wavelength value 1, 2, 3,.... Thus, Figure 13, 14, and 15 will be substitued with Figure 16, 17, and 18.
Figure 13. Plot XRD data of
Lanthanum Oxide (0%)
Doped Lithium Niobate
Figure 14. Plot XRD data of Lanthanum Oxide (5%) Doped Lithium Niobate
Figure 16. Plot XRD data of Lanthanum Oxide (0%) Doped Lithium Niobate for ARIMA Model
Figure 17. Plot XRD data of Lanthanum Oxide (5%) Doped Lithium Niobate for ARIMA Model
Figure 18. Plot XRD data of Lanthanum Oxide (10%) Doped Lithium Niobate for ARIMA Model
From Figure 16, 17, 18 and Augmented Dickey–Fuller test (ADF) with p-value < 0.0001, those XRD data of Lanthanum Oxide (0 %, 5 %, 10 %) Doped Lithium Niobate were stationary in average. Non differensing of ARIMA model will be developed for XRD data of Lanthanum Oxide (0 %, 5 %, 10 %) Doped Lithium Niobate.
4.4. ARIMA model on LiNbO3 XRD value
Partial Autocorrelation Function and Autocorrelation Function calculation of XRD data of Lanthanum Oxide (0 %) doped Lithium Niobate was presented by Figure 19. ACF calculation tails off and PACF calculation cuts off at lag-5, that means nondifferencing ARIMA model was AR(5) and MA (0). Thus, From Figure 19, the model for XRD data of Lanthanum Oxide (0 %) Doped Lithium Niobate was ARIMA (5,0,0).
Figure 19. Plot ACF and PACF of XRD data of Lanthanum Oxide (0%) Doped Lithium Niobate 0 100 200 300 400 500 1
390 779 1168 1557 1946 2335 2724 3113 X R D 0 % Observation 0 100 200 300 400 1 439 877 1, 315 1, 753 2, 191 2, 629 3, 067 X R D 5 % Observation 0 50 100 150 200 250 300 350 400 1
390 779 1168 1557 1946 2335 2724 3113 X R D 1 0 % Observation Lag Number 16 15 14 13 12 11 10 9 8 7 6 5 4 3 2 1 ACF 1.0 0.5 0.0 -0.5 -1.0 XRD_0
Lower Confidence Limit Upper Confidence Limit Coefficient Lag Number 16 15 14 13 12 11 10 9 8 7 6 5 4 3 2 1 Part ial A CF 1.0 0.5 0.0 -0.5 -1.0 XRD_0
ARIMA (5,0,0) model parameters were estimated. Hopefully those all parameters
of ARIMA (5,0,0) model were significants with R2 of 90 % which be presented in Table 4.
Table 4 showed that not All ARIMA (5,0,0) model parameters were significant, they are only four parameters of model were significant. Thus, XRD data of Lanthanum Oxide (0%) Doped Lithium Niobate better to be modelled by ARIMA (4,0,0) model (Tabel 5).
All ARIMA (4,0,0) parameters were significant, with R2 of 90 % and MAPE of 42,972 %.
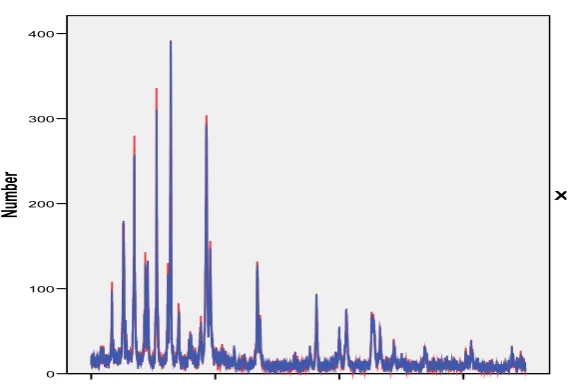
Figure 20 showed that predicted data of ARIMA (4,0,0) model on XRD data of Lanthanum Oxide (0%) Doped Lithium Niobate followed actual data (Figure 20).
Table 4. ARIMA (5,0,0) model parameters for XRD data of Lanthanum Oxide (0%) Doped Lithium Niobate
ARIMA (5,0,0)
Lag Estimate SE t Significant
Constant 20.723 -2.498 8.295 0.000
Lag1 0.759 0.017 45.104 0.000
Lag 2 0.436 0.021 20.667 0.000
Lag 3 -0.193 0.022 -8.700 0.000
Lag 4 0.034 0.021 1.589 0.112
Lag 5 -0.102 0.017 -6.074 0.000
Table 5. ARIMA (4,0,0) model parameters for XRD data of Lanthanum Oxide (0%) Doped Lithium Niobate
ARIMA (4,0,0)
Lag Estimate SE t Significant
Constant 20.707 2.764 7.492 0.000
Lag1 0.763 0.017 45.188 0.000
Lag 2 0.461 0.021 22.064 0.000
Lag 3 -0.240 0.021 -11.497 0.000
Lag 4 -0.044 0.017 -2.631 0.009
Number
400
300
200
100
XRD_0-Model_1
From the process above, it could be concluded that XRD data on Lanthanum Oxide (0%) Doped Lithium Niobate could be well predicted by ARIMA (4,0,0) with the equation model (4):
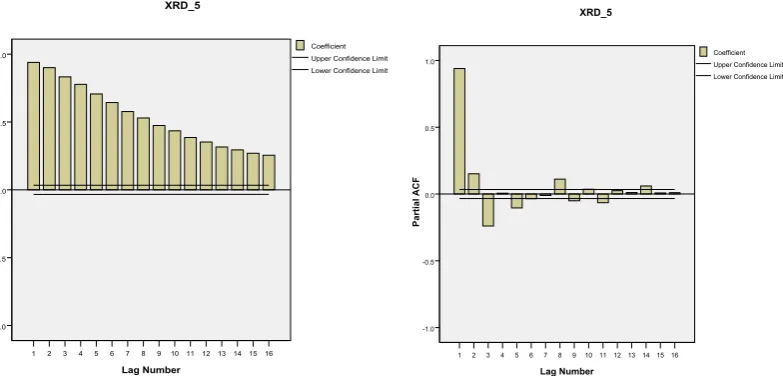
Partial Autocorrelation Function and Autocorrelation Function calculation of XRD data of Lanthanum Oxide (5 %) doped Lithium Niobate were presented at Figure 21. ACF calculation tails off and PACF calculation cuts off at lag-4, that means nondifferencing ARIMA model were AR(4) and MA (0). Thus, From Figure 21, the model for XRD data of Lanthanum Oxide (5 %) Doped Lithium Niobate was ARIMA (4,0,0).
Figure 21. Plot ACF and PACF of XRD data of Lanthanum Oxide (5%) Doped Lithium Niobate
ARIMA (4,0,0) model parameters were estimated. Hopefully those all parameters
of ARIMA (4,0,0) model were significants with R2 of 89 % which be presented in Table 6.
Table 6 showed that not All ARIMA (4,0,0) model parameters were significant, they are only three parameters of model were significant. Thus, XRD data of Lanthanum Oxide (5%) Doped Lithium Niobate better to be modelled by ARIMA (3,0,0) model (Tabel 7).
All ARIMA (3,0,0) model parameters were significant which R2 of 89 % and MAPE of
51.237 % . Figure 22 showed that predicted data of ARIMA (3,0,0) model on XRD data of Lanthanum Oxide (5%) Doped Lithium Niobate followed actual data (Figure 22).
Table 6. ARIMA (4,0,0) model parameters for XRD data of Lanthanum Oxide (5%) Doped Lithium Niobate
ARIMA (4,0,0)
Lag Estimate SE t Significant
Constant 17.277 2.339 7.385 0.000
Lag Number
16 15 14 13 12 11 10 9 8 7 6 5 4 3 2 1
ACF
1.0
0.5
0.0
-0.5
-1.0
XRD_5
Lower Confidence Limit Upper Confidence Limit Coefficient
Lag Number
16 15 14 13 12 11 10 9 8 7 6 5 4 3 2 1
Part
ial A
CF
1.0
0.5
0.0
-0.5
-1.0
XRD_5
Lag 3 -0.244 0.022 -11.293 0.000
Table 7. ARIMA (4,0,0) model parameters for XRD data of Lanthanum Oxide (5%) Doped Lithium Niobate
ARIMA (3,0,0)
Lag Estimate SE t Significant
Constant 17.277 2.326 7.429 0.000
Lag1 0.833 0.016 50.751 0.000
Lag 2 0.342 0.021 16.419 0.000
Lag 3 -0.239 0.016 -14.584 0.000
Figure 22. Plot of actual and the predicted data of ARIMA (3,0,0) on XRD data of Lanthanum Oxide (5%) Doped Lithium Niobate
From the process above, it could be concluded that XRD data on Lanthanum Oxide (5%) Doped Lithium Niobate could be well predicted by ARIMA (3,0,0) with the equation model is (5):
Partial Autocorrelation Function and Autocorrelation Function calculation of XRD data of Lanthanum Oxide (10 %) doped Lithium Niobate were presented at Figure 23. ACF calculation tails off and PACF calculation cuts off at lag-5, that means nondifferencing ARIMA model were AR(5) and MA (0). Thus, From Figure 23, the model for XRD data of Lanthanum Oxide (10 %) Doped Lithium Niobate was ARIMA (5,0,0).
Date
3001 2001
1001 1
Number
400
300
200
100
0
-100
XRD_5-Model_1
Figure 23. Plot ACF and PACF of XRD data of Lanthanum Oxide (10%) Doped Lithium Niobate
ARIMA (5,0,0) model parameters were estimated, but they were only three parameters of model were significant. Thus, XRD data of Lanthanum Oxide (10 %) Doped Lithium Niobate better to be modelled by ARIMA (3,0,0) model (Tabel 8). All
ARIMA (3,0,0) model parameters were significant which R2 of 87 % and MAPE of 50,882
% (Table 9). Figure 22 showed that predicted data of ARIMA (3,0,0) model on XRD data of Lanthanum Oxide (5%) Doped Lithium Niobate followed actual data (Figure 24).
Table 8. ARIMA (5,0,0) model parameters for XRD data of Lanthanum Oxide (10%) Doped Lithium Niobate
ARIMA (5,0,0)
Lag Estimate SE t Significant
Constant 15,173 1,721 8,818 0,000
Lag1 0.717 0.017 42.980 0.000
Lag 2 0.361 0.021 17.517 0.000
Lag 3 -0.020 0.021 -0.924 0.355
Lag 4 0.027 0.021 1.314 0.189
Lag 5 -0.168 0.017 -10.087 0.000
Table 9. ARIMA (3,0,0) model parameters for XRD data of Lanthanum Oxide (10%) Doped Lithium Niobate
ARIMA (3,0,0)
Lag Estimate SE t Significant
Constant 15.151 2.237 6.772 0.000
Lag1 0.748 0.017 44.762 0.000
Lag 2 0.342 0.020 16.986 0.000
Lag 3 -0.155 0.017 -9.279 0.000
Lag Number
16 15 14 13 12 11 10 9 8 7 6 5 4 3 2 1
ACF
1.0
0.5
0.0
-0.5
-1.0
XRD_10
Figure 24. Plot of actual and the predicted data of ARIMA (3,0,0) on XRD data of Lanthanum Oxide (10%) Doped Lithium Niobate
From the process above, it could be concluded that XRD data on Lanthanum Oxide (10 %) Doped Lithium Niobate could be well predicted by ARIMA (3,0,0) with the equation model is (6):
4.5. Effect of Lanthanum Oxide to FTIR, and XRD value of Lithium Niobate
Lithium Niobate was doped by lanthanum oxide with three concentrations such as 0%, 5% and 10 %. The effect of Lanthanum Oxide were measured by FTIR and XRD value. The mean of FTIR value of Lanthanum Oxide (0%, 5%, 10 %) doped Lithium Niobate are 92.4538, 94.2459, 94,7088, respectively.
To compare effect of Lanthanum Oxide doped to of Lithium Niobate was used by comparing mean of FTIR values of Lanthanum Oxide (0%, control) doped Lithium Niobate control versus Lanthanum Oxide (5%) doped Lithium Niobate and Lanthanum Oxide (0%, control) doped Lithium Niobate control versus Lanthanum Oxide (10%) doped Lithium Niobate, with null hypothesis : mean of FTIR value of Lanthanum Oxide (0%, control) doped Lithium Niobate same with FTIR value of Lanthanum Oxide (5%) doped Lithium Niobate and mean of FTIR value of Lanthanum Oxide (0%, control) doped Lithium Niobate same with FTIR value of Lanthanum Oxide (10%) doped Lithium Niobate.
By using t-test with assumption independent population and equal variance between Lanthanum Oxide (0%, control) doped Lithium Niobate and Lanthanum Oxide
Date
3001 2001
1001 1
Number
400
300
200
100
0
XRD_10-Model_1
Niobate is 2.447 (456 degrees of freedom) with p-value =0.014. We can say there is difference of mean of FTIR value between Lanthanum Oxide (0%, control) doped Lithium Niobate and Lanthanum Oxide (5 %) doped Lithium Niobate. Lithium Niobate was doped by Lanthanum Oxide 5% can make increasing of FTIR value from 92.4538 to 94.2459, significantly (Table 10). Also, with the same assumption, t-value of mean of FTIR values of Lanthanum Oxide (0%, control) doped Lithium Niobate control versus Lanthanum Oxide (10 %) doped Lithium Niobate was 3.382 (456 degrees of freedom)with p-value =0.001. We can say there is difference of mean of FTIR value between Lanthanum Oxide (0%, control) doped Lithium Niobate and Lanthanum Oxide (10 %) doped Lithium Niobate. Lithium Niobate was doped by Lanthanum Oxide 10 % can make increasing of FTIR value from 92.4538 to 94,7088, significantly (Table 11). Increasing of FTIR value from 92.4538, 94.2459, 94,7088 that indicated adding Lanthanum Oxide to
Lithium Niobate (LiNbO3) can increase absorbing of LiNbO3. That process caused by
increasing of activities energy structure molecul of LiNbO3 to infrared spectral energy
[5].
Table 10. Group Statistics and Samples test of FTIR values of Lanthanum Oxide (0%, control) doped Lithium Niobate and Lanthanum Oxide (5 %) doped Lithium Niobate
Group N Mean of FTIR Assumption t-value p-value
Lanthanum Oxide (0%, control) doped Lithium Niobate
229 92,4538 Equal
variance
2,447 0.014
Lanthanum Oxide (5 %) doped Lithium Niobate
Table 11. Group Statistics and Samples test of FTIR values of Lanthanum Oxide (0%, control) doped Lithium Niobate and Lanthanum Oxide (10 %) doped Lithium Niobate
Group N Mean of FTIR Assumption t-value p-value
Lanthanum Oxide (0%, control) doped Lithium Niobate
229 92,4538 Equal
variance
3.382 0.001
Lanthanum Oxide (10 %) doped Lithium Niobate
229 94,7088
The mean of XRD value of Lanthanum Oxide (0%, 5%, 10 %) doped Lithium Niobate were 20.8061, 17.3256, 15.2168, respectively.
Table 12. Group Statistics and Samples test of XRD values of Lanthanum Oxide (0%, control) doped Lithium Niobate and Lanthanum Oxide (5 %) doped Lithium Niobate
Group N Mean of XRD Assumption t-value p-value
Lanthanum Oxide (0%, control) doped Lithium Niobate
3501 20.8061 Equal
variance
5.007 0.000
Lanthanum Oxide (5 %) doped Lithium Niobate
3501 17.3256
Table 13. Group Statistics and Samples test of XRD values of Lanthanum Oxide (0%, control) doped Lithium Niobate and Lanthanum Oxide (10 %) doped Lithium Niobate
Group N Mean of XRD Assumption t-value p-value
Lanthanum Oxide (0%, control) doped Lithium Niobate
3501 20,8061 Equal
variance
8.406 0.000
Lanthanum Oxide (10 %) doped Lithium Niobate
3501 15.2168
can say there is difference of mean of XRD value between Lanthanum Oxide (0%, control) doped Lithium Niobate and Lanthanum Oxide (10 %) doped Lithium Niobate. Lithium Niobate was doped by Lanthanum Oxide 10 % can make decreasing of XRD value from 20.8061 to 15.2168, significantly. Decreasing of XRD value from 20.8061,
17.3256, 15.2168 that indicated parameter hints of LiNbO3 decreases which influenced by
the radius of its contituuent ions. Ionic radii of Li+, Nb5+ and La3+ are 0.90 Å, 0.78 Å and
1.172 Å, respectively. It can be seen that the Ionic radius of La3+ is closer to Ionic radius of
Li+ so that La3+ can occupy the positions of Li+ in the crystal structure. The difference of
ionic radii between the dopant and the replaced ion affects the formation of spinel phase, which leads to crystal size decreasing to its existence of dopant’s cations in the structure
of LiNbO3 [5].
5. Conclusion
ARIMA model can be used to model for FTIR and XRD values of Lanthanum
Oxide (0%, 5 %, 10 %) doped Lithium Niobate and Lanthanum Oxide with high
accuracy, since it has R2 greater than 80 % and predicted values from ARIMA
model followed behaviour actual data.
FTIR data on Lanthanum Oxide (0%) Doped Lithium Niobate could be well
predicted by ARIMA (3,0,0) with the equation model :
.
FTIR data on Lanthanum Oxide (5%) Doped Lithium Niobate could be well
predicted by ARIMA (3,0,0) with the equation model :
.
FTIR data on Lanthanum Oxide (10%) Doped Lithium Niobate could be well
predicted by ARIMA (3,0,0) with the equation model :
XRD data on Lanthanum Oxide (0%) Doped Lithium Niobate could be well
predicted by ARIMA (4,0,0) with the equation model :
XRD data on Lanthanum Oxide (5%) Doped Lithium Niobate could be well
predicted by ARIMA (3,0,0) with the equation model :
XRD data on Lanthanum Oxide (10 %) Doped Lithium Niobate could be well predicted by ARIMA (3,0,0) with the equation model :
ARIMA model l for FTIR data is more accurate than ARIMA model for XRD data,
since R2 of ARIMA model of FTIR data is greater than R2 of ARIMA model of XRD
data and MAPE of of ARIMA model of FTIR data is lower than MAPE of of ARIMA model of XRD data.
Lanthanum oxide doped to lithium niobate Increasing of FTIR value that
indicated adding Lanthanum Oxide to Lithium Niobate (LiNbO3) can increase
absorbing of LiNbO3 and has lowered the XRD 2168 that indicated parameter
6. Acknowledgement
This work was supported by Penelitian Unggulan Divisi (PUD), Ministry of Research, Technology, and Higher Education; Republic of Indonesia No. 011/SP2H/LT/DRPM/ IV/2017. Thanks also to the Indonesian Government who had given the chance for the authors to conduct this research.
Refferences
1. Irzaman, Y. Darvina, A. Fuad, P. Arifin, M. Budiman, and M. Barmawi. Physical and
Pyroelectric Properties of Tantalum Oxide Doped Lead Zirconium Titanate
[Pb0.9950(Zr0.525Ti0.465Ta0.010)O3] Thin Films and Its Application for IR Sensor. Physica
Status Solidi (a), Germany, 199 (3), 416 – 424, 2003.
2. Irzaman, H. Syafutra, E. Rancasa, A. Wahidin Nuayi, Tb. Gamma Nur Rahman, N. Aisyah
Nuzulia, I. Supu, Sugianto, F. Tumimomor, Surianty, O. Muzikarno, and Masrur. The Effect of
BaSr Ratio on Electrical and Optical Properties of BaxSr(1-x)TiO3 (x = 0.25; 0.35; 0.45; 0.55) Thin
Film Semiconductor. Ferroelectrics. 445 (1) : 4-17, 2013.
3. Irzaman, Ridwan Siskandar, Aminullah, Irmansyah, and Husin Alatas. Characterization of
Ba0,55Sr0.45TiO3 Films As Light And Temperature Sensors And Its Implementation on
Automatic Drying System Model. Integrated Ferroelectrics. 168 (1), 130-150, 2016.
4. Irzaman, Y. Pebriyanto, E. Rosidah Apipah, I. Noor, A. Alkadri. Characterization of Optical
and Structural of Lanthanum Doped LiTaO3 Thin Films. Integrated Ferroelectrics. 167(1),
137-145, 2015.
5. Irzaman, Henni Sitompul, Masitoh, Mohammad Misbakhusshudur and Mursyidah. Optical
and Structural Properties of Lanthanum Doped Lithium Niobate Thin Films. Ferroelectrics. 502 (1), 9-18, 2016.
6. Wu, N.J, Y.S. Chen, S. Dorderic, A. Ignatiev. Pyroelectric IR Sensor Based on Oxide
Heterostructures on Si (100) and LaAlO3 (100) Substrates. Proceeding Third International
Conference on Thin Film Physiscs and Applications. SPIE Vol. 3175, page 256 – 261.
7. Lee, B.T, W.D. Kim, K.H. Lee, H.J. Lim, C.S. Kang, H. Hideki. Electrical Properties of
Sputtered BST Thin Films Prepared by Two Step Deposition Method. Journal of electronic Materials. 28 (4), L9 – L12, 1999.
8. Itskovsky. M.A. Kinetics of Ferroelectric Phase Transition : Nonlinear Pyroelectric Effect and
Ferroelectric Solar Cell. Jpn. J. Appl. Phys. 38 (8), 4812 – 4817, 1999.
9. Whitaker, T. Focal Plane Arrays Fabricated from Compound Semiconductor Materials are
at The Heart of Many Infrared Imaging Systems and Nigth Vision Cameras. Compound Semiconductor Spring II, 4 (4), 17 –23, 1998.
10. Izuha, M., and K. Abe. Electrical Properties and Microstructure of Pt/BST/SrRuO3 Capacitors.
Appl. Phys. Lett. 70 (11), 1405 – 1407, 1997.
11. Miles. R. W. Photovoltaic solar cells; Choice of materials and production methods. Science
direct, Vacuum, 80, 1090-1097, 2006.
12. Galiana, B., I. R. Stole, M.Baudrit, I. Garcia and C. Algora. A comparative study of BSFlayers
13. Shin, J.C., J. Park, C.S. Hwang and H.J. Kim. Dielectric and Electrical Properties of Sputter Grown BST Thin Films. J. Appl. Phys. 86 (1), 506 – 513, 1999.
14. Kawakubo, T., K. Abe, S. Komatsu, K. Sano, N. Yanase and H. Mochizuki. Novel Ferroelectric
Epitaxial BST Capacitor for Deep Sub Micron Memory Applications. IEEE Electron Device Letters. 18 (11), 529 – 531, 1997.
15. Cha, S.Y., B.T. Jang and H.C. Lee. Effects of Ir Electrodes on The Dielectric Constant of BST
Thin Films. Jpn. J. Appl. Phys. 38 (1A), L49 – L51, 1999.
16. Baumert, B.A., L.H. Chang, A.T. Matsuda and C.J. Tracy. A Study of BST Thin Films for Use in
bypass Capacitors. J. Mater. Res. 13 (1), 197 –204, 1998.
17. Cheng, J.G., J. Tang and J.H. Chu. Pyroelectric Properties in Sol-Gel Derived BST Thin Films
Using a Highly Diluted Precursor Solution. Appl. Phys. Lett. 77 (7), 1035 – 1037, 2000.
18. Vargas, S., R. Arroyo, E. Hari and R. Rodriguez. Effects of Cationic Dopant on The Phase
Transition Temperature of Titania Prepared by The Sol-Gel Method. J. Mater. Res., 14 (10), 3932 – 3937, 1999.
19. Wang, F., A. Uusimaki and S. Leppavuori. BST Ferroelectric Film Prepared with Sol-Gel
Process and Its Dielectric Performance in Planar Capacitor Structure. J. Mater. Res. 13 (5), 1243 – 1248, 1998.
20. Yoon, K.H., J.H. Park and J.H. Jang. Solution Deposition Processing and Electrical Properties
of Ba(Ti1-xSnx)O3 Thin Films. J. Mater. Res. 14 (7), 2933 –2939, 1999.
21. Kim, S., T.S. Kang and J.H. Je. Structural Characterization of Laserr Alblation Epitaxial BST
Thin Films on MgO (001) by Synchrotron x-Ray Scattering. J. Mater. Res., 14 (7), 2905 – 2911, 1999.
22. Gao, Y., and S. He. Effect of Precursor and Substrate Materials on Microstructure, Dielectric
Properties, and Step Coverage of BST Films Grown by Metalorganic Chemical Vapor Deposition. J. Appl. Phys. 87 (1), 124 – 132, 2000.
23. Momose, S., T. Nakamura and K. Tachibana. Effects of Gas Phase Thermal Decompositions of
Chemical Vapor Deposition Source Moleculeson The Deposition of BST Films. Jpn. J. Appl. Phys. 39 (9B), 5384 – 5388, 2000.
24. Frutos, J., A.M. Gonzales, M.C. Duro, F. Lopez, J. Meneses, A.J. de Castro and J.
Melendez. New Environmental Infrared Sensors. IEEE Electron Device Letters. 203 – 206, 1998.
25. Lim, S.S. M.S. Han, S.R. Hahn and S.G. Lee. Dielectric and Pyroelectric Properties of
(Ba,Sr,Ca)TiO3 Ceramics for Uncolled Infrared Detectors. Jpn. J. Appl. Phys. 39 (8), 4835 –
4838, 2000.
26. Washo, B.D. Reology and Modelling of the Spin Coating Process. IBM Res. Develop. 190 –
198, 1977.
27. Daughton, W.J. and F.L. Givens. An Investigation of the Thickness Variation of Spun-on Thin
Films Commonly Associated with the Semiconductor Industry. J. Electrochem. Soc., 173 – 179, 1982.
28. Meyerhofer, D. Characteristics of Resist Films Produced by Spining. J. Appl. Phys. 49 (7),
3993 – 3997, 1978.
29. Scriven, L.E. Physics and Application Dip Coating and Spin Coating. Mat. Res. Soc. Symp.
30. Walsh, C.B., and E.I. Franses. Thickness and Quality of Spin Coated Polymers Films by Two Angle Ellisopmeter. Thin Solid Films. 347, 167 – 177, 1999.
31. Uchino, K. Ferroelectric Devices. Marcel Dekker, Inc. New York. 23, 2000.
32. Ma, C, Dou A, Chen L, Li Y, Tan X, Dong P, Zhang J,Zheng L, Zhang P.A new nondestructive
instrument for bulk residual stress measurement using tungsten Kα1 X-ray. Review Of Scientific Instruments. 87, 1-7, 2016.
33. Hou, Y, Ji X, Zou L, Liu S, Su X. Performance of cement stabilized crushed brick aggregates in
asphalt pavement base and subbase applications. Road Materials and Pavement Design 1-16, 2015.
34. Dubey, S, Gubrele D, Rao R M. Standardization of Yogaamruto Rasa by Using Modern
Analysis Techniques. 4, 27-23, 2016.
35. Pawan, R, Shalini P, Sridurga C. Analytical Study of Panchshara Rasa Through XRD, SEM,
EDX, and ZP. International Journal of Ayurveda and Pharma Research. 4, 35-40, 2016.
36. Erinosho, T O, Collins D M, Wilkinson A J,Todd R I, Dunne F P E. Assessment of X-ray
Diffraction and Crystal Plasticity Lattice Strain Under Biaxial Loading. International Journal of Plasticity. 1-29, 2016.
37. Yusuf, N Y, Masdar M S, Isahak W N R W, Nordin D, Husaini T, Majlan E H, Rejab S A M,
Chew C L. Ionic liquid impregated activated carbon for biohydrogen purification in an adsorption unit. IOP Conference Series: Materials Science and Engineering. 1-12, 2016.
38. Karami, F, Khanmohammadi, Garmarudi. ATR-FTIR spectroscopy and chemometrics
application for analytical and kinetics characterization of adsorption of 1-butyl mercaptan (1-butanethiol) on nickel coated carbon nanofibers (CNFS). Bulgarian Chemical Communications. 48, 51-56, 2016.
39. Jiang, X, Li S, Xiang G, Li Q, Fan L, He L, Gu K. Determination of the acid values of edible oils
via FTIR spectroscopy based on the OAH stretching band. Food Chemistry. 212, 585-589, 2016.
40. Toon, G C, Blavier J, Sung K, Rothman L S, Gordon I E. HITRAN spectroscopy evaluation
using solar occulation FTIR spectra. Journal of Quantitative Spectroscopy and Radiative Transfer. 182, 324-336, 2016.
41. Yogaraksa, T, Hikam, M, Irzaman. Rietveld analysis of ferroelectric PbZr0.525Ti0.475O3 thin
films. Ceramics International. 30, 1483–1485, 2004.
42. Aidi, M. M, Masjkur, M, Siswadi, Pramudito, S, Arif, A, Syafutra, H, Alatas, H and Irzaman.
Phase Transformation of Ba0.55Sr0.45TiO3 Tetragonal to Pseudotetragonal Structures and Arima Model for M. , N,XRD Data. International Journal of Statistic and Application. 3 (5): 19-187, 2013.
43. Kar, S, S. Logad, O. P. Choudhary, C. Debnath, S. Verma, and K. S. Bartwal. Preparation of
Lithium Niobate Nanoparticles by High Energy Ball Milling and their Characterization. Universal Journal of Material Sciences. 2, 18–24, 2013.
44. Yue, W, and J. Y. Jian. Crystal Orientation Dependence of Piezoelectric Properties in LiNbO3
and LiTaO3. Optical Materials. 23, 403–408, 2003.
46. Weidenfelder, A, J. Shi, P. Fielitz, G. Borchardt, K. D. Becker, and H. Fritze. Electrical and Electromechanical Properties of Stoichiometric Lithium Niobate at High-Temperatures. Solid State Ionics. 225, 26–29, 2012.
47. Bornand, S, I. Huet, J. F. Bardeau, D. Chateigner, and Papet Ph. An Alternative Route for the
Synthesis of Oriented LiNbO3 Thin Films. Integrated Ferroelectric. 43, 51–64, 2002.
48. Shandilya,S, K. Sreenivas, R. S. Katiyar, and V. Gupta. Structural and Optical Studies on
Texture LiNbO3 Thin Film on (0001) Sappire. Journal of Engineering and Materials Sciences. 15, 355–357, 2008.
49. Gopalan and Venkatraman. Handbook of advanced electronic and photonic materials and
devices; New York: Crystal Growth, Characterization, and Domain Studies in Lithium Niobate and Lithium. Tantalate Ferroelectrics. 2001.
50. Cabuk, S, and A. Mamedov. A Study of the LiNbO3 and LiTaO3 Absorption Edge. Tr. J. of
Physics. 22, 41–45, 1998.
51. Yue, W, and J. Yi-jian, Crystal orientation dependence of piezoelectric propertiesin LiNbO3
and LiTaO3. Optical Materials. 23, 403–408, 2003.
52. Wang, R, and S. A. Bhave, Free-standing high quality factor thin-film lithium
Niobatemicro-photonic disk resonators. Optical Society of America. 1–6, 2014.
53. Sadani, B, N. Courjal, G. Ulliac, N. Smith, V. Stenger, M. Collet, F. I. Baida, and M. P. Bernal.
Enhanced electro-optical lithium Niobatephotonic crystal wire waveguide on a smart-cutthin film. Optical Society of America. 20 (3), 1–8, 2012.
54. Kashit, I, A. A. Soliman, E. M. Sakr, and A. Ratep, Effect of Different Conventional Melt
Quenching Technique on Purity of Lithium Niobate (LiNbO3) Nano Crystal Phase Formed in Lithium Borate Glass. Physics. 2, 207–211, 2012.
55. Milz, S, J. Rensberg, C. Ronning, and W. Wesch, Correlation Between Damage Evolution,
Cluster Formation and Optical Properties of Silver Implanted Lithium Niobate. Nuclear Instruments and Methods in Physics Research B. 286, 67–71, 2012.
56. Alim, M.A, A. K. Batra, S. Bhattacharjee, and M. D. Anggarwal, Complex Capacitance in the
Representation of Modulus of the Lithium Niobate Crystals. Physica B. 406, 1088–1095, 2011.
57. Andrushchak, A.S, O. V. Yurkevych, O. A. Burry, V. S. Andrushchak, R. S. Kolodiy, I. M.
Solskii, D. Calus, and A. Rusek, Spatial Anisotropy of the Linear Electro-Optic Effect in Lithium Niobate Crystals: Analytical Calculations and their experimental verification. Optical Materials. 45, 42–46, 2015.
58. Twiefel, J and T. Morita, Utilizing Multilayer Lithium Niobate Elements for Ultrasonic
Actuators. Sensors and Actuators A. 166, 78–82, 2011.
59. Burr, G. W, S. Diziain, and M. P. Bernal, Theoretical Study of Lithium Niobate Slab
Waveguides for Integrated Optics Applications. Optical Materials. 31, 1492–1497, 2009.
60. Liu, M, and D. Xue,. Effect of Heating Rate on the Crystal Composition of Ferroelectric
Lithium Niobate Crystallites. Journal of Alloys and Compounds. 427, 256–259, 2007.
61. Bharath,S, C, K. R. Pimputkar, A. M. Pronschinske, and T. P. Pearl, Liquid CrystalDeposition
on Poled, Single Crystalline Lithium Niobate. Applied Surface Science. 254, 2048–2053, 2008.
62. Ismon, M.D.S, H. H. Kusuma, and M. R. Sudin, A Study of The Linbo3 Crystal Growth Rocess
63. Petukhov, I.V, V. I. Kichigin, A. P. Skachkov, S. S. Mushinsky, D. I. Shevtsov, and A. B. Volyntsev, Microindentation of Proton Exchange Layers on X Cut of Lithium Niobate Crystals. Materials Chemistry and Physics. 135, 493–496, 2012.
64. Box, George; Jenkins, Gwilym (1970). Time Series Analysis: Forecasting and Control. San
Francisco: Holden-Day.
65. Liu, K., Chen Y. and Zhang X. An Application of the Seasonal Fractional ARIMA model to the
Semiconductor Manufacturing. IFAC Papers Online. 50-1,8097-8102, 2017.
66. Sen, P, Roy M and Pal P. Application of ARIMA for forecasting energy consumption and GHG
emission: A case study of an indian pig iron manufacturing organization. Energy, 1031-1038, 2016.
67. Zafra, C, Angel Y and Torres E. ARIMA analysis of the effect of land surface coverage on
PM10 concentrations in a high-altitude megacity. Atmospheric Pollution Research, 1-9, 2017.
68. Yuan, C, Liu S and Fang Z. Comparison of China's primary energy consumption forecasting by
using ARIMA and GM model. 2016, 384-390. 2016.
69. Jeyasekar, A, Raja SVK and Uthra RA. Congestion Avoidance Algorithm Using ARIMA
Model-Based RTT in Heterogeneous Wired-Wireless Networks. Journal of Network and Computer Application. 1-42, 2016.
70. Oliveira, PJ, Steffen JL and Cheung P. Parameter Estimation of Seasonal Arima Models for
Water Demand FOrecasting using the Harmony Search Algorithm Procedia Engineering, Vol. 186, 177-185, 2017.
71. Koutroumanidis, T, Ioannou K, Arabatzis Garyfallos. Predicting fuelwood pricesin Greece
with the use of ARIMA models, artificial neural network and hybrid ARIMA-ANN model. Energy Policy. 37, 3627-3634, 2009
72. Qin, M, Li Z. and Du Z. Red tide time series forecasting by combining ARIMA.