Maintainability Model with Object-Oriented
Software Metrics
Mr. N.V.Syma Kumar Dasari and Dr. Satya Prasad Raavi
Research Scholar, Dept. of Computer Science, Krishna University, Machilipatnam, A.P., India.
Assoc. Professor, Dept. of CSE, Acharya Nagarjuna University, Guntur. A.P., India.
Abstract-- Software maintainability is an effective measure for the system quality in the stage of software development. Understandability, modifiability and analyzability are the important factors of the software maintainability that can judge the maintainability of the system. These three factors depend mainly on the 3 size and 8 structural metrics of various UML specifications. We proposed the different models to measure the maintainability and its important three factors in this paper. In the process of developing the models we used exponential non-linear representation. We utilized regression approach along with two-tailed t-test to find out the significance of the variables. The proposed methods are compared to the other non-linear models also made in this research paper.
Index Term-- Analyzability Model, Modifiability Model, Maintainability model, Software Quality, t-test. Understandability Model.
I. INTRODUCTION
The software maintainability plays the significant role in judging the software quality of the system in the development stage of the software life cycle. Software maintainability is the major attribute compared to other factors of the software quality. Maintainability may depend on the several non-functional requirements [1], [10], [26] of the system like as Understandability, Analyzability, Modifiability, Durability, Flexibility…etc. Software maintainability is a challenging task and cost effective because there are no proven measures for this factor [11].
In the object-oriented system design class diagrams plays the major role to estimate the maintainability of the system in the form of various models. Here we focused on the three quality attributes of the software maintainability viz., as Understandability, Modifiability and Analyzability. The well-known standard ISO/IEC-9126-1[25] describes the Understandability Modifiability factors and ISO/IEC-9126-3 [5] reveals the information about the Analyzability phase of the Software Maintainability. In this paper we consider the size and structural metrics for establishing the models for maintainability and its factors.
Regression approach is utilized by us to identify the independent variables for the dependant variables. The t-test is used for the purpose of finding the significant factors which reside in the proposed models and remaining non-significant factors are simply discarded from the final model. Weighted-sum method [4] is also used in the maintainability values prediction with help of its factors. In the non-linear representation of the maintainability and its factors we used the sample data as per the requirements of the exponential notation.
The road map of the paper is as follows. We discussed the Importance of the software maintainability and its factors in Section-I. Section-II shows the literature survey regarding the research topic. Metrics section and sample data for the purpose of estimating models was done in Section-III and Section-IV and. Section-V reveals useful information regarding the research topic and statistical importance of the various estimated models respectively. Comparison of the proposed maintainability model to the other non-linear models is done in the Section -VI. Section-VII gives the conclusion of the paper. The remaining future work was discussed in Section8.
II. LITERATURE SURVEY
Depending upon the various factors like completion time of the variables, Lines of code…..etc. several authors[1],[2],[3],[10],[18],[19],[33],[34],[35] measured the software maintainability in good manner. Even though no one model was not giving the correct methodology toward software maintainability. In the prediction of the software maintainability estimation models the regression approach plays the crucial role. The maintainability and its factors are non-functional requirements for this reason regression approach is the best fitted factor for the purpose of finding the models for maintainability.
models with the help of regression approach. In these models several independent factors were taken into account of the maintainability model. This model took much time to calculate the maintainability model and its factors as Understandability and Modifiability models. With the help of back ward step wise regression approach Rizvi et al.[21] developed the linear model for the maintainability and its factors understandability and modifiability with the help of sample data[22],[36]and every model takes the more number of significant attributes for calculating the different models. This model requires more number regression steps until got the zero significant factors.
Satyaprasad et al.[14],[24] proposed the models for Understandability, Modifiability, Analyzability and Maintainability factors with the help of log-normal non-linear standards. In these papers used method was two tailed t-test for finding the significant factors for the dependent variable. Here only one step regression process was applied and two more new levels were introduced (i.e.trivial and consequential) for finding the factors of maintainability in easy manner. Here less number of significant factors were identified in every model. In this paper we are trying to come with a new approach in the non-linear model by using same regression technique. The new approach used here is exponential notation instead of log-normal for getting the new models for maintainability and its factors.
III. METRICS SELECTION
In the OOD with UML specification some of the authors [7],[13],[28] produced the metrics towards software maintainability with the help of various class diagrams. Along with these metrics many more OOD metrics [6], [8], [9], [10], [12], [15], [16], [17], [23], [27], [29],[30], [31], [32], [37] were developed by the different authors to be utilized in various applications for the good system maintenance. In this paper we use total 11 metrics for finding the different models of maintainability factors. These 11 metrics are correlated, empirically validated [40] and measured with the factors of maintainability.
The total 11 metrics are divided as 8 structural metrics and 3 size metrics. These structural and size metrics are developed on the specified class designs with UML specifications. The 8 structural metrics are NAssoc. (Number of Associations), NDep (Number of Dependencies), NGen(Number of Generalizations), NGenH (Number of GeneralizationHierarchies), MaxDIT (Maximum DIT), NAgg(Number of Aggregations), NAggH(Number of aggregation Hierarchies), MaxHagg(Maximum Hagg.). Remaining 3 size metrics are NC (Number of Classes), NA(Number of Attributes), NM(Number of Methods).
IV. SAMPLE DATA
Sample data identification plays the major role in the process of selection of the model for the factor. In this paper we proposed the models for maintainability and its factors. The maintainability factors (i.e., understandability,
modifiability and analyzability) depend upon the Size and structural complexity metrics of the given system. Data sets utilized in this are paper taken from Satyaprasad et al.[24]. Which contains two datasets,. one is for the purpose of identifying the models of Understandability, Modifiability and Analyzability. Second one utilizes the weighted-sum method for finding the maintainability model with help of Understandability, Modifiability and Analyzability factors. With the help of these two data sets we developed various non-linear models in the exponential notation.
V. PROPOSED METHODOLOGY FOR
ESTIMATING MODELS
In this paper we used two-tailed t-test methodology to find out the significant factors from variables with 0.05(95%) level of confidence. Here Degrees of Freedom (DF) variable should be taken as the difference between from total number of samples (n) to number of independent variables (t) with adding 1. The formula for the degrees of freedom (df) can be calculated as follows.
DF= n-t-1--- (1)
In this paper we applied only single attempt of regression to find the significant factors (important) only .For model estimation the remaining in-significant factors are discarded from the model consideration in single step.
Exponential notation was utilized for the purpose of estimating the non-linear multiplicative models in this paper. The form of multiplicative non-linear exponential representation is as
Y=e (1+a * X1+b * X2+C* X3+d * X4---) --- (2)
On both sides apply the log-normal transformation for the above multiplicative representation
Ln(Y) =Ln (e (1+a * X1+b * X2+C * X3+d * X4---)) --- (3) The above equation is simplified as follows
Ln(Y) = 1+a*X1+b*X2+c*X3+d*X4+--- (4)
By utilizing the above equation we proposed the various models for the datasets [20]. The datasets have total 45 samples of data. Among the 45 samples 35 samples are used for the purpose of model estimation. The remaining 10samples are used to find out the calculated values for the dependent factors.
A. Understandability Model
metrics only two of the metrics were significant means that they have greater t-value than the 2.07. The resultant significant factors namely NAgg and MaxDIT were displayed in the below table-I shows the understandability model with other useful information.
Table I t-values of the Model
Coefficient St.Error t Sig.
Constant 0.614 0.07 8.788 0
NAgg 0.045 0.02 2.27 0.033
MaxDIT 0.107 0.032 0.314 0.003
The exponential notation for the Understandability model is of the form.
Ln (U) =0.614+0.045*NAgg+0.107*MaxDIT --- (5) TableII
Model Summary
R R2 AdjR2 Std.Error
UND 0.981 0.961 0.943 0.4597
The value of the Coefficient of Determination (R2) and Adjusted R2 show how much effect of total variance on the estimated understandability mode in table-II. The ANOVA model for the Understandability with the statistical significance was shown inTable-III.
Table III
ANOVA for Understandability Source of
validation Sum Squares df
Mean
Square f Sig.
Regression 5.745 11 0.522 34.833 0
Residual 0.345 23 0.015
Total 6.09 34
Table-IV performs the comparison made between the calculated and actual valuesof understandability. Understandability values are calculated with the help of understandability model estimated with non-linear exponential notation. Here UA means Actual Understanbility and UC means calculated Understandability values. Table-V shows the Pearson’s correlation between the calculated and actual values of understandability model. The correlation values of the understandability were taken at 0.01(99%) level of significance.
TableIV
Actual and Calculated values for Understandability Model
1 2 3 4 5 6 7 8 9 10
UA 1.8 1.8 1.1 1.6 1.4 0.7 1.8 2.1 2.2 2.2
UC 1.2 1.3 0.7 1.1 1 0.7 1.3 1.3 1.4 1.3
Table V
Correlation between UA & UC values.
UA UC
UA 1 0.94
UC 0.94 1
B. Modifiability Model
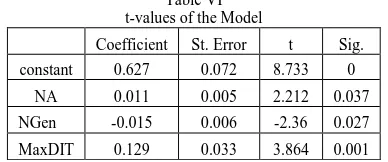
We had also taken the 8 structural and 3 size metrics of the different applications in the modifiability model estimation. Here the value of the two-tailed t-test with degrees of freedom of 23 is 2.07. Here three factors namely NA(Number of attributes),NGen(Number of Generalizations) and MaxDIT (Maximum DIT) had the greater t-value rather than the 2.07. The constant value and other information associated with model available in below table-VI.
Table VI t-values of the Model
Coefficient St. Error t Sig.
constant 0.627 0.072 8.733 0
NA 0.011 0.005 2.212 0.037
NGen -0.015 0.006 -2.36 0.027
MaxDIT 0.129 0.033 3.864 0.001
Consider the coefficient values of the above table the modifiability model is of the form
LN (M) =0.627+ 0.011* NA-0.015 * NGen+0.129*MaxDIT --- (6)
Table VII Model Summary
R R2 Adj.R2 Std.Error
MOD 0.0972 0.944 0.917 0.1258 Table-VII: Model Summary
The R2 and Adjusted R2 values were displayed in the table-VII shows the considerable effect on the Modifiability model. Table-VIIIshows the ANOVA model for the modifiability with 0.001 level of confidence.
Table VIII ANOVA for Modifiability
Source of validation
Sum of Squares df
Mean
Square f Sig.
Regression 6.127 11 0.557 35.194 0
Residual 0.364 23 0.016
Total 6.491 34
In table-IX and table-X shows MA means Actual Modifiability values and MC means calculated valueswith the estimated modifiability model in exponential notation. Table-9 is the comparison between the actual and calculated values of modifiability. The estimated and calculated values are also nearer to the actual values. Table-10 shows the Pearson correlation between the actual and calculated values of modifiability. Correlation values were taken with 0.001(99%) level of confidence.
Table IX
Actual and Calculated values for Modifiability Model
1 2 3 4 5 6 7 8 9 10
MA 1.8 2 1.1 1.6 1.4 0.7 2 2.2 2.2 2.2
TableX
Correlation between MA &MC values.
MA MC
MA 1 0.94
MC 0.94 1
C. Analyzability Model
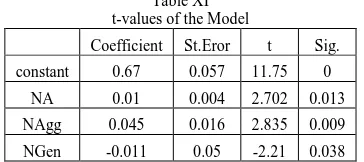
In the Analyzability model significant factors selection process isdone with the help of 3 size metrics and 8 structural metrics. Here the depth of freedom (df) value is 23 .Hence the 2-tail T-test value for the df value 23 is again 2.07.in this model 3 factors are became significant and remaining 8 factors are insignificant for the model identification. The significant factors for this model is NA(Number of
Attributes), NAgg(Number of Aggregations)
andNGen(Number of Generalizations) have greater value than 2.07. The associated value of the model and constant were displayed in the below table-XI.
Table XI t-values of the Model
Coefficient St.Eror t Sig.
constant 0.67 0.057 11.75 0
NA 0.01 0.004 2.702 0.013
NAgg 0.045 0.016 2.835 0.009
NGen -0.011 0.05 -2.21 0.038
The analyzability model with the above table data is of the form is
LN(A)= 0.67 + 0.01 * NA + 0.045 * NAgg -0.011 * NGen---(7)
Table XII Model Summary
R R2 Adj.R2 Std.Error
ANL 0.978 0.956 0.935 0.1
To know the total variance effect on the analyzability model the R2 and Adjusted R2 values were displayed in table-XII. The ANOVA model with 0.001(99%) level of significance was shown in table-XIII.
Table XIII ANOVA for Modifiability Source of
validation
Sum of Squares df
Mean
Square f Sig.
Regression 5.035 11 0.458 45.812 0
Residual 0.23 23 0.01
Total 5.265 34
The comparison between the actual and calculated values of analyzability is shown in the table-14. The calculated values of analyzability are taken with the model(7).
Here AA stands for actual analyzability and AC stands for calculated analyzability.The Pearson correlation on the calculated and actual values of analyzability was performed in table-15. The values for the correlation process are taken with the level of significance 99 %( 0.001).
Table XIV
Actual and Calculated values for Analyzability Model
1 2 3 4 5 6 7 8 9 10
AA 1.8 1.8 1.1 1.6 1.6 1.1 1.8 2.1 2.2 2.1
AC 1.2 1.3 1 1.1 1.2 0.9 1.2 1.3 1.1 1.2
Table XV
Correlation between MA &MC values.
AC AA
AC 1 0.72
AA 0.72 1
D. Maintainability Model
In the maintainability model estimation process understandability, analyzability and modifiability are taken as independent factors for the maintainability. The second dataset [20] was utilized in the process of estimating the maintainability model. Here also 35 samples of data was taken for the model estimation and remaining 10 samples were used for the purpose of comparison between the actual and calculated values of maintainability. The statistical significance and constant associated with maintainability model was displayed below table-XVI.
Table XVI t-values of the model
Coefficient St. Error t Sig.
Constant 0.489 0.044 11.07 0
U -0.078 0.052 -1.49 0.145
A 0.215 0.027 7.968 0
M 0.071 0.042 0.693 0.101
Maintainability model with the all three factors by utilizing the information of the above table-16 is of the from is as
LN (M) =0.489-0.078*U+0.215*A+0.071*M--- (8)
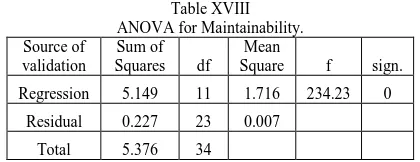
The R2and Adjusted R2value of the Table-XVII showshow much effect by total variance on the maintainability model. The ANOVA model on the maintainability with 99 %( 0.001) level of confidence was taken in table-XVIII.
Table XVII Model Summary
R R2 Adj.R2 Std.Error
Table XVIII ANOVA for Maintainability. Source of
validation
Sum of Squares df
Mean
Square f sign.
Regression 5.149 11 1.716 234.23 0
Residual 0.227 23 0.007
Total 5.376 34
In the validation process of the maintainability actual maintainability (MAIN-A) and calculated maintainability (MAIN-C) values were taken. In table-XIX the comparison performed between the actual and calculated values of maintainability. The resultant values are much nearer to the actual values of the maintainability. In the calculation of the maintainability values model (8) was taken into account. Table-XX shows the Pearson correlation with 99% level of significance between the actual and calculated values of maintainability.
TableXIX
Calculated and Actual values for Maintainability Model
1 2 3 4 5 6 7 8 9 10
MAIN-C 1.7 1.8 1.1 1.5 1.5 1.1 1.8 2.2 2.3 2.1
MAIN-A 1.8 1.8 1.1 1.6 1.6 1.1 1.8 2.1 2.2 2.1
TableXX
Correlation between Main-C&Main-A values.
MAIN-C MAIN-A
MAIN-C 1 0.986
MAIN-A 0.986 1
The table-XXI shows the information regarding the correlation among the maintainability and its factors. The below table shows the understandability, modifiability and analyzability factors were strongly correlated with the dependent factor maintainability. The values of the correlation analysis were taken at the 0.01(99%) level of confidence.
Table XXI
Correlation values between Maintainability and its Factors
MAIN UND ANL MOD
MAIN 1 0.966 0.985 0.963
UND 0.966 1 0.981 0.983
ANL 0.985 0.981 1 0.967
MOD 0.963 0.983 0.967 1
VI. COMPARISION WITH OTHER NON-LINEAR
MODELS
In this paper we made the comparison between this exponential non-linear model with other models [14] ,[24] which were based on the log-normal non-linear models. Here our first observation is the significant variables are different from one non-linear model to another model. In the
log-normal two types of models(1-7 level)(1-9 level) understandability and modifiability depend upon the same significant factors. Coming to the exponential notation the model was changed and also the significant factors are also changed for understandability, modifiability and analyzability. The second observation is the validation process also the log-normal non-linear model gives best results rather than exponential notation. The compared values so much nearer to the actual values in the log-normal model than exponential model. In the correlation (Pearson-correlation) process also log-normal shows effective results rather than exponential model in all the cases (understandability, modifiability, analyzability and maintainability).
The third observation regarding the statistical importance of the both models. Here log-normal models are simpler than the exponential models. The Coefficient of Determination (R2) and Adjusted R2 are higher values possible in the log-normal non-linear model than exponential notation. We observed that the ANOVA models are also better in log-normal models .
The fourth observation is the maintainability model of the log-normal model shows more and effective results displayed whether in the case of not only in statistical significance but also in the validation of the maintainability model. Hence we recommend the log-normal non-linear model for estimating the maintainability and its factors (i.e., understandability, modifiability and analyzability).
VII. CONCLUSION & FUTURE SCOPE Software maintainability is a typical task because no proper metric was existed for measuring this property. So more number of research persons depend on various model representations of maintainability and its factors. Here in this paper we represented one non-linear model representation named as exponential notation for the maintainability and its factors (i.e. Understandability, modifiability and analyzability). In each and every model representation we took the significant factors for model preparation and in-significant factors are discarded from model with the help of single step regression process. The statistical importance and validation of all the models was done in this paper. The comparison made between this exponential model and other log-normal non-linear model representation here. In the process of comparison we gained better results in log-normal non-linear model than exponential non-linear model.
REFERENCES
[1] P. Antonellis, D. Antoniou, Y. Kanellopoulos, C. Makris, E. Theodoridis,C. Tjortjis, and N. Tsirakis, “A Data Mining Methodology for Evaluating Maintainability According to ISO/IEC-9126 Software Engineering Product Quality Standard,” Proc. 11th IEEE Conference on Software Maintenance and Reengineering (CSMR2007), 21 – 23 Mar.2007, Amsterdam, Netherlands, 2007.
[2] M.S.Ranwat,A.Mittal,S.K.Dubey Survey on impact of software metrics on software quality (IJACSA)International journal of Advanced Computer Science and Applications, Vol.3,No.1,2012. [3] W. Harrison, K. Magel, R. Kluczny and DeDock, Applying
software complexity metrics to program maintenance, IEEE Computer, vol. 15, pp. 65-79, 1982.
[4] W. Harrison, K. Magel, R. Kluczny and DeDock, Applying software complexity metrics to program maintenance, IEEE Computer, vol. 15, pp. 65-79, 1982.
[5] ISO/IEC TR 9126-3, Software Engineering Product Quality, 2002. [6] S.S. Dahiya, J.K. Chabra, and S. Kumar, “Use of Genetic Algorithm for Software Maintainability Metrics Conditioning,” Proc. 15th International Conference on Advanced Computing and Communications, pp. 87 -92, 2007.
[7] H. Kim and C. Boldyreff, “Developing Software Metrics Applicable to UML Models”, Proc. Of the 6th ECOOP Workshop on Quantitative Approaches in Objected-Oriented Software Engineering, June 11, 2002.
[8] T. Kamiya, S. Kusmoto, and K. Inoue, “Prediction of Fault Proneness at Early Phase in Object-Oriented Development,” Proc. 2nd International Symposium on Object-Oriented Real Time Distributed Computing, pp.253 – 258, Saint-Malo, France, 1999. [9] M. Perepletchikov, C. Ryan, K. Frampton, and Z. Tari,
“CouplingMetrics for Predicting Maintainability in Service-Oriented Designs,”Proc. of Australian Software Engineering Conference (ASWEC'07), 10 – 13 April, 2007, pp. 329 – 340, Melbourne, Australia, 2007.
[10] M. Genero, E. Manso, A. Visaggio, and M. Piattini, “Building Measure- Based Prediction Models for UML Class Diagram Maintainability,” Journal of Empirical Software Engineering, vol. 12, no. 5, pp. 517 - 549, 2007.
[11] N. E. Fenton and S. L. Pfleeger, Software Metrics: A Rigorous and Practical Approach, PWS Publishing, 1997.
[12] B.F. Abreu and R. Carapuca, “Candidate Metrics for Object-Oriented Software within a Taxonomy Framework,” Proc. AQUIS’93 (Achieving Quality in Software), Venice, Italy, Oct. 1993; Selected for reprint in the Journal of Systems and Software, Elsevier-Science, vol. 23, no. 1, pp.87 - 96, July 1994.
[13] P. Oman and J. Hagemeister, “Metrics for Assessing a Software System’s Maintainability”, Proc. of Conference on Software Maintenance 1992. Orlando, FL, November 9-12, 1992, Los Alamitos, CA: IEEE Computer Society Press, 1992.
[14] D.N.V. Syma Kumar, R. Satya Prasad and Dr.R.R.L.Kantam
“Maintainability of Object-Oriented Software Metrics Using Non-Linear Model “International Journal of Advanced Research in Computer Science Engineering and Information Technology Volume: 5 Issue: 3 20-Mar-2015,ISSN_NO: 2321-3337.
[15] M. Bruntink and A. Deursen, “Predicting Class Testability using Object-Oriented Metrics,” Proc. 4th IEEE International Workshop on Source Code Analysis and Manipulation SCAM'04, 15 - 16 Sept., 2004, pp. 136 - 145, 2004.
[16] M. Hitz and B. Montazeria, “Chidamber and Kemerer’s Metrics Suite: a Measurement Theory Perspective,” IEEE Transactions on Software Engineering, vol. 22, no. 4, pp. 267 - 271, 1996. [17] J. Bansiya and C. Devis, “Automated Metrics and Object-Oriented
Development,” Dr. Dobb’s Journal, vol. 272, pp. 42 - 48, 1997. [18] J.H. Hayes and L Zhao, “Maintainability Prediction: a Regression
Analysis of Measures of Evolving Systems,” Proc. 21st IEEE International Conference on Software Maintenance, 26 - 29 Sept. 2005, pp. 601 - 604, 2005.
[19] J.H. Hayes, S.C. Patel, and L. Zhao, “A Metrics-Based Software Maintenance Effort Model,” Proc. 8th European Conference on
Software Maintenance and Reengineering (CSMR'04), 24 – 26 Mar. 2004, pp. 254 – 258, IEEE Computer Society, 2004. [20] S. Muthanna, K. Kontogiannis, K. Ponnambalam, and B. Stacey,
“A Maintainability Model for Industrial Software Systems Using Design Level Metrics,” Proc. 7th Working Conference on Reverse Engineering (WCRE’00), 23 - 25 Nov., 2000, pp. 248 – 256, Brisbane, Australia, 2000.
[21] S. W. A. Rizvi and R. A. Khan, “Maintainability Estimation Model for Object- Oriented Software in Design Phase (MEMOOD), 2010. [22] M. Genero, J. Olivas, M. Piattini, and F. Romero, “A Controlled Experiment for Corroborating the Usefulness of Class Diagram Metrics at the Early Phases of Object-Oriented Developments,” Proc. of the ADIS2001, Workshop on Decision Support in Software Engineering, vol. 84. Spain, 2001.
[23] H.M. Olague, L.H. Etzkorn, S.L. Messimer, and H.S. Delugach, “An Empirical Validation of Object-Oriented Class Complexity Metrics and their Ability to Predict Error-prone Classes in Highly Iterative, or Agile Software: a Case Study,” Journal of Software Maintenance, vol. 20, no. 3, pp. 171 - 197, 2008.
[24] R.Satya Prasad and D.N.V.Syma Kumar “Mainatanability of Object-Oriented Software Metrics with analyzability” International Journal of Computer Science issues, Volume12,Issue3,May 2015. [25] ISO/IEC 9126-1, Institute of Electrical and Electronics Engineers,
Part1: Quality Model, 2001
[26] Ajay Rana ,SoumiGhosh and S K Dubey, “Comparative Study of Factors that Affects Maintainability, International Journal on Computer Science and Engineering”, Vol 3 (12), December 2011. [27] J. Bansiya and C. Devis, “A Hierarchical Model for
Object-Oriented Design Quality Assessment,” IEEE Transaction on Software Engineering, vol. 28, no. 1, pp. 4 - 17, 2002.
[28] A. Hassan, W.M. Abdelmoez, R. M. Elnaggar and H. H. Ammar. “An Approach to Measure the Quality of Software Designs from UML Specifications”, Proc. of 7th InternationalConference Information Systems, Analysis and Synthesis, 2001.pp. 559-564.2001.
[29] R. Dumke and E. Foltin, “An Object-Oriented Software Measurement and Evaluation Framework,” Proc. 2nd European Software Measurement Conference FESMA’99, 4 - 8 Oct. 1999, pp. 59 – 68, Amsterdam, Netherlands, 1999.
[30] W. Li and S. Henry, “Object-Oriented Metrics that Predict Maintainability,”Journal of Systems and Software, vol. 23, no. 2, pp. 111 - 122,1993.
[31] M.O. Elish and K.O. Elish, “Application of TreeNet in Predicting Object-Oriented Software Maintainability: a Comparative Study,” Proc. of European Conference on Software Maintenance and Reengineering (CSMR’09), 24 - 27 Mar., 2009, pp. 69 - 78, 2009. [32] R.A. Khan, K. Mustafa, and S. Yadav, “Quality Assessment of
Object-Oriented Code in Design Phase”, Proc. 4th Annual International Software Testing Conference, pp. 20 – 25, Pune, India, 2004.
[33] M. Polo, M. Piattini, and F. Ruiz, “Using Code Metrics to Predict Maintenance of Legacy Programs: a Case Study,” Proc. of International Conference on Software Maintenance, ICSM 2001, pp. 202-208, IEEE Computer Society, Florence Italy, 2001. [34] I. Heitlager, T. Kuipers and J. Visser, A Practical Model for
Measuring Maintainability Software Improvement Group, Netherlands, 2007.
[35] B.W. Boehm, Characteristics of Software Quality, TRW Series of software Technology, Amsterdam, North Holland, 1978.
[36] M. Kiewkanya, N. Jindasawat, and P. Muenchaisri, “A Methodology for Constructing Maintainability Model of Object-Oriented Design,” Proc. 4th International Conference on Quality Software, 8 - 9 Sept., 2004, pp. 206 - 213. IEEE Computer Society, 2004.
[37] R.A. Khan and K. Mustafa, “Fault Proneness Model for Object-Oriented Software: Design Phase Perspective,” Journal of Information Technology. vol. 7, no. 4, pp. 698 - 701, 2008. [38] N.F. Schneidewind, “Methodology for Validating Software
Author’s Profile
Mr. D.N.V. Syma Kumar received B.Tech Degree from JNTU, Hyderabad and M.Tech from BHARAT University, Chennai. He is currently pursuing his Ph.D. from Department of Computer Science, Krishna University, Andhra Pradesh. Presently he is working as an Associate Professor in the Department of Computer Science & Engineering, S.S.N. Engg. College, Ongole,Andhra Pradesh.
R. Satya Prasad received Ph.D. Degree in computer science in the faculty of Engineering in2007 from AcharyaNagarjuna University, Andhra Pradesh. He received gold medal from AcharyaNagarjuna University for his outstanding performance inmaster’s degree. He is currently working as Associate Professor in the department of Computer Science & Engineering., AcharyaNagarjuna University. His current research is focused on Software engineering. He has published several papers in National & International Journals