Physicochemical Investigation of DYE Adsorption
By Brazilian Water Hyacinth (
EICHORNIA
CRASSIPES
)
Rivadávia Tavares Martins Filho
a, Haroldo C.B Paula*
a, Regina C.M. Paula
b,Ronaldo F Nascimento
a,
Ari Clecius Alves de Lima
a,
Diego de Quadros Melo
a,ca Department of Analytical and Physical Chemistry, Federal University of Ceará, 60451-970, Fortaleza, CE-Brazil b
Department of Organic and Inorganic Chemistry, Federal University of Ceará, 60455-760, Fortaleza, CE-Brazil
c Department of Chemistry, Federal Institute of Education and Science of Piauí, Rodovia Br 407, S/N, Campus Paulistana CEP:
64750-000, Paulistana, PI, Brazil.
*email : [email protected]
Abstract-- A full and detailed study was conducted with different parts of Brazilian water hyacinth (Eichornia crassipes), in order to investigate plant physicochemical properties and adsorption mechanism of a model dye (methylene blue) in aqueous solution. Different plant parts were evaluated by infrared spectroscopy and thermal analysis techniques. Several adsorption experimental parameters were analyzed such as contact time, effect of adsorbent dose, dye initial concentration, pH and temperature effect. The adsorption thermodynamics and kinetics were also investigated. The Langmuir, Freundlich, Temkin and B.E.T. isotherms were used to determine parameters such as the maximum adsorption capacity (qmáx), using linear
and non-linear models, whereby it was found that there is great discrepancy between qmáx values obtained by linear and non
linear isotherms of aforementioned models, which seems to point out to the inadequacy of these linear models for MB adsorption on WH plant parts. Thermodynamic data revealed that MB adsorption is exothermic and thermodynamically favored, being ruled by physical connections, likely involving weak Van der Waals forces.
Index Term--
Adsorption; Water hyacinth; Dyes; Isotherms; nonlinear model
1.0 INTRODUCTION
In recent years, much have been spoken by the academia in Brazil and worldwide, on waste, its disposal, accumulation and final destination, mainly because different wastes produced by humans pose serious environmental problems. Among them, it can be refer to those from textile, paint and plastic industries, which are highly colored effluents, presenting troublesome treatments and final disposals [1]. It is well known that uncontrolled waste disposal would change the dynamics of natural water reservoirs, leading to disturbances in an ecological system [2].
There are more than 10,000 commercially available dyes [3], mostly having complex chemical structures [4], being usually very difficult to decompose [5]. Methylene blue is a dye with chemical formula C16H18N3SCl, having several
harmful effects on humans, although not highly dangerous. It is harmful when it is ingested and when inhaled or in contact with skin. Moreover, it causes eye irritation [6].
Conventional methods of wastewater treatment such as coagulation, photobleaching and ozonation, are not very
effective in removing stains, and the method of adsorption on activated charcoal is more frequently employed, being more efficient, although more expensive [7]. Hence the great interest on different low cost biosorbents which could be applied to replace activated carbon on adsorption process. Several biosorbents have been used, including the bark of the wood [8], rice husk [8], banana peel [9], bamboo-based activated carbon [10], hazelnuts shell [11], water hyacinth [12,13], corncobs [14], sawdust [15] and treads of tire [16]. Water hyacinth (WH ) has also been used as biosorbent after chemical treatments [17], after washing in acid medium [18], treated with nitric acid [19], treated with phosphoric acid [20] and together with activated carbon, after treatment with phosphoric acid [21].
The water hyacinth (Eichornia crassipes) plant is a noxious weed roots present in fresh water and is listed as one of the worst aquatic weeds in the world [22]. Its high productivity and tolerance to variation of nutrients, temperature and pH levels have led to many of the environmental and economic problems such as biodiversity loss, interference with navigation, irrigation and power generation [22].
Notwithstanding some studies carried out on this plant, there is a lack of full information on infrared spectroscopy, thermogravimetric analysis and differential scanning calorimetry of water hyacinth from northeastern Brazil. This claims to a more detailed characterization, focusing on its potential use as a dye adsorbent.
In this sense, this study aimed to carry out a comprehensive investigation encompassing all parts of the water hyacinth of Northeastern Brazil, in order to evaluate its potential as a dye adsorbent, specifically, of methylene blue, in order to compare its properties with those of plants of different countries.
2.0 EXPERIMENTAL 2.1 Materials and methods
Methylene blue (MB) (CI 52015) of chemical formulae C16H18N3SCl, sodium hydroxide and chloridric acid were
Water hyacinth (WH) (Figure 1a) used in this study was collected in the Lagoon of Parangaba, in Fortaleza, state of Ceará and a voucher specimen of the sample was deposited in the Herbarium Prisco Viana, of the Biology Department of the Federal University of Ceará-UFC, under number 49095. Plant parts were thoroughly washed with water to remove sand and mud and immersed in distilled water, then were cut and separated into parts, and put to dry in an oven at 70 °C. After that, they were crushed, ground, passed through 60 mesh sieve and stored in proper location.
2.2 Characterization techniques
FT-IR, DSC and TGA were used to evaluate the physicochemical characteristics of WH. Fourier transform infrared (FTIR) spectroscopy of the different plant parts of water hyacinth were recorded using KBr pellets on a Perkin Elmer apparatus, with wavelengths ranging between 400 and 4000 cm-1. Scanning electron microscopy (SEM) images of the biosorbents were obtained with JEOL TSM 5800, 30 kV.
The WH thermal properties were evaluated by
thermogravimetric analysis (TGA) in a Shimadzu equipment, model 50 TGA, using a heating ramp of 10 °C min-1 from 25 to 900 °C, and differential scanning calorimetry (DSC) in an Shimadzu equipment model DSC 50 by heating about 5 mg of samples from 25 to 900 °C, using a heating rate of 10 °C min
-1
.
2.3 Adsorption/desorption tests of WH for methylene blue A stock solution of concentration 500 mg L-1 dye was prepared by dissolving the dye in distilled water and the experimental solutions were obtained by diluting the stock solution in exact proportions in order to obtain solution concentrations in the range 10-250 mg L-1. Adsorption experiments were performed in duplicate (n=2) in a refrigerated benchtop incubator,( CIENTEC), model CT-712R, with rotation of 75 rpm and temperature between 25 °C to 45 °C. Samples were placed in 50 mL beaker containing 30 mL of dye concentrations at different initial pH. The initial pH of the solutions was adjusted with HCl and NaOH 0.1 mol L-1 using a pH meter (PHTEK), model PHS-3B. Biomass concentrations in the range 0.3 to 3.0 g L-1 were added to each beaker. After shaking the vials in predetermined time
intervals, samples were removed and separated from the biomass of the dye solution by centrifugation.
The desorption experiments were performed in two steps: adsorption and desorption . In the adsorption step, 60 mg of biosorbent was added to 30 mL of dye solution of concentration 100 mg L-1. The solutions were maintained at 25 ° C in a refrigerated incubator (CIENTEC model CT- 712R) , at 75 rpm, for 24 h. In the desorption step, the biosorbent containing the dye was placed in a 50 ml beaker containing 30 ml of the eluent ( 0.1 M HCl ) and maintained under constant stirring (75 rpm) for a period of 24 h, at 25 ° C.
The concentrations of dye solution of the supernatant were estimated by measuring absorbance at a maximum wavelength (methylene blue, λmáx = 660 nm) in the Micronal spectrophotometer, model B582, using a calibration curve.
3.0 RESULTS AND DISCUSSION 3.1. Physicochemical characteristics of WH
3.1.1FTIR spectroscopy
The FTIR spectroscopic analysis of parts of water hyacinth components is shown in Figure 1b. The FTIR spectra indicate that the samples have similar absortion pattern, with common bands in the range of 1100 cm-1, 1600 cm-1 and 3500 cm-1. The bands at 900, 1060 and 1380 cm-1 are characteristic of carbohydrate units [23]. Shoulders at 1710 cm-1 suggests the possibility of intermolecular associations of carboxylic functions [24]. The bands at 1635 cm-1 can be assigned to stretching vibrations of the carboxylate anion [23] or O-H stretch of water molecules links. The vibrations of O-H stretching that appear with a broadband at 3410 cm-1 show the presence of water and alcoholic hydroxyl groups [25] and a small peak at 2924 cm-1 assigned to stretching vibrations of C-H. These results are similar to those reported for polysaccharides such as cellulose and hemicellulose and lignin. Peaks of the lignin components are shown at 1030 cm
-1, 1160 cm-1, 1230 cm-1 for guaiacyl and 1110 cm-1, 1320 cm-1
for syringyl [26].
4000 3500 3000 2500 2000 1500 1000 500
wavenumber / cm-1
Root Stolon Rhizome Petiole
3410
2924
1635 1060
1030 1110
900 1380
1160
1230
1320 1710
Fig. 1. (a) Eichornia crassipes plant parts: 1 – Rhizome (partially visible), 2 – stolon, 3 – Root, 4 – Petiole, 5 – Flower.; (b) FTIR spectrum of the different parts of water hyacinth.
3.1.2 Thermal analysis
Biomasses have as main components polysaccharides such as cellulose and hemicellulose, and other organic polymers such as lignin and their main functional groups are OH, CH, C-N, CH2OH, COOH [13,27]. Most lignocellulosic
materials have generally in their composition a mixture of 40-80 % cellulose, 15-30 % hemicellulose and lignin 10-25 % [27].
The thermogravimetric curves (TGA) of the different parts of the water hyacinth are shown in Figure 2a. For the
root, only two stages of mass losses are observed while for the rhizome, stolon and petiole three events are detected. The first event in all samples is due to loss of residual moisture, which follow the decreasing order rhizome > petiole > root > stolon. The second event corresponds to hemicellulose degradation,at 300 °C, while cellulose and lignin start to decompose at temperatures above 300 °C [27]. Thermograms revealed that WH plant parts have stability in the order: petiole < root < rhizome < stolon. Above 700 °C, root and petiole exhibit high ash content.
0
200
400
600
800
1000
0
20
40
60
80
100
0 200 400 600 800 1000 -0,7
-0,6 -0,5 -0,4 -0,3 -0,2 -0,1 0,0 0,1
d(
m
/m
0
)d
T
(
%
/°
C
)
Temperature (°C)
Weight / %
Temperature / °C
Root
Stolon
Rhizome
Petiole
0 100 200 300 400 500 600 -4
-3 -2 -1 0 1 2 3 4
exo
DSC / mW
Temperature / °C
Root Stolon Rhizome Petiole
Fig. 2. (a) Thermogravimetric and DSC (b) curves for the different parts of water hyacinth.
The peak decomposition temperatures (DTG) of WH parts and ashes at 900 °C are shown in insert of Figure 2a and listed in Table I. It can be seen that in the lower temperature region, the highest DTG value was obtained for the root and the lowest for stolon, while at temperatures above 700 °C,
high values were obtained for root and pethiole. This figures are in good agreement with the fact that root and petiole have high ash contents, in values higher than those previously reported [21].
Table I
Peak decomposition temperatures of the different parts of water hyacinth
Sample Peak temperatures (°C) Residue ( %)
Root 322 19.59
Stolon 287 1.57
Rhizome 303 16.23
Petiole 316 21.30
DSC curves obtained for different parts of the water hyacinth are shown in Figure 2b. All plant parts present endothermic peaks in the range 50 to 150 °C due to water evaporation. Above 200 °C most of the thermal decomposition was exothermic.
Double exothermic peaks were observed for WH root, in the temperature range 250-350 °C, whereas the stolon presents a single large peak in the same region. Similar data were reported [28] and events were attributed to hemicellulose and lignin decompositions in neem leaf powder. Rhizome and petiole show much smaller exothermic peaks.
The region of thermal decomposition of biomass depends on its main components, namely cellulose, hemicellulose and lignin [29]. Hemicellulose has a decomposition temperature lower than cellulose and lignin [30]. Exothermic peaks at temperatures of approximately 175 °C are related to the hemicellulose degradation. Double exothermic peaks in the range of 250-350 °C are attributed to decomposition of hemicellulose and lignin. The decomposition of cellulose is reported to start with an endothermic peak around 300 °C and ends with exothermic peaks near 370 °C.
3.2. Adsorption experiments
3.2.1Effect of dosage
The effects of the dosage of different parts of water hyacinth on MB dye adsorption are shown in Figure 3a. The percentage of dye adsorbed increased with increasing biomass concentration in the range 0.3 to 3.0 g L-1, likely due to the fact that the greater the amount of biomass the greater is the amount of available adsorption sites [31], but the maximum adsorption capacity will decrease because there will be an increased availability of adsorption sites, thus increasing the interaction and aggregation of particles, as a consequence of high adsorbent concentration [32]. Such aggregation would result in a decrease in total surface area of the adsorbent [33].
figures. Thus, the concentration of adsorbent chosen for further experiments was 2.0 g L-1.
0 1 2 3
40 50 60 70 80 90 100
Dye sorbed ratio / %
Sorbent dose / (g L-1)
Root Stolon Rhizome Petiole
Fig. 3. Effect of dosage on the adsorption of methylene blue by water hyacinth biomass, dye concentration: 100 mg L-1, particle size: 60 mesh, contact time: 24
hours, pH 6.5 to 7.0, 25 °C.
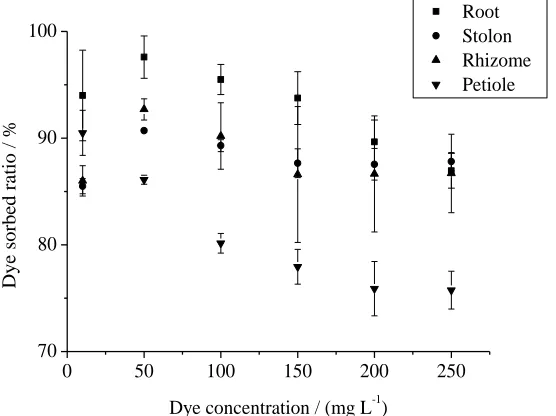
3.2.2 Influence of initial dye concentration
The influence of dye concentration on WH adsorption was investigated. As shown in Figure 4, when dye concentration was increased from 50 to 250 mg L-1, the
percentage of adsorption by the root decreased from 97.6 to 86.9 %, by the petiole from 86.1 to 75.7 %, by the rhizome from 92.7 to 86.7 % and by stolon from 90.7 to 87.8 %. At MB concentration range 50-250 mg L -1, the lowest adsorption was observed for petiole and the highest for root.
0 50 100 150 200 250
70 80 90 100
Dye sorbed ratio / %
Dye concentration / (mg L-1)
Root Stolon Rhizome Petiole
Fig. 4. Influence of dye concentration on methylene blue adsorption on different parts of water hyacinth biomass (adsorbent concentration: 2 g L-1, particle size:
60 mesh, contact time: 24 h, pH 6.5 to 7.0, 25 °C).
At low dye concentrations the adsorption ratio is high because the biomass is able to adsorb large amount of dye molecules, but at high dye concentrations, the adsorption sites
Gong et al [3] reported similar results using peanut shells for MB adsorption, where by dye adsorption percentages decreased from 95.97 to 62.11 %.
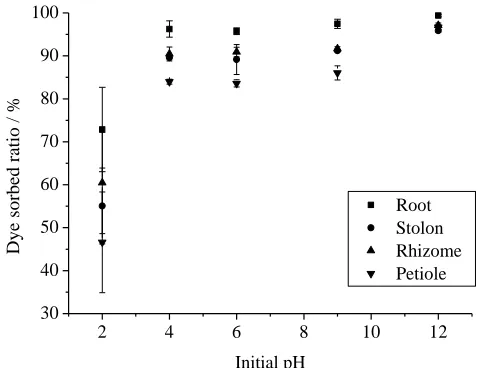
3.2.3 Effect of initial pH
The pH is a major factor in adsorption processes in aqueous solutions, because it directly affects the surface charge of adsorbents and the degree of ionization of the
adsorbate, thus contributing to the dissociation of functional groups on the surface adsorption sites of adsorvent [11].
The effects of initial pH on the adsorption ratios of MB dye were investigated at 25 °C in pH range from 2 to 12. As shown in Figure 5, in pH 2, removal is minimal, for all plant parts, taking values in the range 46.6 – 72.8 %. At pH 4-6, adsorption remains fairly constant in the range 85 -95 %, for all plant parts, being maximal for root.
2 4 6 8 10 12
30 40 50 60 70 80 90 100
Dye sorbed ratio / %
Initial pH
Root Stolon Rhizome Petiole
Fig. 5. Effect of initial pH on the adsorption of methylene blue with water hyacinth biomass as an adsorbent (adsorbent concentration: 2.0 g L-1, particle size: 60
mesh, contact time: 24 h);
In pH 12 the sorption is maximum for all plant parties, reaching 99.4 % for the root. It is likely that the low adsorption of methylene blue at low pH values indicates the possibility of formation of positive charges on the adsorbent, thus preventing the adsorption of methylene blue. In addition, at that pH range the adsorption of methylene blue may have been hindered, due to electrostatic repulsion between the positively charged dye cations. It also may have been a competition between H+ ions and protonated dye in the adsorption sites [34].
According to Tarawou [13], using water hyacinth for the adsorption of methyl red dye, there was a better adsorption in alkaline medium, reaching the best values at pH 8.
3.2.4 Effect of temperature
80 85 90 95
Dye sorbed ratio / %
Temperature / °C
Root Stolon Rhizome Petiole
298 308 318
Fig. 6. Effect of temperature on removal of methylene blue with different parts of the water hyacinth (dye concentration: 100 mg L-1, adsorbent concentration: 2.0
g L-1, particle size: 60 mesh, contact time: 24 h)
On the other hand, the adsorption of methylene blue dye on diatomite showed that increasing temperature promotes an increase in the maximum adsorption capacity and according to the authors, this should result in an increase the intraparticle diffusion [36].
Khattri and Singh [37] reported that a temperature increase in the process of adsorption of crystal violet dye on sawdust, affects the solubility and chemical potential of the adsorbate and that the solubility of the adsorbate increases with rising temperature. These effects were due to the drop of chemical potential, thus causing a reduction in adsorption ratio.
3.3 Adsorption isotherms
The amount of methylene blue adsorbed at equilibrium on different adsorbent parts of water hyacinth, qe (mg g-1) was calculated by mass balance according to Equation 1 [9,28].
W
V
C
C
q
o ee
(1)Where Co is the concentration of methylene blue (mg L-1), in
the liquid phase; Ce MB equilibrium concentration (mg L -1
) in the liquid phase, V volume (L) of solution and W the mass (g) of water hyacinth.
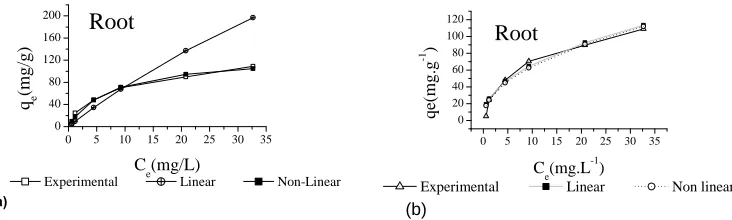
To determine the mechanisms related to the adsorption of MB onto MH, Langmuir and Freundlich, isotherm models were tested with the experimental data with the parameters being obtained using linear and nonlinear regression [38]. The adsorption isotherms obtained are shown in Figure 7( for the Root), and the parameters calculated for the models used are presented in Table II and III.
0 5 10 15 20 25 30 35
0 40 80 120 160 200
Experimental Linear Non-Linear
qe
(m
g/
g)
Ce(mg/L)
Root
(a)
Fig. 7. Comparison of the Langmuir (a) and Freundlich (b) adsorption isotherms using linear and non-linear models for the methylene blue dye at 298K adsorption on WH biomass (root).
Figure 7 shows that Langmuir non linear isotherm was found to fit better to the experimental data than linear one,
at equilibrium concentrations larger than 10 mg. L-1, whereas Freundlich isotherm fitted satisfactorily to both linear and non
0 5 10 15 20 25 30 35
0 20 40 60 80 100 120
Experimental Linear Non linear
qe
(m
g.g
-1 )
Ce(mg.L-1)
Root
linear models. Similar behavior was observed for other plant parts (data not shown).
3.3.1 Langmuir Isotherm Model
A Langmuir model assumes that adsorption occurs at specific homogenous sites within the adsorbent (monolayer adsorption), Equation 2[38]:
L e
e L máx e
C
K
C
K
q
q
1
(2)
Where Ce is the solute concentration at equilibrium (mg.L−1), qe is the amount of ions metals adsorbed at equilibrium (mg.g−1), kL is the Langmuir adsorption constant
(L.mg−1) and qmax is the monolayer capacity of the adsorbent
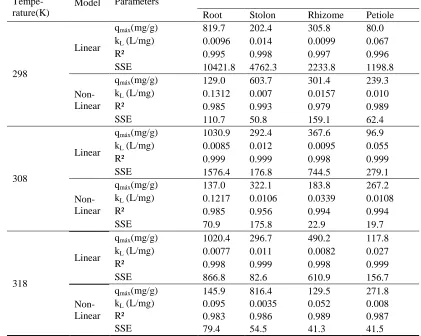
(mg.g−1). Efficient adsorbents are expected to have high kL and
qmax values. The values of qmax followed the order: Stolon >
Rhizome > Petiole > Root, Table II.
Table II
Parameters of Langmuir isotherms at 298, 308 and 318 K for different WH plant parts.
Tempe-rature(K)
Model Parameters
Root Stolon Rhizome Petiole
298
Linear
qmáx(mg/g) 819.7 202.4 305.8 80.0
kL (L/mg) 0.0096 0.014 0.0099 0.067
R² 0.995 0.998 0.997 0.996
SSE 10421.8 4762.3 2233.8 1198.8
Non-Linear
qmáx(mg/g) 129.0 603.7 301.4 239.3
kL (L/mg) 0.1312 0.007 0.0157 0.010
R² 0.985 0.993 0.979 0.989
SSE 110.7 50.8 159.1 62.4
308
Linear
qmáx(mg/g) 1030.9 292.4 367.6 96.9
kL (L/mg) 0.0085 0.012 0.0095 0.055
R² 0.999 0.999 0.998 0.999
SSE 1576.4 176.8 744.5 279.1
Non-Linear
qmáx(mg/g) 137.0 322.1 183.8 267.2
kL (L/mg) 0.1217 0.0106 0.0339 0.0108
R² 0.985 0.956 0.994 0.994
SSE 70.9 175.8 22.9 19.7
318
Linear
qmáx(mg/g) 1020.4 296.7 490.2 117.8
kL (L/mg) 0.0077 0.011 0.0082 0.027
R² 0.998 0.999 0.998 0.999
SSE 866.8 82.6 610.9 156.7
Non-Linear
qmáx(mg/g) 145.9 816.4 129.5 271.8
kL (L/mg) 0.095 0.0035 0.052 0.008
R² 0.983 0.986 0.989 0.987
SSE 79.4 54.5 41.3 41.5
SSE= sum of squared errors
The essential characteristics of Langmuir isotherm can be expressed by a dimensionless parameter called the equilibrium constant RL, which is defined by equation 3 [39]:
o L L
C
k
R
1
1
( 3)
Where kL is the Langmuir constant (L mg-1) and Co the
methylene blue initial concentration (mg L-1) in the liquid phase.
The value of RL indicates the type of isotherm to be unfavorable (RL> 1), linear (RL = 1), favorable (0 <RL <1) or irreversible (RL = 0). Under the same conditions, the values
methylene blue on water hyacinth can be accepted as appropriate when the RLvalues are close to zero [35].
3.3.2Freundlich Adsorption Isotherm
The Freundlich isotherm takes into account the heterogeneity of the surface, the distribution of active sites and their energies compared to the adsorbate [40]. Freundlich isotherm equation is given by equation 4:
n e f
e
K
C
q
1
(4)Where is KF is the Freundlich constant, and 1/n is the Freundlich exponent which is a constant related to the intensity of adsorption, i.e., the distribution of active sites and determines the heterogeneity of the surface and KF is a constant that determines the adsorbent adsorption capacity on the multilayer [41]. These values along with correlation coefficients of our work are presented in Table III.
Table III
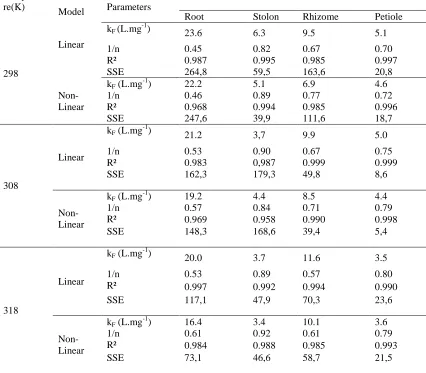
Parameters of Freundlich isotherms at 298, 308 and 318 K for different WH plant parts. Temperatu
re(K) Model Parameters
Root Stolon Rhizome Petiole
298
Linear
kF (L.mg-1) 23.6 6.3 9.5 5.1
1/n 0.45 0.82 0.67 0.70
R² 0.987 0.995 0.985 0.997
SSE 264,8 59,5 163,6 20,8
Non-Linear
kF (L.mg-1) 22.2 5.1 6.9 4.6
1/n 0.46 0.89 0.77 0.72
R² 0.968 0.994 0.985 0.996
SSE 247,6 39,9 111,6 18,7
308
Linear
kF (L.mg-1) 21.2 3,7 9.9 5.0
1/n 0.53 0.90 0.67 0.75
R² 0.983 0,987 0.999 0.999
SSE 162,3 179,3 49,8 8,6
Non-Linear
kF (L.mg-1) 19.2 4.4 8.5 4.4
1/n 0.57 0.84 0.71 0.79
R² 0.969 0.958 0.990 0.998
SSE 148,3 168,6 39,4 5,4
318
Linear
kF (L.mg-1) 20.0 3.7 11.6 3.5
1/n 0.53 0.89 0.57 0.80
R² 0.997 0.992 0.994 0.990
SSE 117,1 47,9 70,3 23,6
Non-Linear
kF (L.mg-1) 16.4 3.4 10.1 3.6
1/n 0.61 0.92 0.61 0.79
R² 0.984 0.988 0.985 0.993
SSE 73,1 46,6 58,7 21,5
SSE= sum of squared errors
Freundlich isotherm exhibiting highest KF value (23.6 L mg-1) for WH root and the minimal (5.1 L mg-1) for petiole. Algae42 present data in the range 4.2 – 13 L mg-1. Mesocarp and epicarp components of the babassu palm tree presented
maximum adsorption of the Turquoise Remazol dye of 1.44 and 2.38 mg g -1 [41]. Regarding to the correlation coefficients of both Langmuir and Freundlich models, it can be concluded that the WH experimental data applies well to both models.
temperature for WH root. The Langmuir constant for WH root decreases with the temperature, for the non linear model, remaining fairly constant for the linear model, the later meaning that the coverage of the adsorbate monolayer does not change, in the temperature range investigated.
Khan et al [43] reported values for WH root maximum adsorption capacity and Langmuir constant as being equal to 187 mg.g-1 and kL=0.116 L.mg-1, respectively. Moringa seed cake datafor chromium adsorption resulted in 3.191 mg g-1 and kL value of 0.089 L.mg-1 [44], while microalga spirulina
platensis adsorbed the metal presenting adsorption capacity of
100.39 mg g-1.
Data in Table 3 reveal that Freundlich constant 1/n is smaller for WH root, pointing out to its low surface heterogeneity compared to other plant parts while the n constant is greater than 1 for petiole, stolon, root and rhizome. Moring seed cake used as adsorbent yielded similar values for n constant.44 On the other hand 1/n increases with temperature
for Freundlich non linear model and remains constant for linear model. kF constant is larger for the root in the
temperature range investigated, demonstrating its better adsorption capacity.
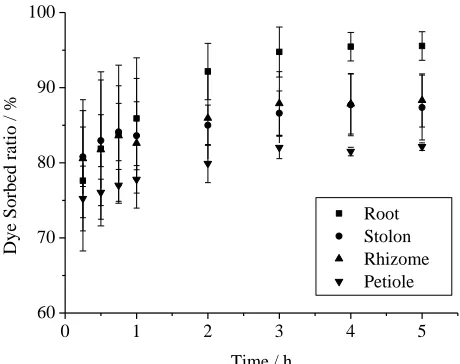
3.4 Kinetics of adsorption
Figure 8 illustrates the adsorption kinetics of methylene blue on different biomasses of water hyacinth at 298 K. The removal rates of the dye during the first hour of adsorption were very fast, adsorbing about 80 % of the dye. It was also observed that the sorption is practically the same for different plant parts, during the first three hours. After a very fast sorption, the removal increased slightly reaching about 95 % by the root, reaching equilibrium in about 4 h for all biomasses, probably due to saturation of their surface. This fact was also observed for the adsorption of methylene blue on peanut hull [3].
0 1 2 3 4 5
60 70 80 90 100
Dye Sorbed ratio / %
Time / h
Root Stolon Rhizome Petiole
Fig. 8. Kinetics of adsorption of methylene blue with different adsorbents of water hyacinth (dye concentration: 100 mg L-1 concentration of the adsorbent: 2 g L-1,
particle size: 60 mesh, pH 6.5 to 7.0, 298 K).
Kinetic studies were also performed with water hyacinth using different dyes such as Methyl Orange and Indigo Carmine, both acid dyes, and data did not result in good figures (data not shown), thus confirming the fact that WH has affinity for basic dyes, in good agreement with previously published data [46]. Experimental data were fitted to a Langergren equation of pseudo-first order according to Equation 5[28,45].
qeqt
l nqek1tl n (5)
Where qt is the amount of methylene blue adsorbed at a given time (mg g-1) and k1 the adsorption equilibrium constant of pseudo first-order (h-1).
A plot of ln (qe - qt) versus t gives the adsorption equilibrium constant of pseudo-first order. The MB adsorption data was also applied to a pseudo-second order model according to Equation 6. A plot of t / qt versus t shows a linear relationship if the experimental data fit well to the kinetics of pseudo-second order [45,46].
e e
t
q
t
q
k
q
t
2 2
1
(6)Where k2 is the adsorption equilibrium constant of
pseudo-second order (g mg-1h-1).
not in agreement with the experimental data, thus proving the inadequacy of the model. On the other hand, the calculated values fitted to the model of pseudo-second order, with appropriate correlation coefficients and thus justify its applicability.
The kinetic model of pseudo-second order was also reported as the most suitable for adsorption of methylene blue on wheat shells [47] and bamboo-based activated carbon [10]. Table IV shows that the adsorption kinetic constant increases with the temperature, in good agreement with literature.
Table IV
Kinetic parameters of adsorption of methylene blue on WA root.
Parameters Temperature (K)
298 308 318
qe (mg g-1) 46.1 44.6 44.7
Pseudo-first order
k1 (h-1) 1.07 1.46 2.07
qecal (mg g-1) 9.3 5.3 4.8
R2 0.988 0.878 0.912
Pseudo-second order
k2 (h-1) 0.25 0.59 0.92
qecal (mg g -1
) 47.7 45.3 45.2
R2 0.998 0.999 0.999
3.5 Desorption study
It can be seen, table V, that WA plant parts present satisfactory desorption values in the range 60.0 – 70.8 %, the
maximal figure being obtained by root. Orange peel employed for removal of an acid dye presented maximum desorption of 60% [49].
Table V
Methylene blue desorption on different WA plant parts
WA plant part Adsorption
(%)
Desorption (%)
Root 92.5 70.8
Stolon 81.9 61.7
Rhizome 87.2 65.5
Petiole 84.4 60.0
3.4 Thermodynamic study
The thermodynamic parameters of adsorption processes are important because they enable the determination of their spontaneity through the free energy (G°), the absorption or release of energy by their enthalpy change (H°) and the possibility of the molecules to organize themselves or not, by the change of entropy (S°) [50].
The thermodynamic parameters for the adsorption of methylene blue were investigated for the root of water hyacinth, as it has exhibited the best results for MB adsorption. The data were used for calculation of adsorption free energy (G°), enthalpy change of adsorption (H°) and entropy change of adsorption (S°). These parameters were calculated at temperatures of 298, 308 and 318 K. The free
energy (G°) was calculated using the following equation [50-52]:
L
k
RT
G
ln
(7)
Where kL is the equilibrium constant of adsorption
(Langmuir model) and R is the universal gas constant (8.314 J mol-1K-1).
The values of H° and S° were respectively determined from the slope and the intersection of the graph of
G° versus T plotted from Equation 6 [52].Table 6 presents the thermodynamic parameters for the adsorption at equilibrium of methylene blue on water hyacinth root.
S
T
H
G
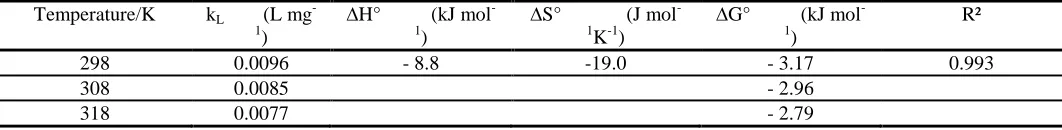
(8)Table VI
Thermodynamic parameters for equilibrium adsorption of methylene blue on water hyacinth root Temperature/K kL (L mg
-1) ∆H° (kJ mol
-1) ∆S° (J mol
-1K-1) ∆G° (kJ mol -1)
R²
298 0.0096 - 8.8 -19.0 - 3.17 0.993
308 0.0085 - 2.96
The change in Gibbs free energy (ΔG°) is the fundamental criterion of spontaneity of the process. A given process occurs spontaneously at a given temperature if ΔG° < 0 [52].
Data obtained revealed that for all temperatures studied, the negative values of ΔG show that MB adsorption is thermodynamically favored and that there is an increase in Gibbs free energy with decrease temperature, confirming the improved viability of the adsorption process at lower temperatures and the water hyacinth-dye interactions occurred spontaneously. These facts have also been reported by Hameed, Din and Ahmad [10] and Bulut and Aydin [53]. The apparent Gibbs free energy of sorption for methyl red, was reported as 15.55 kJ/mol, revealing a non spontaneous processs [54]. The negative value of entropy (S°) reflects the decreased randomness at solid-liquid interface, i.e. a more ordered structure is obtained after adsorption.
The negative value of H° indicates that the adsorption of methylene blue on the WH root is an exothermic reaction.
An adsorption process is generally considered to be physical35 when H° < 25 kJ mol-1 and chemical when H° > 40 kJ mol
-1 therefore, MB adsorption on WH roots is due to be ruled by
physical connections, likely involving weak Van der Waals forces.
Studies of adsorption of methylene blue on luffa
cylindrica fibers [35] resulted in an exothermic and
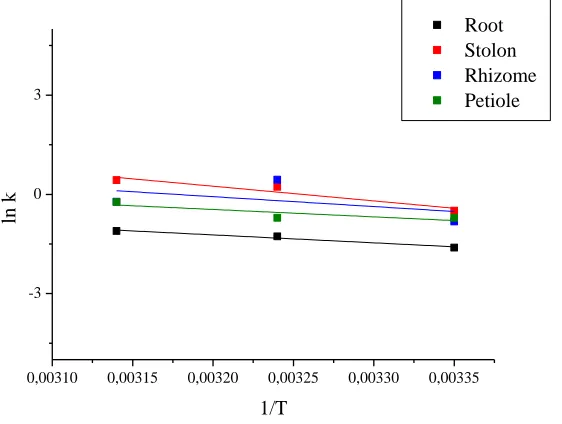
spontaneous process, as well as on Brazil nut shells [55] the later yielded values of H° = -5.22 kJ mol-1, ΔG° = -2.27 kJ mol-1 and ΔS° = -112.23 J mol-1K-1, thus demonstrating similarity of the obtained results. Activation energies also was calculed for MB adsorption on WH plant parts from Arrhenius equation using the pseudo-second order kinetic constants at different temperatures through a plot of ln k versus 1/T as shown in figure 9. The calculated activation energies are 19.6, 36.9, 24.8 and 18.6 kJ.mol-1 for root, stolon, rhizome and petiole, respectively, revealing that adsorption processes occur through physical interactions.
0,00310 0,00315 0,00320 0,00325 0,00330 0,00335 -3
0 3
Root Stolon Rhizome Petiole
ln k
1/T
Fig. 9. Thermodynamic parameters of MB dye sorption by WH.
4.0 CONCLUSIONS
It has been showed that different WH plant parts have distinct adsorption characteristics and can be used as adsorbent material for basic dyes such as methylene blue, yielding maximum adsorption values of 603.7mg g-1, for the stolon, non linear model, at room temperature. For acid dyes such as methyl orange and indigo carmine the adsorption ratios were not significant.
The adsorption isotherms were well fitted to the Langmuir and Freundlich models, presenting satisfactorily values for their coefficient of determination, being slightly better for the Langmuir isotherm. Maximum adsorption ratio was found to be considerably higher than previously reported ones in countries such as Philippines and Egypt. Kinetic studies showed a good data experimental match to a pseudo-second order model. WH thermal properties were found to be
similar to those of biomasses such as wheat shells, peanut hull and palm tree fibers.
Thermodynamic studies revealed that MD adsorption on WH was an exothermic and spontaneous process, ruled by physical connections, likely involving weak Van der Waals forces.
Due to the abundance of water hyacinth in the aquatic environment and the consequent low cost and the hereby reported properties, it seems to become a viable candidate to be used as a dye bioadsorbent.
ACKNOWLEDGMENTS
REFERENCES
[1] Chiou, M. S.; Li, H.Y.; Chemosphere. 2003, 50, 1095.
[2] Guaratini, C. C. I.; Zanoni, M. V. B.; Quím. Nova.2000, 23, 71.
[3] Gong, R.; Li, M.; Yang, C.; Sun, Y.; Chen, J.; J. Hazard. Mater.
2005, B121, 247.
[4] Kapdan, I. K.; Kargi, F.; Process Biochem.2002, 37, 973.
[5] Tan, B. T.; Teng, T. T.; Omar, A. K. M.; Water Res.2000, 35, 596.
[6] Inel, O.; Kayikci, N.; T. Eng. Environ. Sci.1990, 14, 332.
[7] Chu, W.; Ma, C.; Water Res.2001, 35, 2453.
[8] McKay, G.; Porter, J. F.; Prasad, G. R.; Water Air Soil Pollut.
1999, 114, 423.
[9] Annadurai, G.; Juang, R.; Lee, D.; J. Hazard. Mater. 2002, B92, 263.
[10] Hameed, B. H.; Din, A. T. M.; Ahmad, A. L.; J. Hazard. Mater.
2007, 141, 819.
[11] Dogan, M.; Abak, H.; Alkan, M.; J. Hazard. Mater.2009, 164,
172.
[12] Low, K. S.; Lee, C. K.; Tan, K. K.; Bioresour. Technol.1995, 5, 79.
[13] Tarawou, T.; Junior, M. H.; Vicente, J. L.; Chem. & Biodiver.
2007, 4, 2236.
[14] Robinson, T.; Chandran, B.; Nigam, P.; Bioresour. Technol.2002,
85, 119.
[15] Shukla, A.; Zhang, Y. H.; Dubey, P.; Margrave, J. L.; Shukla, S. S.; J. Hazard. Mater.2002, 95, 137.
[16] Nunes, M. R.; Perez, G. M.; Loguercio, L. F.; Alves, E. W.;
Carreño, N. L. V.; Martins, J. L.; Garcia, I. T. S.; J. Braz. Chem. Soc. 2011, 22, 2027.
[17] El-Khaiary, M. I.; Gad, F. A.; Mahmoud, M. S.; Samy, H. E.;
Toxicol. and Environ. Chem.2009, 91, 1079. [18] El-Khaiary, M. I.; Europ. J. Scient. Res.2007, 19, 128.
[19] El-Khaiary, M. I.; J. Hazard. Mater.2007, 147, 28.
[20] El-Nabarawy, T. H.; Khedr, S. A.; Adsorp. Sci. and Technol.2000,
18, 385.
[21] Rashwan, W. E.; Girgis, B. S.; Adsorp. Sci. & Technol.2004, 22,
3.
[22] Malik, A.; Environ. Int. 2007,33, 122.
[23] Zheng, J.; Feng, H.; Lam, M. H.; Lam, P. K.; Ding, Y.; Yu, H.; J.
Hazard. Mater.2009, 171, 780.
[24] Dupont, L.; Guillon, E.; Environ. Sci. and Technol.2003, 37 (18),
4235.
[25] Lim, S. F.; Zheng, Y. M.; Zou, S. W.; Chen, J. P.; Environ. Sci. Technol.2008, 42, 2551.
[26] Fiol, N.; Escudero, C.; Villaescusa, I.; Bioresour. Technol.2008, 99, 5030.
[27] Marion, C.; Loppinet-Serani, A.; Denux, D.; Lasnier, J. M.;
Ham-Pichavant, F.; Cansell, F.; Aymonier, C.; Biomass and Bioenergy.
2010, 35, 298.
[28] Bhattarcharyya, G. K.; Sarma, A.; Dyes Pigm.2003, 57, 211.
[29] Strezov, V.; Lucas, J. A.; Strezov, L.; J. Therm. Anal. Cal.2003, 72, 907.
[30] Zhang, J. T.; Zhou, C. Y.; Liquor Making. 2007, 34 (4), 12.
[31] Ofomaja, A. E.; Ho, Y.; Dyes Pigm.2007, 74, 60.
[32] Shukla, A.; Zhang, Y.; Dubey, P.; Margrave, J. L.; Shukla, S. S.; J.
Hazard. Mater.2002, 95, 137.
[33] Perlinger, J. A.; Eisenreich, S. J.; Organic Substances and
Sediments in Water, Michigan, 1991.
[34] Hameeda, B. H.; El-Khaiaryb, M. I.; J. Hazard. Mater.2008, 159,
574.
[35] Demir, H.; Top, A.; Balköse, D.; Ülkü, S.; J.Hazard. Mater.2008,
153, 389.
[36] Al-Ghouti, M.; Khraisheh, M. A. M.; Ahmad, M. N. M.; Allen, S.;
J. Coll. Inter. Sci.2005, 287, 6.
[37] Khattri, S. D.; Singh, M. K.; Water, Air and Soil Pollut.2000, 120,
283.
[38] Melo DQ, Neto VOS, Oliveira JT, Barros, A L, Gomes E C C,
Raulino G S C, Longuinotti E , Nascimento R F. J. Chem. Eng. Data. 2013; 58 (3):798–806.
[39] Sousa Neto, V.O.; Melo, D.Q.;, de Oliveira, TC , Teixeira,
N.R.P., Silva, M.A.A.; Nascimento, R.
F. . J. Appl. Polym. Sci.2014, 131, 40744, doi: 10.1002 /
app.40744
[40] Atkins, P.; Paula, J.; Físico-química, 7th ed., Rio de Janeiro, 2002. [41] De Oliveira, M. W.; Hilsdorf, A. W. S.; Silva, A. F. S.; Oliveira,
A. F.; Quím. Nov.2009, 32, 1134.
[42] Vilar, V. J. P.; Botelho, C. M. S.; Boaventura, R. A. R.; Biores. Technol.2008, 99, 750.
[43] Khan et al, 2012, Water Air Soil Pollut. 2012, 223,2943.
[44] Meneghel, A.P.; Jr. A.C.G.; Strey, L.; Rubio, F.; Schwantes, D.;
Casarin , J.
[45] Quim. Nova, 2013, 36, 1104.
[46] Melo, D.Q. , Vidal, C.B , Silva, AL , Teixeira, R.N.P. , Raulino,
G.S.C ., Medeiros, T.C , Fechine, P.B.A ,Mazzeto,
S.E , Keukeleire, D.; Nascimento, R.F. J. Appl. Polym. Sci.2014,
131, 40883, doi: 10.1002/app.40883
[47] Xiao, G. ; Zhang, X. ; Su, H. ; Tan,
T. Bioresour. Technol. 2013 , 143 , 490 .
[48] Gurses, A.; Dogar, Ç.; Yalçin, M.; Açikyildiz, M.; Bayrak, R.;
Karaca, S.; J. Hazard. Mater.2006, B131, 217.
[49] Bulut Y.; Aydin, H.; Desalination. 2006, 194, 259.
[50] Sivaraj, R.; Namasivayam, C.; Kadirvelu, K. Waste Manag.2001,
21,105.
[51] Hong, S.; Wen, C.; He, J.; Gan, F.; Ho, Y.; J. Hazard. Mater.
2009, 167, 630.
[52] Kul, A. R.; Koyuncu, H.; J. Hazard. Mater.2010, 179, 332.
[53] Tan , M.; Liu , X.; Li, W.; Li, H. J. Chem. Eng.
Data, 2015, 60 (5), 1469.
[54] Bulut Y.; Aydin, H.; Desalination. 2006, 194, 259.
[55] Tarawou, T., Horsfall, M. and Vicente, José L. (2007), Chem.
Biodiv.2007, 4: 2236.
[56] Brito, S. M. O.; Andrade, H. M. C.; Soares, L. F.; Azevedo, R. P.;