T E C H N I C A L A D V A N C E
Open Access
The impact of test loads on the accuracy of
1RM prediction using the load-velocity
relationship
Mark G. L. Sayers
1*, Michel Schlaeppi
2, Marina Hitz
2and Silvio Lorenzetti
2,3Abstract
Background:Numerous methods have been proposed that use submaximal loads to predict one repetition maximum (1RM). One common method applies standard linear regression equations to load and average vertical lifting velocity (Vmean) data developed during squat jumps or three bench press throw (BP-T). The main aim of this project was to determine which combination of three submaximal loads during BP-T result in the most accurate prediction of 1RM Smith Machine bench press strength in healthy individuals.
Methods:In this study combinations of three BP-T loads were used to predict 1RM Smith Machine bench press strength. Additionally, we examined whether regression models developed using peak vertical bar velocity (Vpeak), rather than Vmean, provide the most accurate prediction of Smith Machine bench press 1RM. 1RM Smith Machine bench press strength was measured directly in 12 healthy regular weight trainers (body mass = 80.8 ± 5.7 kg). Two to three days later a linear position transducer attached to the collars on a Smith Machine was used to record Vmeanand Vpeakduring BP-T between 30 and 70% of 1RM (10% increments).
Results:Repeated measures analysis of variance testing showed that the mean values for slope and ordinate intercept for the regression models at each of the load ranges differed significantly depending on whether Vmeanor Vpeakwere used in the prediction models (P< 0.001). Conversely, the abscissa intercept did not differ significantly between either measure of vertical bar velocity at each load range. The key finding in this study was that 1RM Smith Machine bench press strength can be determined with high relative accuracy by examining Vmeanand Vpeak during BP-T over three loads, with the most precise models using Vpeakduring loads representing 30, 40 and 50% of 1RM (R2= 0.96,SSE= 4.2 kg).
Conclusions:These preliminary findings indicate that exercise programmers working with normal healthy populations can accurately predict Smith Machine 1RM bench press strength using relatively light load Smith Machine BP-T testing, avoiding the need to expose their clients to potentially injurious loads.
Keywords:Strength assessment, Dynamic strength, Predictive models, Bench press throws
Background
The quantification of the maximum load that can be lifted through a full range of motion, or one repetition maximum (1RM), is fundamental to the design of resistance training programs [1]. Typically, 1RM is either measured directly or calculated indirectly using predictive models. The direct determination of 1RM suffers from a number of pragmatic
issues as it is not only time consuming, but the outcome is effected by factors such as athlete experience, technique, fatigue and motivation [2]. Traditional 1RM testing is con-sidered to be safe when it is conducted in appropriate set-tings under the supervision of qualified practitioners [3,4]. Regardless, this 1RM exposes athletes to large musculoskel-etal forces, and there is some evidence that 1RM testing can be potentially injurious [5,6] and may also be impracti-cal with novices and/or in cliniimpracti-cal settings [7].
Indirect methods for 1RM quantification tend to follow two different protocols, both of which rely on the * Correspondence:[email protected]
1School of Health and Sport Sciences, University of the Sunshine Coast,
Maroochydore DC, QLD 4558, Australia
Full list of author information is available at the end of the article
use of linear regression modelling. The most common indirect protocols involve lifting submaximal loads to failure [7–9], a procedure that is relatively common in trained athletes [10] and in agreement with the ACSM guidelines of 8–12 repetition that is often used in a clin-ical setting, but rare in everyday activities. Although relatively easy to administer, the accuracy of these‘lift to failure’ models is also influenced by elements such as age, training experience, motivation and lifting tempo [7–9, 11]. The prediction of 1RM using these methods appears to be more accurate when heavier loads are used [12–14], with the optimal number of repetitions for these prediction models being less than 10 [8]. Accord-ingly, these protocols potentially suffer from the same limitations associated with 1RM testing, with the need to lift high relative loads whilst fatigued. Additionally, these lift to failure protocols are also likely to generate post exercise muscle soreness in novices [15], potentially dissuading them from future exercise participation.
Alternative indirect methods rely on the load-velocity [6,16] or force-velocity [10,11,17–19] relationships and linear or quasi linear models to predict 1RM from a series of maximal effort lifts with submaximal loads. These protocols use either isoinertial sensors or linear position transducers that are attached to the collars or bar of training devices like Smith Machines to record force, average and/or peak vertical lifting velocity data from the concentric phase of movements like jump squats or bench press throws (BP-T). Although these movements are more common in high performance training programs, the use of a Smith Machine and ap-propriately trained “Spotters” means that these exercises can be completed safely with novice participants (NB: some Smith Machines contain a pneumatic brake which
prevents the bar from descending rapidly – hence
im-proving exercise safety). Although 1RM data recorded on Smith Machines are typically 10% higher than those recorded using free weights, there are no significant differences between predicted 1RM values when using these devices [20]. These protocols also have the advan-tage of being relatively quick to perform as they involve loads between 30 and 80% of 1RM [11, 16, 21] being lifted as rapidly as possible for only 2–4 repetitions. Accordingly, the overall loading in these protocols is less than ‘lift to failure’ protocols and so the risk of injury may be decreased, particularly when applied to relatively untrained populations [16].
Arguably, the simplest of the load-velocity models [16] applies standard linear regression equations to load and mean vertical propulsive lifting velocity (Vmean) data from three different loads to develop slope, abscissa (Load0) and ordinate (Vmean0) intercept data. Import-antly, variables such as Vmean or peak vertical velocity (Vpeak) can be measured using relatively inexpensive
technology that, due to large reductions in pricing, is becoming increasing accessible to strength coaches. Re-searchers report high correlations using this methods between Load0 and 1RM bench press (r= 0.98, n= 112,
SEE= 4 kg [7%]), although the strength of this relation-ship is no doubt influenced by the large range in relative loads assessed (30 to 95% of 1RM) [16,22]. Additionally, participants in the study by Jidovtseff and co-workers [16] were required to always hold the bar (i.e. prevented from performing a BP-T), which will have a marked ef-fect on Vmeandue to the deceleration of the bar near the end of the lift [23]. Nevertheless, some questions remain as to whether Vmean or Vpeak provides superior predict-ive measures. Recently, Gracia-Ramos and co-workers
[24] report that Vmean during Smith Machine bench
press is a superior predictor of 1RM when compared to Vpeak. However, these findings appear to be specific to the testing protocols as these researchers highlight in another study that Vpeak during bench press throws is the superior predictor of 1RM [25]. Regardless, Vmean and Vpeakappear to be greater predictors of optimal load for power training than traditional methods that advo-cate percentages of 1RM [26].
Nevertheless, the question remains as to the efficacy of the procedures proposed by Jidovtseff and co-workers [16], particularly when testing novice or inexperienced weight trainers for which higher lifting loads may be contraindicated. Therefore, it is important to determine whether such high relative loads are required during these submaximal test protocols (i.e. up to 95% of 1RM) and which combination of relative loads result in the most accurate predictive model of 1RM bench press strength. Accordingly, the purpose of this study was to use the prediction model developed by Jidovtseff and coworkers [16] to determine which combination of three submaximal loads during BP-T result in the most accur-ate prediction of 1RM Smith Machine bench press strength in healthy individuals. We also examined whether the ability to release the bar during the BP-T changes the nature of the prediction model.
Addition-ally, we examined whether Vmean or Vpeak provides a
better prediction of Smith Machine bench press 1RM strength in these participants.
Methods
Experimental approach to the problem
repetitions of BP-T at loads representing 30, 40, 50, 60 and 70% of their 1RM. We then processed these load-velocity BP-T data using the techniques proposed
by Jidovtseff and coworkers [16] to determine which
three load range (30–50% of 1RM, 40–60% of 1RM,
50–70% of 1RM) resulted in the most accurate
pre-diction of 1RM bench press strength. We also
exam-ined whether BP-T Vmean or Vpeak provides a more
accurate prediction of bench press 1RM by comparing each of the models developed using these variables.
Participants
Participants for this study (n= 12) were all recreational weight trainers who had been weight training at least twice a week for a minimum of 1 year (body mass (BM) = 80.8 ± 5.7 kg, 1RM 84 ± 18 kg, relative 1RM =1.04 BM [i.e. relative load is represented as a function of BM]). None of the participants were involved in heavy load strength training. Participants were informed of the experimental procedures and risks and provided their written informed consent prior to attending several familiarisation sessions. This research was approved by the institutional Human Research Ethics Committee (No. 2012-N-10).
Procedures
All bench press and BP-T data were collected on a standard Smith Machine. This machine was modified with a custom made magnetic braking system as a safety mechanism. Once the bar was released this safety mech-anism prevented it from falling back on the participant
[2]. The bar handle was attached permanently to this braking system, resulting in a total weight of 23 kg. To record the vertical position of the bar a linear position transducer (LPT) (WS17KT, ASM, Moosinning, Germany) was installed on the Smith Machine’s pneumatic brake, with data subsequently sampled at 1000 Hz, A/D con-verted and stored on a computer, Subsequent data analysis of the LPT measurement were performed in MATLAB, with velocity data developed from the raw LPT outputs using the first central difference method.
The BP-T testing was conducted in accordance with well-established protocols [23,28,29] at loads represent-ing 30, 40, 50, 60 and 70% relative to 1RM. The execu-tion order was determined randomly using Microsoft Excel in order to avoid possible order effects during the testing session. In order to minimise the effects of
fatigue there were 2–4 min between repetitions with
three repetitions completed at each load. The eccentric phase was at a self-chosen speed, with the participants required to wait for the start signal before commencing the concentric motion [30]. There was approximately at 2 s pause between the eccentric and concentric phases.
The Vmean, and Vpeak and maximum bar acceleration were calculated from the first and second differentials of the linear transducer data. These data were then used to develop a linear regression model for the prediction of 1RM [16] (Fig. 1). We subsequently developed slope,
Load0 and Vmean0 data for each of these regressions
models over each of the load ranges (i.e. 30–50% 1RM,
40–60% 1RM and 50–70% 1RM).
Fig. 1Sample data from one subject, three loads (solid circles) processed using standard load-velocity techniques [16]. Graph includes the regression line and the calculated peak mean vertical velocity (Vmean0), theoretical load at 0 m/s (Load0) and average vertical lifting velocity
Statistical analyses
The influence of load on the various bar kinematic vari-ables were determined via a series of repeated measures analysis of variance (ANOVA) tests. Post-hoc analyses were undertaken using paired t-Test with Bonferroni corrections. Shapiro-Wilk and Mauchly’s test of sphericity were applied during all ANOVA testing. Where data violated the sphericity assumption Greenhouse-Geisser corrections were applied. The relative magnitude of differences were quantified using standard Cohen’s Effect Size (ES) analyses, with the following descriptors used to define the relative magnitude of the ES: < 0.2 =trivial, 0.2–0.6 =small, 0.6–1.2 = medium/moderate, 1.2–2.0 =
large, and > 2.0 =very large[31]. The predictive accuracy of the model developed by Jidovtseff and coworkers [16] was assessed using the three lightest loads (30–50% 1RM),
the three middle loads (40–60% 1RM) and the three
heaviest loads (50–70% 1RM), with these data then com-pared with the measured 1RM values. Bland-Altman plots were used to assess whether there were any levels of bias in any of the models, with simple t-tests used to assess for differences between the actual and predicted values. The coefficient of variance (CV%) and the intra class correla-tions (ICC, 3,1) for the predicted versus the measured 1RM were also calculated. Statistical analysis were per-formed using the statistics package SPSS for Windows (version 20), with a confidence level of 95%. All data are presented at means ±1 standard deviation (SD) unless stated otherwise.
Results
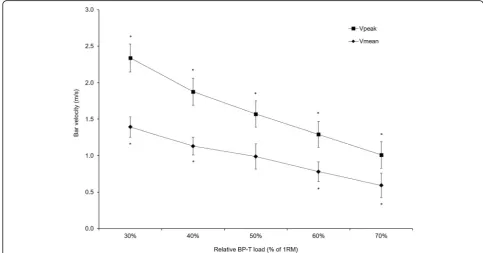
ANOVA testing indicated that Vmean and Vpeak both
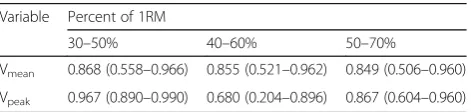
showed large, significant reductions (P< 0.001, ES> 1.2) for each respective increase in relative BP-T load, except for Vmean between 40 and 50% of 1RM (Fig. 2). Results also showed that the mean values for slope and Vmean0 at each of the load ranges differed significantly depend-ing on whether Vmean or Vpeakwere used in the predic-tion models (Table 1). Conversely, Load0 data did not differ significantly between either bar velocity measures at each load range. The CV% values range from 7.2 up to 27.5% (Table 2), with the ICC (Table 3) data show excellent reliability for Vpeak at the lightest range weight whereas only moderate reliability was observed for the weights between 40 and 60%. All other cases showed good reliability. Typically, greater levels of acceptable re-liability [32] were recorded for Vpeakcompared to Vmean.
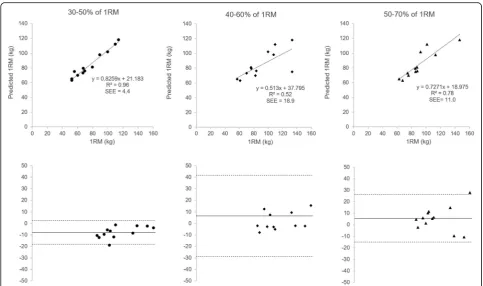
There were no noticeable differences in any of the
models that used Vmeanto predict 1RM Smith Machine
bench press strength (R2 between 0.85–0.89). Similarly, there were no significant differences between predicted
and actual 1RM Smith Machine (P= 0.21 to 0.95) when
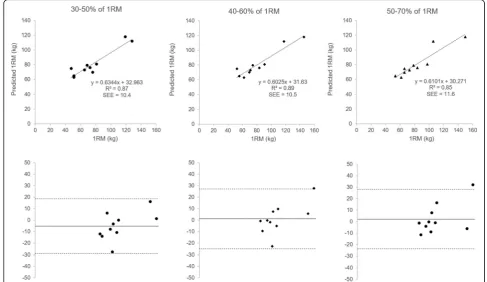
using Vmean, although the corresponding Bland-Altman plots highlighting some issues with the accuracy of these data (Fig. 3). Conversely, there were significant differ-ences between the predicted and actual 1RM Smith
Machine bench press values when using Vpeak at the
lightest of the load ranges to (P< 0.001). However, the predicted 1RM values for Vpeak for these light relative
Fig. 2Mean (1SD) mean (Vmean) and peak bar (Vpeak) vertical velocities at each of the relative loads. * Indicates data significantly different
loads (30, 40 and 50% of 1RM) resulted in the most accurate prediction of 1RM bench press strength (Fig.4), although there was a constant fixed bias towards under estimating 1RM by approximately 9 kg.
Discussion
This study used the well-established linear-regression techniques proposed by Jidovtseff and coworkers [16] to examined which combination of three relative submaxi-mal loads during BP-T testing results in the best predic-tion of 1RM Smith Machine bench press strength. We also examined whether regression models developed using Vpeak, rather than the variable suggested by these researchers (Vmean), provide the best prediction of bench press 1RM. Finally, we examined whether performing a BP-T (instead of an explosive bench press) influences the nature of the regression model when using either of these bar velocity measures.
This study builds upon the findings of Gracia-Ramos and co-workers [24, 25], highlighting that 1RM bench press strength on a Smith Machine can be determined with acceptable levels of precision by examining Vmean
and Vpeak during Smith Machine BP-T over three
sub-maximal loads. Perhaps even more importantly, our data suggests that the best and most reliable prediction model was based on relative loads representing just 30, 40 and 50% of 1RM. Importantly, as the prediction is
robust for the light relative loads, a rough estimate of the 1RM appears to be sufficient for this method. Although a fixed bias exists to under predict 1RM by approximately 9 kg with using these loads, the accuracy of the model to predict Smith Machine bench press
1RM when using Vpeakduring BP-T is quite high.
Add-itionally, the high precision of this regression model is at least comparable to other established prediction proce-dures that use more time-consuming protocols and/or also possibly have a greater potential for injury or soreness [5,7–9,12–15]. From a practical perspective, our findings suggest that there is no need to test over heavy relative and absolute loads [5,6] when using the force-load tech-nique to estimate Smith Machine 1RM in recreational and novice level weight trainers [5,7,8,12,14].
The finding that bar velocity data decreases with increasing relative load is not unique and simply con-firms the standard exponential force velocity profile first developed by Hill [33] nearly 80 years ago. Our
data for Vmean does however contain an anomaly at
50% of 1RM (Fig.2), suggesting that the Vmeanmay be too gross a measure to be able to detect known changes in performance that occur across our load ranges. Similarly, our results also suggest that Vpeak is
a more effective measure than Vmean when using this
technique to predict 1RM in regular (but non-athletic) weight trainers with a mean 1RM Smith Machine bench press approximately equivalent to 1 body weight. While these findings are agreement with earl-ier research [20,25] other studies favour Vmean[24,26], highlighting that the specific loading regime influences this outcome.
Table 1Mean (±1SD) values of the slope, abscissa (Load0) and ordinate (Vmean0) intercept data for each regression line developed using both Vmeanand Vpeakacross the three loading ranges
Variable Percent of 1RM
30–50% 40–60% 50–70%
Slope using Vmean −2.02 (0.52)
a
−1.76 (0.31)a −1.97 (0.46)a
Slope using Vpeak −3.85 (0.42) −2.93 (0.71) −2.81 (0.63)
Load0 using Vmean(% of 1RM) 91.9% (15.3) 99.6% (14.9) 103.1% (14.0)
Load0 using Vpeak(% of 1RM) 89.6% (7.7)
b
107.8% (23.8) 106.6% (10.2)
Vmean0 using Vmean(m/s) 1.98 (0.22)
a
1.84 (0.15)a 1.97 (0.31)a
Vmean0 using Vpeak(m/s) 3.47 (0.25) 3.05 (0.41)
a
2.97 (0.41)a
a
Indicates values differs significantly (P< 0.01) from Vpeakat that load range b
Indicates values differ significantly from the actual 1RM at that load range
Table 2CV% values of the slope, abscissa (Load0) and ordinate (Vmean0) intercept data for each the regression lines developed using both Vmeanand Vpeakacross the three loading ranges
Variable Percent of 1RM
30–50% 40–60% 50–70%
Slope using Vmean 25.7 17.6 23.4
Slope using Vpeak 10.9 24.2 22.4
Load0 using Vmean(% of 1RM) 16.6 15.0 13.6
Load0 using Vpeak(% of 1RM) 8.6 22.1 9.6
Vmean0 using Vmean(m/s) 11.1 8.2 15.7
Vmean0 using Vpeak(m/s) 7.2 13.4 13.8
Table 3ICC measured versus predicted 1RM
Variable Percent of 1RM
30–50% 40–60% 50–70%
Vmean 0.868 (0.558–0.966) 0.855 (0.521–0.962) 0.849 (0.506–0.960)
Our Vpeak data are similar to data from physically ac-tive collegiate men performing a similar BP-T task [21], with values between studies differing by less than 0.07 m/s at similar loads. Conversely the slope and
Vmean0 data from our models using Vmean to predict
1RM differ considerably from values from the original research using this method [16]. No doubt this is a func-tion of the protocols adopted by these researchers that prevented the participants from releasing the bar (hence performing a dynamic bench press and not a BP-T per se). The use of this approach by these researchers is
somewhat surprising as their Vmean data would have
been effected by a pronounced bar deceleration near the end of the movement [23] and so the accuracy of these data could be optimised. Importantly, Vpeakduring BP-T testing is not only reliable (CV% values between 1.7 and 3.3), but also presents with smaller CV% values than for dynamic bench press movements [21, 25]. From a prac-tical stand point Vpeak is relatively simple to quantify, as it can be measured using inexpensive devices (e.g. op-tical encoders or linear position transducers), or esti-mated using bar throw height. These approaches can be adopted easily in health clubs or commercial gymna-siums and provide acceptable predictions of 1RM that can be used in the development of more effective train-ing programs.
We acknowledge that our testing was based on a relatively small sample of a diverse but specific population of beginning weight training adults, how-ever these samples sizes are relatively common in this domain. Additionally, our sample characteristics are typical for many healthy individuals who attend health clubs and/or commercial strength training facilities. We also acknowledge that it the accuracy of regression models that attempt to predict values outside of the range of the collected data is severely compromised. However, this process is fundamental to all research in this domain and so largely un-avoidable. Importantly, we have not suggested that the protocols presented in this project offer an exact
estimate of a participant’s Smith Machine 1RM
bench press.
Conclusions
Our results suggest that within this target population reliable estimates of Smith Machine 1RM bench press strength can be achieved using the load-velocity ap-proach with BP-T loads between 30 and 50% of 1RM. We do however acknowledge that the reliability and accuracy of the velocity based method presented here can suffer from fatigue or lack of motivation of the athletes. However, issues such as these are systemic in
Fig. 3The top row represents the three models to predict 1RM Smith Machine bench press based on mean vertical lifting velocity (Vmean). The
nearly all strength assessment protocols and can be managed with appropriate testing regimens. We also acknowledge that these data are specific to Smith Machine bench press and BP-T, and may not be transferable to conventional free weight testing. Fu-ture research should attempt to confirm these results with a larger sample of participants and conduct ap-propriate between session reliability assessments. Add-itionally, it would also be appropriate prospectively compare the incidence of soreness and injury between the methods proposed in this study and traditional 1RM determination.
Practical applications
Conventional 1RM bench press strength testing ex-poses people to very high relative loads. Our findings indicate that in normal healthy populations bar velocity data recorded during relatively light load Smith Ma-chine BP-T testing can be used to accurately predict 1RM Smith Machine bench press strength. The large range in the submaximal load range allows practitioners to estimate the 1RM as start point by using a team average, last season values or a weight dependent 1RM to define the submaximal test weights. Additionally, it
is simple to determine Vmean and Vpeak during BP-T
testing and the linear regression models are easy to
apply. Importantly, our results show that the most ac-curate and reliable models are created from BP-T Vpeak data (not Vmean), a variable that developed with min-imal post-testing processing, from loads representing just 30, 40 and 50% of 1RM. Using the approach de-scribed in our study exercise programmers can predict 1RM Smith Machine bench press strength and monitor performance enhancement with acceptable accuracy without the need to expose their clients to extremely heavy loads, or lift to fatigue protocols.
Abbreviations
1RM:One repetition maximum; BM: Body mass; BP-T: Bench press throw; CV%: Coefficient of variance; ICC, 3,1: Intra class correlations; Load0: The abscissa from the linear regression equation derived from load and mean vertical propulsive lifting velocity; LPT: Linear position transducer; Slope: The gradient of the linear regression equation derived from load and mean vertical propulsive lifting velocity; Vmean: Mean vertical propulsive velocity;
Vmean0: The ordinate from the linear regression equation derived from load
and mean vertical propulsive lifting velocity; Vpeak: Peak vertical lifting
velocity
Funding
This project received no external funding.
Availability of data and materials
The datasets used and/or analysed during the current study are available from the corresponding author on reasonable request.
Fig. 4The top row represents the three models to predict 1RM Smith Machine bench press based on peak vertical lifting velocity (Vpeak). The left
Authors’contributions
MGLS was a major contributor in data analysis and writing the manuscript. MS collected and process the data and assisted with data analysis. MH assisted with data processing and analysis. SL was a major contributor in data analysis and writing the manuscript. All authors read and approved the final manuscript.
Ethics approval and consent to participate
This research was approved by the ETH Human Research Ethics Committee (No. 2012-N-10). Participants were informed of the experimental procedures and risks and provided their written informed consent prior to attending several familiarisation sessions.
Competing interests
The authors declare that they have no competing interests.
Publisher’s Note
Springer Nature remains neutral with regard to jurisdictional claims in published maps and institutional affiliations.
Author details
1School of Health and Sport Sciences, University of the Sunshine Coast,
Maroochydore DC, QLD 4558, Australia.2Institute for Biomechanics, ETH
Zürich, Zürich, Switzerland.3Swiss Federal Institute of Sport, Magglingen, Switzerland.
Received: 19 May 2017 Accepted: 11 May 2018
References
1. Fleck SJ, Kraemer W. Designing resistance training programs. 4th ed. Champaign, IL: Human Kinetics; 2014.
2. McMaster DT, Gill N, Cronin J, McGuigan M. A brief review of strength and ballistic assessment methodologies in sport. Sports Med. 2014;44(5):603–23. 3. Levinger I, Goodman C, Hare DL, Jerums G, Toia D, Selig S. The reliability of
the 1RM strength test for untrained middle-aged individuals. J Sci Med Sport. 2009;12(2):310–6.
4. Kaelin ME, Swank AM, Adams KJ, Barnard KL, Berning JM, Green A. Cardiopulmonary responses, muscle soreness, and injury during the one repetition maximum assessment in pulmonary rehabilitation patients. J Cardiopulm Rehabil Prev. 1999;19(6):366–72.
5. Niewiadomski W, Laskowska D, Gasiorowska A, Cybulski G, Strasz A, Langfort J. Determination and prediction of one repetition maximum (1RM): safety considerations. J Hum Kinet. 2008;19:109–19.
6. Rontu JP, Hannula MI, Leskinen S, Linnamo V, Salmi JA. One-repetition maximum bench press performance estimated with a new accelerometer method. J Strength Cond Res. 2010;24(8):2018–25.
7. Reynolds JM, Gordon TJ, Robergs RA. Prediction of one repetition maximum strength from multiple repetition maximum testing and anthropometry. J Strength Cond Res. 2006;20(3):584–92.
8. Mayhew JL, Johnson BD, LaMonte MJ, Lauber D, Kemmler W. Accuracy of prediction equations for determining one repetition maximum bench press in women before and after resistance training. J Strength Cond Res. 2008; 22(5):1570–7.
9. Kim PS, Mayhew JL, Peterson DF. A modified YMCA bench press test as a predictor of 1 repetition maximum bench press strength. J Strength Cond Res. 2002;16(3):440–5.
10. Bazuelo-Ruiz B, Padial P, Garcia-Ramos A, Morales-Artacho AJ, Miranda MT, Feriche B. Predicting maximal dynamic strength from the load-velocity relationship in squat exercise. J Strength Cond Res. 2015;29(7):1999–2005. 11. Picerno P, Iannetta D, Comotto S, Donati M, Pecoraro F, Zok M, Tollis G,
Figura M, Varalda C, Di Muzio D, et al. 1RM prediction: a novel methodology based on the force-velocity and load-velocity relationships. Eur J Appl Physiol Occup Physiol. 2016;116(10):2035–43.
12. Mayhew JL, Ware JS, Cannon K, Corbett S, Chapman PP, Bemben MG, Ward TE, Farris B, Juraszek J, Slovak JP. Validation of the NFL-225 test for predicting 1-RM bench press performance in college football players. J Sports Med Phys Fitness. 2002;42(3):304–8.
13. Mayhew JL, Prinster JL, Ware JS, Zimmer DL, Arabas JR, Bemben MG. Muscular endurance repetitions to predict bench press strength in men of different training levels. J Sport Med Phys Fitness. 1995;35(2):108–13.
14. Whisenant MJ, Panton LB, East WB, Broeder CE. Validation of submaximal prediction equations for the 1 repetition maximum bench press test on a group of collegiate football players. J Strength Cond Res. 2003;17(2):221–7. 15. Clarkson PM, Hubal MJ. Exercise-induced muscle damage in humans. Am J
Phys Med Rehabil. 2002;81(11 Suppl):S52–69.
16. Jidovtseff B, Harris NK, Crielaard JM, Cronin JB. Using the load-velocity relationship for 1RM prediction. J Strength Cond Res. 2011;25(1):267–70. 17. Sugiura Y, Hatanaka Y, Arai T, Sakurai H, Kanada Y. Estimations of one
repetition maximum and isometric peak torque in knee extension based on the relationship between force and velocity. J Strength Cond Res. 2016; 30(4):980–8.
18. Meylan CM, Cronin JB, Oliver JL, Hughes MM, Jidovtseff B, Pinder S. The reliability of isoinertial force-velocity-power profiling and maximal strength assessment in youth. Sports Biomech. 2015;14(1):68–80.
19. Jandacka D, Uchytil J. Optimal load maximizes the mean mechanical power output during upper extremity exercise in highly trained soccer players. J Strength Cond Res. 2011;25(10):2764–72.
20. Loturco I, Kobal R, Moraes JE, Kitamura K, Abad CC, Pereira LA, Nakamura FY. Predicting the maximum dynamic strength in bench press: the high precision of the bar velocity approach. J Strength Cond Res. 2017;31(4): 1127–31.
21. Garcia-Ramos A, Padial P, Garcia-Ramos M, Conde-Pipo J, Arguelles-Cienfuegos J, Stirn I, Feriche B. Reliability analysis of traditional and ballistic bench press exercises at different loads. J Hum Kinet. 2015;47:51–9. 22. Banyard HG, Nosaka K, Haff GG. Reliability and validity of the load-velocity
relationship to predict the 1RM back squat. J Strength Cond Res. 2017;31(7): 1897–904.
23. Newton RU, Kraemer WJ, Hakkinen K, Humphries B, Murphy AJ. Kinematics, kinetics, and muscle activation during explosive upper body movements. J Appl Biomech. 1996;12(1):31–43.
24. Garcia-Ramos A, Pestana-Melero FL, Perez-Castilla A, Rojas FJ, Haff GG. Mean velocity vs. mean propulsive velocity vs. peak velocity: which variable determines bench press relative load with higher reliability? J Strength Cond Res. 2018;32(5):1273–9.
25. Garcia-Ramos A, Haff GG, Padial P, Feriche B. Reliability of power and velocity variables collected during the traditional and ballistic bench press exercise. Sports Biomech. 2018;17(1):117–30.
26. Loturco I, Pereira LA, Cal Abad CC, Tabares F, Moraes JE, Kobal R, Kitamura K, Nakamura FY. Bar velocities capable of optimising the muscle power in strength-power exercises. J Sports Sci. 2017;35(8):734–41.
27. Kraemer WJ, Ratamess NA, Fry AC, French DN. Strength testing: development and evaluation of methodology. In: Maud PJ, Foster CF, editors. Physiological Assessment of Human Fitness. 2nd ed. Champaign, IL: Human Kinetics; 2006. p. 119–50.
28. Argus CK, Gill ND, Keogh JWL, Hopkins WG. Assessing the variation in the load that produces maximal upper-body power. J Strength Cond Res. 2014; 28(1):240–4.
29. Argus CK, Gill ND, Keogh JWL, Hopkins WG, Beaven CM. Changes in strength, power, and steroid hormones during a professional rugby union competition. J Strength Cond Res. 2009;23(5):1583–92.
30. Pallarés JG, Sánchez-Medina L, Pérez CE, De La Cruz-Sánchez E, Mora-Rodriguez R. Imposing a pause between the eccentric and concentric phases increases the reliability of isoinertial strength assessments. J Sports Sci. 2014;32(12):1165–75.
31. Hopkins WG, Marshall SW, Batterham AM, Hanin J. Progressive statistics for studies in sports medicine and exercise science. Med Sci Sports Exerc. 2009; 41(1):3–13.
32. Haff GG, Ruben RP, Lider J, Twine C, Cormie P. A comparison of methods for determining the rate of force development during isometric midthigh clean pulls. J Strength Cond Res. 2015;29(2):386–95.
![Fig. 1 Sample data from one subject, three loads (solid circles) processed using standard load-velocity techniques [regression line and the calculated peak mean vertical velocity (V16]](https://thumb-us.123doks.com/thumbv2/123dok_us/511776.1545679/3.595.59.539.465.694/processed-standard-velocity-techniques-regression-calculated-vertical-velocity.webp)