Improving Order Lead Time:
A Case Study
Bernardo Villarreal, Universidad de Monterrey, Mexico Lucy Salido, Universidad de Monterrey, Mexico
ABSTRACT
A fundamental challenge of globally competing companies is to increase their level of customer satisfaction, by devising and implementing strategies aimed at providing better price, quality, and service. This paper describes the efforts of a Mexican company to achieve this goal, and in particular, with the need to decrease order lead time significantly to maintain its position as a supplier.
Keywords: Order lead time improvement; Postponement; Differentiation point; Decoupling point.
1. INTRODUCTION
fundamental challenge that companies are facing today to become global competitors is that of devising and implementing strategies aimed at satisfying customers who require better levels in price/cost, quality, product design, delivery speed and reliability and on-time delivery. Competing in all these dimensions simultaneously is not possible, it is required a sense of direction and focus for a company to derive a competitive advantage. The definition of the important mix of competitive factors comes from an analysis of market needs and expectations.
The market has become more volatile and dynamic, and requires higher levels of competitive factors. Firms have to be more agile to compete successfully under these conditions (Nagel, et al., 1991).This paper describes the efforts of a Mexican company that faces competitive pressures similar to the ones just described, and in particular, with the need to decrease order lead time significantly to maintain its position as a supplier.
The project was presented by CUPRUM Escaleras, a company of the Verzatec Group located in Monterrey, N.L., México that manufactures aluminum ladders for the Mexican and USA markets, to the Programa de Evaluación Final (PEF) for its development and solution. This is a program designed for senior undergraduate students at the Universidad de Monterrey, and constitutes the final requisite for graduation, (Sillero, et al, 2006 and Arjona-Báez, et al., 2006). Each project under this program is assigned to a maximum of three students, who are advised by a team of three professors, and a mentor assigned by the company.
The duration of the project is of four months, and it follows a pre-defined schedule of advance and goal monitoring sessions. At the end, an examination based upon the results of the project and the technical merits and methodology applied is undertaken. There is also a final presentation given at the company of interest, which also participates in the evaluation process. The program, which is a combined problem and project solving teaching tool, has proved to be invaluable to develop in our students strong capabilities to perform under pressure in a practical setting. They valued it as a great experience and as a required component of their undergraduate program. For the professors that serve as advisors, the program has become a source for new research ideas and a field to apply theory.
2. REVIEW OF RELEVANT LITERATURE
The management of lead time can be a competitive advantage (Tersine, et al.,1995). Time based competition refers to the ability to deliver products or services faster than the competitors. Lead time reduction strategies are responses to logistical problems in the areas of procurement, manufacturing and distribution. In particular, an assessment of lead times in distribution systems offers numerous opportunities for improvement (Villarreal, et al., 2004 and Martner, 2008). Traditionally, product flows are managed by different organizational units that work independently and are poorly coordinated. Information about timing and quantity of product flows is managed by transactional systems that are not integrated, originating reactive behaviour and a lack of consolidation opportunities.
The idea that time compression (i.e. the collapsing of all cycle times within a supply chain) would enhance business competitiveness to the advantage of all members in the chain has been around for some time. However, the gap between theory and practice has taken several decades to narrow sufficiently so as to make a major impact on industrial performance. What is now clear is that time compression is a performance driver which initially enhances the competitiveness of individual work processes and then of complete industrial businesses. Particularly when coupled with open information flow, time compression can multiply to have an even greater effect on supply chain competitiveness. Today, it is no longer sufficient to be a competent business in isolation: it is also necessary to be associated with world-class supply chains if we are to survive, let alone win.
So we conclude that the supply chain process is greatly improved by concentrating on the streamlining of material, information and cash flow, simplifying decision-making procedures and eliminating as many non - value added operations/delays as possible. A survey of the literature devoted to real world case studies coupled with our own industrial experience given by Towill, et al., (1996) suggests that key drivers resulting from time compression include:
• Improved demand forecasting • Quicker defect detection • Quicker to market
• Shifting decoupling point towards the customer
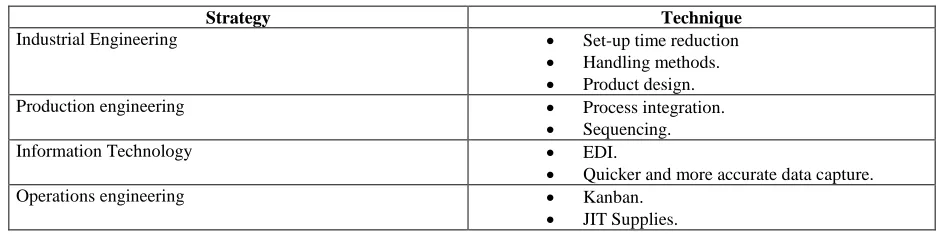
At the tactical level, time compression can be achieved via industrial engineering, production engineering, information technology and operation engineering routes, as shown in Table No. 1 (Towill, et al., 1996).This is a sample of tools which many companies are currently employing as part of their business process improvement programmes.
Table No. 1. Practical ways to achieve time compression Strategy Technique
Industrial Engineering Set-up time reduction
Handling methods. Product design.
Production engineering Process integration.
Sequencing.
Information Technology EDI.
Quicker and more accurate data capture.
Operations engineering Kanban.
JIT Supplies.
competitive factor is customer service. The concept of agility is related to the capacity of responding to market needs and changes. The concept of decoupling point (DP) defined by Hoekstra, et al. (1992) is relevant for the previous strategy making process. This point corresponds to the farthest upstream position in the supply chain where the customer order is satisfied. This point is used to structure a leagile (lean and agile) strategy for the supply chain. After identifying the DP position, a lean strategy is recommended for the part of the chain located upstream this point. Similarly, an agile strategy is suggested for the part located downstream the point. The DP position associated with the concept of postponement is key for obtaining agility. This aspect enables the chain to decrease the risk of stockout having the level enough to satisfy the market. Postponement considers the organization of product manufacturing and distribution in a manner that market needs are met in a time as close as possible to the moment of demand realization (Garg, et al., 2000).
3. DESCRIPTION OF METHODOLOGY
The methodology utilized for attacking the problem of improving the performance of the distribution system is a general scheme that considers the supply chain as a whole. This consists of five stages (see Figure No. 1). The first stage has the goal of tying relevant aspects of the marketing strategy of the firm to the improvement problem. Here, the main aspects to identify are those concerning with the product mix and expected market growth, and the relevant competitive factors and their required levels (Hill, 2000). This information is of importance because the supply chain characteristics depend upon the specific factors that must be met to compete (Fisher, 1997). In this phase it is also recommended the identification of several market characteristics that will determine the structure of the chain. The size, location and density of the market are fundamental inputs in the determination of the chain structure, the distribution scheme, and the inventory deployment strategy. These inputs are required for each market segment-competitive factor pair identified. The size and frequency of the orders are then needed to fine tune the transportation and inventory parameters.
Figure No. 1: Proposed Methodology for Supply Chain Improvement
The second stage of the methodology corresponds to the analysis of the current situation of the chain. The purpose here is to setup the basis and reference for the development of the improvement strategy. The chain is mapped to describe its structure, inventory deployment scheme, and its transportation and sourcing strategies. Waste
Analysis of Current System Improvement Strategy Definition Strategy Implementation
- Alineation with Marketing strategy.
- Delineate and evaluate improvement strategy.
- Implement and startup of strategy.
- Define product mix and growth levels.
-Determine relevant competitive factors and levels.
-Define demand behaviour. -Identify location of demand centers. -Determine match of competitive factors with demand segments. -Identify size and frequency of orders.
- Definition of waste reduction strategy.
-Conceptual improvement scenarios.
-Evaluation and selection of scenarios.
-Detailed design of projects for chosen scenario.
- Implement strategy as designed.
-Monitor performance in startup and modify as required.
Consider Marketing Strategy
- Identify areas for performance improvement.
-Identify current performance of competitive factors.
-Describe and map supply Chain: -Structure of Chain. -Distribution scheme. -Inventory deployment strategy.
-Sourcing analysis. -Decoupling and differentiation points.
is identified using the value stream map and the lean mapping toolkit, (Hines, et al., 1997), as well as other tools considered necessary. The determination of the decoupling point is also of particular importance to develop the detailed improvement strategy. The third phase has the objective of developing alternatives for improvement. These should include projects oriented to obtain better levels of the competitive factors of interest. The strategies could include several projects from those suggested by Christopher, et al., (2001) and Towill, et al., (1996).The structure of the proposed set of strategies should be defined around the decoupling point. All must be evaluated economically and passed to the selection phase.
The final stage is concerned with the implementation of the selected strategy. A detailed program with responsible and specific points of control should be laid out. Important consideration is the administrative infrastructure and support required to enable each project.
4. APPLICATION OF METHODOLOGY
As previously stated, the project covered in this document was carried out in CUPRUM Escaleras, a company of the Verzatec Group located in Monterrey, N.L., México that manufactures aluminum ladders for the Mexican and USA markets. The firm has a subsidiary; Louisville Ladder, Inc. (LLI), that is responsible for satisfying the American market. The project will treat only this part of the operations of the company.
4.1 Alineation with marketing strategy
LLI faces a competitive challenge in the USA market originated by Chinese suppliers. Its main customer is The Home Depot (THD), with 60% of total sales through 2200 sales points located throughout USA. Currently, THD gets its supply of ladders by LLI and Chinese competitors. LLI´s current location is considered to be a competitive advantage because THD values low cost and a fast response as winner factors. The company´s total annual demand from THD is grouped in six zones illustrated in Figure No. 2.
Figure No. 2: Illustration of THD demand zones
4.2 Description of current distribution scheme
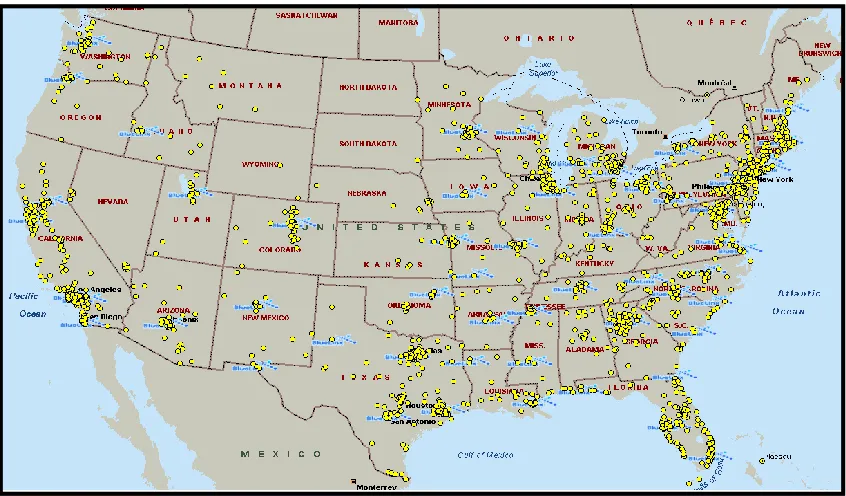
The current distribution scheme is heavily dependent upon the distribution infrastructure of 63 distribution centers of BlueLinx, a 3PL subcontacted for this purpose.
CUPRUM escaleras produces to store at the plant at Monterrey. Thus, the current DP is positioned at Monterrey. All orders are satisfied from this warehouse and transported to Laredo utilizing a Mexican supplier. Since each order contains products with different physical characteristics, its palletizing is not efficient, originating space waste. In Laredo, the merchandise crosses the border with a transfer. After satisfying all duty requisites, it is then transported by BlueLynx to the distribution center that is closest to the THD that demands it. Figure No. 3 illustrates the location of the 63 distribution centres. It should be noticed that the orders go through several stopovers before reaching the distribution center. BlueLynx employs about 20 transport companies to carry out the service. Each transportation company seeks to consolidate shipments impacting negatively on LLI´s order lead times.
Once the orders reach the distribution centre, they must wait until BlueLyinx consolidates the shipment with other products ordered by THD. This again has a negative effect on the orders´ lead time.
4.3 Lead Time Analysis
The promised average lead time offered by LLI is 19 days, from the order acceptance to its reception. Its main competitor, Tricam fabricates ladders in China at a lower cost. However, its lead time is higher originating a higher cost of capital by THD.
The current annual average lead time by LLI is 21 days, two days higher from the guaranteed date. However, this varies according to the zone where the orders are sent and the time of the year when these are carried out. In particular, lead time increases 5 additional days during the May – June period. For the reason described above, THD is holding high levels of inventory and is also looking for a significant reduction in lead time without an increase in price.
4.4 Design of improvement strategy
The improvement strategy is structured around the following concepts:
Decrease lead time to insure THD orders.
Decrease distribution cost by maximizing transportation capacity (weight and space).
The elements assessed to be a part of the strategy were:
Moving the decoupling point downstream towards the customer.
Deploying inventory to support it.
Increasing the volume transported from Laredo to the distribution centres.
When considering the re-location of the decoupling point , the current 3PL, the firm´s own distribution centre network, and other 3PL´s were evaluated and considered. Since the company´s network is utilized at capacity to satisfy the rest of the customers, this option was discarded. The best option was the one with a different 3PL, MAT (Midwest Air Technologies). With the participation of MAT, the inventory held at the plant´s warehouse is moved to its distribution centres Thus, ladders would be palletized more efficiently requiring fewer shipments. THD´s orders were fulfilled from these centres, decreasing lead time.
4.4.1 Distribution scheme modification
As mentioned previously, the new distribution scheme was structured around MAT´s distribution network described in Figure No. 4. This network consists of eight distribution centres located in USA; Bolingbrook, IL, Edison, NJ, Fullerton, CA, Savannah, GA, Carrollton, TX, Lakewood, WA, Jackson, TN, and Atlanta, GA.
The maximum lead time guaranteed from any of these centres to THD stores was ten days.
4.4.2 Impact on total distribution cost
This section is concerned with the impact of the new distribution strategy on total distribution costs. Total cost is divided into distribution cost from Monterrey to MAT´s distribution centres, finished goods inventory cost, and distribution cost from MAT´s centres to THD stores.
Distribution cost from Monterrey to MAT
This concept contains the cost of transportation from the Monterrey plant to the border, the transfer and duty expenses, and the transportation freight to MAT´s centres.
Total distribution cost for this concept is reduced by 1.5 million dollars due to less number of shipments originated by better truck capacity utilization. In this case, there is a more efficient palletizing of products since they are not assembled according to THD orders, but by similar type of products sent to MAT`s centres. In addition, the volume per shipment is higher since the product is sent to fewer locations. An additional analysis was carried out in which the change of truck transportation to intermodal was considered for shipments from Laredo to MAT`s centres. In this study, several service providers were included; C.H. Robinson Worldwide, Inc., EXEL, Schneider National, and Alliance Cipres, Inc. After receiving the quotes from each of them, there were only three routes where one could have savings; to Edison, NJ with Schneider National, to Fullerton, CA with EXEL, and to Lakewood, Washington with Alliance. The savings achieved were of the order of 493 thousand dollars per year.
Finished goods inventory analysis
The modification of the distribution strategy implies the descentralization of the inventory located at the plant of Monterrey assigned to satisfy THD demand. This would be now located at the eight distribution centres according to the demand size served by each. This change has a negative impact on inventory investment and the cost of maintaining it. There is a 57% increase on investment impacting on an additional annual cost of keeping inventory of the order of 257 thousand dollars.
Distribution cost from MAT to THD
The cost of distribution from the distribution centres to each THD store increased significantly, about 85%, with the change. This is because the new cost includes the concepts of picking and palletising orders from THD, keeping inventory and routing.
Comparison of total distribution costs
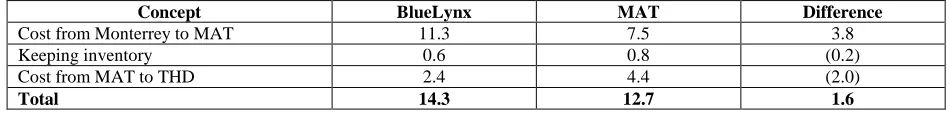
The resulting evaluation between both strategies is summarized in Table No. 2. The increase in inventory and freight from the distribution centres to THD is more than upset by the reduction in cost for the distribution of goods from Monterrey to MAT. The new scheme would be 1.6 million dollars per year cheaper.
Table No. 2. Cost comparison of strategies (millions of dollars per year)
Concept BlueLynx MAT Difference
Cost from Monterrey to MAT 11.3 7.5 3.8
Keeping inventory 0.6 0.8 (0.2)
Cost from MAT to THD 2.4 4.4 (2.0)
Total 14.3 12.7 1.6
5. CONCLUSIONS
evidence that, at least Mexican firms, are at the infant stages of applying operational and strategic improvement strategies. Operationally, there seems to be a lot of room to apply waste elimination methodologies, and strategically, with the exception of very few, none are aware of the potential benefits that can be achieved.
In this particular case study, the goals delineated by the company, faster response to its customers and at lower logistical cost, are achieved. The new distribution scheme incorporates several concepts; moving the decoupling point towards the customer, deployment of inventories to various warehouses from a central location, improving the utilization of space per shipment, and changing selectively of mode of transportation.
Finally, it should be noticed that the project provided a great support in the development of several competences to the group of students that participated (Salido, et al. 2008).
REFERENCES
1. Arjona-Báez, J. & Galvan, J.A., The Final Evaluation Project: The Best Learning Experience, Proceedings of the SEFI Annual Conference, Sweden, 2006.
2. Christopher, M. and Towill, D., An Integrated Model for the Design of Agile Supply Chains, International Journal of Physical Distribution & Logistics Management, Vol. 31, No. 4, 2001.
3. Fisher, M., What is the Right Supply Chain for your Product?, Harvard Business Review, March-April, 1997.
4. Garg, A. and Lee, H., Managing Product Variety: An Operations Perspective, Quantitative Models for Supply Chain Management, Tayur, S., Ganeshan, R. and Magazine, M., Kluwer’s International Series, 2000.
5. Hill, T., Manufacturing Strategy, Irwin McGraw Hill, 3rd edition, 2000.
6. Hines, P. & Taylor, D., Going Lean, Lean Enterprise Research Centre, Cardiff Business School, 2000. 7. Hines, P. and Rich, N., The Seven Value Stream Mapping Tools, International Journal of Operations and
Production Management, Vol. 17, No. 1, 1997.
8. Hoekstra, S. and Romme, J., Integral Logistic Structures, McGraw Hill, 1992.
9. Martner-Peyrelongue, C., Transporte Multimodal y Globalización en México, 1ª edición, Trillas, 2008. 10. Masson-Jones, R., Naylor, B. & Towill, D., Engineering the Leagile Supply Chain, International Journal of
Agile Management Systems,2/1, 2000.
11. Nagel, R. & Dove, R., 21st Century Manufacturing Enterprise Strategy, Lehigh University, Iacocca Institute, 1991.
12. Salido, L. and Arreola, A., Distribución óptima de Escaleras a los Estados Unidos, Proyecto de Evaluación Final, Universidad de Monterrey, 2008.
13. Sillero-Pérez, J., Vargas-Treviño, I. & Balmori-Méndez, E.E.R., The Problem Solving Competente in the New Industrial Engineering Curricula at the Universidad de Monterrey, Proceedings of the IIE Annual Conference, Orlando, Fla., 2006.
14. Tersine, R.J., & Hummingbird, E.A., Lead Time Reduction: The Search for Competitive Advantage, International Journal of Operations & Production Management, Vol. 15, No. 2, 1995.
15. Towill, D.R., Time compression and supply chain management – a guided tour, Logistics Information Management, Vol. 9, No. 5, 1996.