Nat. Hazards Earth Syst. Sci., 13, 1643–1653, 2013 www.nat-hazards-earth-syst-sci.net/13/1643/2013/ doi:10.5194/nhess-13-1643-2013
© Author(s) 2013. CC Attribution 3.0 License.
EGU Journal Logos (RGB)
Advances in
Geosciences
Open Access
Natural Hazards
and Earth System
Sciences
Open AccessAnnales
Geophysicae
Open AccessNonlinear Processes
in Geophysics
Open AccessAtmospheric
Chemistry
and Physics
Open AccessAtmospheric
Chemistry
and Physics
Open Access DiscussionsAtmospheric
Measurement
Techniques
Open AccessAtmospheric
Measurement
Techniques
Open Access DiscussionsBiogeosciences
Open Access Open Access
Biogeosciences
Discussions
Climate
of the Past
Open Access Open Access
Climate
of the Past
Discussions
Earth System
Dynamics
Open Access Open Access
Earth System
Dynamics
DiscussionsGeoscientific
Instrumentation
Methods and
Data Systems
Open Access
Geoscientific
Instrumentation
Methods and
Data Systems
Open Access DiscussionsGeoscientific
Model Development
Open Access Open Access
Geoscientific
Model Development
DiscussionsHydrology and
Earth System
Sciences
Open AccessHydrology and
Earth System
Sciences
Open Access DiscussionsOcean Science
Open Access Open Access
Ocean Science
DiscussionsSolid Earth
Open Access Open Access
Solid Earth
DiscussionsThe Cryosphere
Open Access Open Access
The Cryosphere
DiscussionsNatural Hazards
and Earth System
Sciences
Open Access
Discussions
Comparison between qualitative rockfall risk rating systems for
a road affected by high traffic intensity
P. Budetta and M. Nappi
Department of Civil, Architectural and Environmental Engineering, University of Naples “Federico II”, Piazzale Tecchio, 80, 80125 Naples, Italy
Correspondence to: P. Budetta ([email protected])
Received: 23 October 2012 – Published in Nat. Hazards Earth Syst. Sci. Discuss.: – Revised: 16 January 2013 – Accepted: 2 May 2013 – Published: 22 June 2013
Abstract. The paper deals with the assessment of the
rock-fall risk for a road stretch, in southern Italy, affected by high traffic intensity. Three qualitative rockfall risk rating systems (QRSs) which use an exponential scoring with a base of 3 were employed, and then the results were compared. The used methods are the following: the Rockfall Hazard Rating System, a modified version of this method already proposed in the past by one of the authors, and the modified version of the Colorado Rockfall Hazard Rating System. The stud-ied road stretch is about 11 km in length and is part of a very tortuous road flanked by rock slopes characterised by complex geostructural and geomechanical layouts. The road was subdivided into 56 sections, defined so as to have – as much as possible – homogeneous geological characteristics. By means of the three QRSs, it was possible to ascertain that high levels of rockfall risks are due to the lack of ditches, a very limited percentage of decision sight distance (PDSD) values and a small roadway width, whereas a subordinate factor is the hazard caused by rockfalls. Several positive and negative aspects arising from the use of the employed meth-ods are highlighted and discussed.
1 Introduction
Transportation corridors in a great deal of regions are of-ten liable to undergo rockfalls, which cause a major haz-ard for motorists as well as a large amount of damage and injuries (Bunce et al., 1997; Hungr et al., 1999; Budetta et al., 2005). Over the last two decades, several qualitative risk rating systems (QRSs) have been proposed in order to re-duce the potential consequences of rockfalls, and information
technology systems (involving the use of electronic data sets, video images, lidar-based technologies, and GIS) have been implemented by several authors and transportation agencies in the USA, Canada, Australia and elsewhere (Pierson et al., 1990; Franklin and Senior, 1997; Bateman, 2003; Rose, 2005; Drumm et al., 2005; Liang et al., 2006; Pack et al., 2007; Youssef and Maerz, 2012; Russell et al., 2008; Mekni et al., 2008; Ferrero et al., 2011; Lato et al., 2012; Mignelli et al., 2012).
A lot of these QRSs invariably use a crude exponential scoring pattern requiring a base of 3 (e.g. 3, 9, 27, 81 or 1, 3, 9, 27, 81), and the total score reflecting the risk de-rived from the summation of scores of factors of differ-ent quantitative and qualitative categories (the slope height, ditch effectiveness, traffic, geological characteristics, fail-ure magnitude and consequence). In particular the geologi-cal characteristics of slopes and cuts are described in an in-adequate manner, and the parameters do not always seem appropriate (Hack, 2002; Budetta, 2004; Pantelidis, 2009). Furthermore, this procedure is not consistent with the def-inition of risk used in the quantitative risk analysis (QRA) (risk = hazard×consequences), and related results cannot be compared (Pantelidis, 2011).
In order to evaluate the rockfall hazard, we should use probabilistic or deterministic approaches for calculat-ing safety factors of the studied road slopes. As these ap-proaches require several geomechanical and statistical data along many kilometres of road, they are not quick methods. However, the documentation of rockfall activity is commonly poor for most roads or absent for new roads, and complete landslide inventories are rare due to the lack of reporting of small/medium events by companies that manage the roads.
1644 P. Budetta and M. Nappi: Comparison between QRS high-traffic road
Furthermore, many variables do not make QRA easy, e.g. simplifying assumptions adopted as regards the traffic and vehicles, disregarding socio-economic consequences due to traffic disruption, empirical or heuristic methods used for the study of correlations between the rockfall frequency and the triggering factors. As a result, a high level of sophisticated calculations is often inadequate with regard to the quality of data input.
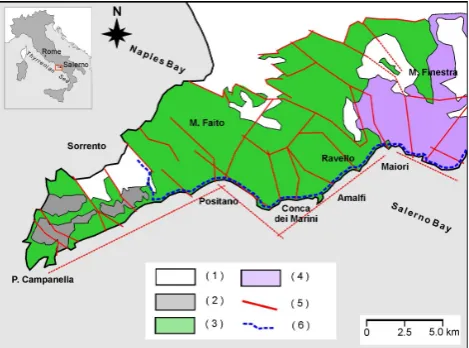
QRSs are the most widely used methods because they are “first-level” or “intermediate” characterisation approaches, useful for subsequent detailed geomechanical analyses in well-located areas (Fell et al., 2008). In the international lit-erature there are no investigations concerning the main dif-ferences and similarities among these methods. Pantelidis (2011) listed 18 systems and performed a critical review, but he did not make a real comparison applying them to the same road stretch. Consequently, it is difficult to decide what method best suits the local geological and environmental set-tings. The aim of this paper is therefore to show the results of three qualitative methods: the original Rockfall Hazard Rat-ing System (RHRS) by Pierson et al. (1990), the modified version of RHRS (mRHRS) proposed by Budetta (2004), and the modified Colorado Rockfall Hazard Rating System (CRHRS) proposed by Russell et al. (2008). The studied road stretch belongs to an important road linking some famous tourist resorts in the southern slope of the Sorrento Penin-sula (southern Italy) such as Positano, Amalfi and Salerno, the province capital town (Fig. 1). This road is affected by a high traffic intensity because it is the only transportation cor-ridor in this area that, due to its complex geomorphological and geostructural setting, is sometimes affected by rockfalls, which cause damage and road closures.
2 Methods
All three methods use an exponential scoring system with a base of 3, and the risk (R) is given by (Pantelidis, 2011)
R=fm+6fh+fd+6fc, (1) wherefm,fh,fd, andfcare factors related to the estimated magnitude of failure (m), the failure hazard (h), the ditch ef-fectiveness (d), and the consequences of a possible failure (c), respectively.
The Rockfall Hazard Rating System (RHRS) was de-veloped at the Oregon Transportation Department and was tested at over 4000 sites along the US motorway system (Pierson et al., 1990; Pierson and van Vickle, 1993; Pier-son et al., 2005). The exponential scoring system applies to the hazard factors (slope height, geological characteristics, block size, volume of rockfall per event, climate and pres-ence of water on slope and rockfall history) and to the con-sequence factors (ditch effectiveness, average vehicle risk, percentage of decision sight distance, roadway width). Some categories are described qualitatively and might lead to
ap-27 1
Figure 1. Geological map of the study area. 1) Alluvial, colluvial and pyroclastic deposits; 2) 2
Miocene silico-clastic deposits; 3) Mesozoic limestones; 4) Mesozoic dolomites; 5) Main 3
faults; 6) The route of the “Amalfitana” no. 163 state road. 4
5
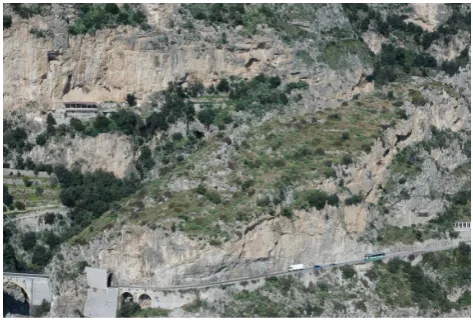
Figure 2. The Conca dei Marini site with the vehicular flow on the “Amalfitana” road. 6
Fig. 1. Geological map of the study area. (1) Alluvial, colluvial and pyroclastic deposits; (2) Miocene silico-clastic deposits; (3) Meso-zoic limestones; (4) MesoMeso-zoic dolomites; (5) main faults; and (6) the route of the Amalfitana no. 163 state road.
praisals which might be subjective and approximate. Slopes with total scores lower than 300 are classified for remedial work with a low urgency, whereas those higher than 500 need immediate stabilization measures.
In order to make the scoring criteria more objective, Budetta (2004) suggested some modifications for the above-mentioned categories. In mRHRS, Romana’s slope mass rat-ing (SMR – Romana, 1985, 1988, 1991) for the slope insta-bility hazard evaluation was introduced. Consequently, some parameters were introduced to cover geomechanical features of discontinuities, slope failure modes and cut excavation methods. Another reason for which Romana’s classification has been used is to rate the joint spacing and groundwater conditions of outcropping rock masses. On behalf of the JTC-1 (Joint Technical Committee on Landslides and Engineered Slopes), Fell et al. (2008) suggested mRHRS as an interme-diate characterisation method for cuts and slopes along roads and railways.
P. Budetta and M. Nappi: Comparison between QRS high-traffic road 1645
For predicting the total hazard score using fewer parame-ters than the 18 contained in CRHRS, equations based on the ordered logistic regression of 355 slopes of crystalline, sedi-mentary and block-in-matrix rocks were developed (Santi et al., 2009). For sedimentary rock masses the following equa-tions were developed, where the predictive total hazard score (PS) is given by (Santi et al., 2009)
i. 6-term equation, valid for cut slopes (n=43): PS=277.2+1.67(SH)+1.74(RF)+1.78(LF)
+1.42(AS)+1.63(IN)+1.35(AP) ,
R2=83 %; (2)
ii. 4-term equation, valid for cut slopes (n=43): PS=340.1+1.88(SH)+2.41(RF)+1.41(AS)
+1.98(IN) , R2=68 %; (3) iii. 4-term equation, valid for total slopes (n=31):
PS=225.9+3.16(LF)+4.89(PO)+1.86(NS) +1.81(WG) , R2=82 %, (4) where SH is slope height, RF rockfall frequency, LF launch-ing features, AS slope aspect, IN degree of interbeddlaunch-ing, AP aperture of discontinuities, PO persistence and orientation of discontinuities, NS number of sets of discontinuities, and WG weathering condition of discontinuities.
Even though it is not as detailed as the overall measured score (based on 18 parameters for sedimentary rock masses), these equations can be used for a rapid, preliminary rating of the slope hazard (Santi et al., 2009).
In all three methods, the percentage of the decision sight distance (PDSD) category is employed. PDSD measures the percentage of reduction in the decision sight distance (DSD). For USA roads this percentage is obtained according to AASHTO (2011), whereas in Italy the Italian Road Rules must be used (Ministerial Decree 5/11/2001, no. 6972). Ac-cording to these rules, PDSD is given by
PDSD=ASD
DSD·100 %, (5)
where ASD is the actual sight distance (km) and DSD repre-sents the length of road (km) a driver needs in order to make a complex or instantaneous decision.
In Italy, DSD is considered as the distance along a road-way within which a 15 cm high stationary object is continu-ously visible from 1.10 m above the road (i.e. the height of a driver’s eye on the road). ASD in the two traffic directions should be evaluated because, normally, an object will be most obscured when it is located just beyond the sharpest part of a curve. Consequently, in the same road section depending on the two traffic directions, ASD can be greatly different.
27 1
Figure 1. Geological map of the study area. 1) Alluvial, colluvial and pyroclastic deposits; 2) 2
Miocene silico-clastic deposits; 3) Mesozoic limestones; 4) Mesozoic dolomites; 5) Main 3
faults; 6) The route of the “Amalfitana” no. 163 state road. 4
5
Figure 2. The Conca dei Marini site with the vehicular flow on the “Amalfitana” road. 6 Fig. 2. The Conca dei Marini site with the vehicular flow on the
Amalfitana road.
3 The road stretch studied
The road portion studied belongs to a very tortuous road path (Fig. 2) going along the coast (the Amalfitana no. 163 state road) that was built in the middle of the 19th century by the Bourbon Department of Bridges and Roads. As a result of its age and impossibility of a modern realignment (in order to preserve the environmental heritage of this area protected by UNESCO), the road is characterised by the following: (i) only one single lane going in each direction without an ad-equate hard shoulder, which does not leave enough space for the driver to swerve to avoid any fallen rocks; (ii) no ditches to retain any fallen rocks, allowing the material to spill out onto the road; and (iii) a high degree of road curvature result-ing in a small PDSD. The width of the road is 7.0 m, but it is not wide enough in most places to allow vehicles to overtake one another (especially buses and trucks) or vehicles travel-ling in opposite directions meeting up.
The road stretch, of 11.050 km in length (from km 23+
700 to km 34+750 with increasing progressive kilome-tres towards Salerno) crossing several municipal territories, has been subdivided into 56 sections. These sections, with lengths varying between about 330 and 70 m, were defined so as to have – as much as possible – homogeneous geolog-ical characteristics. Seventeen sections having a total length of about 3.6 km were rejected from further processing be-cause slopes flanking the road are either not affected by po-tential rockfalls or are anthropized with buildings and high walls. By means of topographic maps and field measure-ments, ASD for the remaining 39 sections, in both direc-tions, were calculated by the following (Ministerial Decree 5/11/2001, no. 6972):
ASD=2p2R(b+c) , (6)
where R is the radius of the curvature of the road (mea-sured by the topographical map),bthe distance between the driver’s eye and the edge of the road curve, andcthe distance
1646 P. Budetta and M. Nappi: Comparison between QRS high-traffic road
between a possible boulder placed on the lane and the edge of the road curve.
Where sight distances are more critical, due to the pres-ence of obstacles or vegetation, b values were measured using levelling rods. For the sake of simplicity, the sup-posed boulder position on the road was always assumed at
c=3.50 m from the edge of the curve, this distance being half of the road width. The posed speed limits (PSLs), as a function of the tortuous road path, are 50, 40 and 30 km h−1. PDSD obtained using Eq. (5) for all sections, varies between 38 % and 30 %, and it is always very limited.
An analysis of traffic data recorded in the spring/summer and the autumn/winter periods of 2003, and for differ-ent sunlight conditions (day and night), was performed by Cantarella and De Luca (2006). About 80 % of the traffic is made up of cars and the remainder of tourist coaches and mo-torcycles. Considering the average daily traffic (ADT) data, during the two above-mentioned periods, there are not any notable differences and the traffic is almost constant. The ve-hicular flow due to commuting and business (very intense in the low season) during the spring/summer period is replaced by an equally intense tourism one.
In order to evaluate the average vehicle risk (AVR), ADT and PSL data were used according to the following formula (Pierson et al., 1990):
AVR=(ADT·SL·100 %)
PSL , (7)
where SL is the hazard zone length (km).
AVR represents the spatial probability of occurrence of a vehicle in the rockfall road sector and varies as a function of the two road directions and seasons of the year. Along the road, AVR varies between 8.7 % (in the winter period) and 66.4 % (in the summer period).
4 Field surveys and geological data
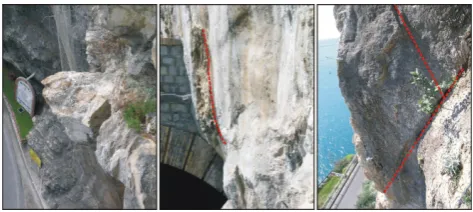
The study area (Fig. 1) lies on the northern side of the Gulf of Salerno. This area belongs to the wider context of the Sorrento–Amalfi peninsula that, in turn, is a carbonatic horst which is transversal to the Southern Apennine chain, sep-arating two tectonic depressions – the Campania Plain to the north and the Gulf of Salerno to the south (Bonardi et al., 2009). Major NE–SW-trending faults delimit the penin-sula, which is also affected by several NW–SE transverse faults (partly strike-slip faults) creating secondary horst– graben structures. As a result of the heavy tectonic distur-bance, outcropping rock masses are always extremely frac-tured (Fig. 3).
In order to detect geometrical and geological parame-ters needed for the application of selected QRSs, field sur-veys were carried out on slopes flanking the 39 road sec-tions potentially affected by rockfalls. With reference to cli-mate conditions (annual precipitations and freeze–thaw cy-cles) as well the water infiltration, references were made to
28 1
Figure 3. Examples of unstable blocks impending over the studied road stretch. 2
3
Figure 4. The Rockfall risk rating for the traffic direction towards Furore and for the 4
spring/summer period, recorded for the 33 road sections studied by means of the RHRS. 1) 5
Consequence score; 2) Hazard score; 3) Road section affected by rock falls. 6
Fig. 3. Examples of unstable blocks impending over the studied road stretch.
Ducci and Tranfaglia (2008). For the study area (in the pe-riod 1951–1980), average values of the annual precipitation and temperature were 1350 mm yr−1and 15◦C, respectively, while the average infiltration rate is 450 mm yr−1(Ducci and Tranfaglia, 2008). In order to rate geomechanical features of discontinuities (such as joint orientations and spacing, rock-quality designation (RQD), apertures, shear strength of discontinuities and so on), needed for calculation of SMR index (coupled in mRHRS), about 40 perpendicular scan lines were carried out by experienced rock-climbing geol-ogists. Due to the significantly more complex and laborious approach required in mRHRS with respect to the other two methods, only seven slopes at Conca dei Marini, Amalfi, and Maiori were studied.
P. Budetta and M. Nappi: Comparison between QRS high-traffic road 1647
time the intact rock portions (rock bridges) separating the adjacent rock walls with open discontinuities.
5 Rockfall events and return periods
High cuts and natural slopes give rise to falls, planar or wedge slides and, more rarely, topples mainly due to the unfavourable layout of the joints, geomorphology, climate, and vegetation (joint enlargement caused by the roots of the plants). With reference to the entire road path of the Amal-fitana from Positano to Cetara, Ferlisi et al. (2012) prepared a rockfall database using different documentary sources that covers a time span from 1853 to 1999. Rockfalls were clas-sified on the basis of the magnitude (boulder volume) de-posed on the road. A total of 82 rockfalls were recorded. The rockfall inventory was enlarged using new data by ANAS (the national company which owns the road) related to the time span from 2000 to 2008, and IFFI Catalogue (Progetto IFFI, 2010) spanning from 1969 to 1998. In such a way, a database reporting the progressive kilometres, dates and mu-nicipalities in which falls happened was prepared covering a time span from 1969 to 2008 (Table 1). A total of 33 events were recorded with a maximum rockfall density affecting road sections crossing the territories of Conca dei Marini and Amalfi. Due to the non-recording of small rockfall volumes by ANAS, the catalogue is incomplete. Rockfalls mainly oc-cur in autumn/winter depending on high-intensity and short-duration rainfalls usually occurring during the months of Oc-tober and November. Secondary falls of already detached boulders that are no longer supported by vegetation often re-sult from summer wildfires.
According to Corominas and Moya (2008), the rock-fall frequency was expressed as relative frequency (fr) (i.e. the number of rockfalls reaching the infrastructure per unit length and per year). Reliable data can be referred to only for sections crossing the territory of Conca dei Marini and Amalfi for which values offrof about 0.14 and 0.13 events yr−1km−1 were calculated. An explanation for these lowfr values is the presence of protection measures (such as barriers or wire meshes) on a lot of slopes hang-ing over the road with more put in place durhang-ing the 1980s and 1990s. For safety reasons, in QRS calculations these pro-tection measures were not taken into account. Consequently, along protected road stretches the hazard could be overesti-mated.
For road sections crossing the territory of Conca dei Marini, an attempt was made so as to derive rockfall return periods – for assigned volume classes – using the landslide magnitude-frequency curves (MFCs). According to Hungr et al. (1999), Dussauge et al. (2003) and Malamud et al. (2004), the MFC for rockfalls can be described by a power law in the following form:
LogN (V )=N0+b·logV , (8)
Table 1. Progressive distances where rockfalls occurred.
Progressive Date Municipality kilometres
23+700 – Furore
24+000 April 2007 Furore
24+100 January 2001 Conca dei Marini 24+200 March 2008 Conca dei Marini 24+600 January 2001 Conca dei Marini 25+000 April 2002 Conca dei Marini
25+100 – Conca dei Marini
25+300 – Conca dei Marini
25+400 – Conca dei Marini
25+500 – Conca dei Marini
26+300 – Conca dei Marini
26+320 April 2002 Conca dei Marini
26+350 – Conca dei Marini
26+400 September 1996 Conca dei Marini
26+420 – Conca dei Marini
26+650 December 2002 Conca dei Marini 26+700 May 2000 Conca dei Marini
28+100 – Amalfi
– September 1997 Amalfi
29+000 – Amalfi
29+200 December 2004 Amalfi
29+300 – Amalfi
29+400 November 1997 Amalfi 29+450 November 1997 Amalfi 29+650 January 1994 Amalfi 33+000 November 1997 Ravello 33+200 November 1997 Minori
34+000 – Minori
34+500 October 2003 Minori 34+580 August 1998 Minori 34+600 November 1994 Maiori 34+700 January 1969 Maiori 34+750 September 2006 Maiori
whereN (V )is the cumulative annual frequency of rockfall events exceeding a given volume classj,N0the annual rock-fall frequency, andbthe power law exponent.
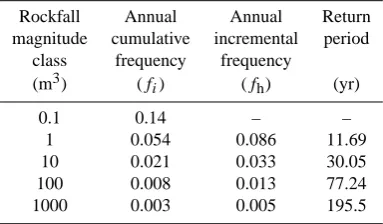
N (V )in a given volume classj(i.e.Nj) can be calculated according to the approach by Hungr et al. (1999). In the case where site-specific magnitude values are missing, Agliardi et al. (2009) suggested the use of a value of−0.41 for the expo-nentbderived from the literature (i.e. the value for carbonate rocks proposed by Dussauge et al., 2003). This value usu-ally varies within a quite narrow range, i.e.−0.7< b <−0.4 (Hungr et al., 1999; Dussauge et al., 2003; Picarelli et al., 2005). With reference to the rockfall inventory, and the fr value of about 0.14 events yr−1km−1, return periods varying between about 11.7 and 77 yr (for the rockfall magnitude in-terval 1÷100 m3) were calculated (Table 2). Caution should be taken when using these data due to uncertainties springing from the lack of a substantially complete catalogue.
1648 P. Budetta and M. Nappi: Comparison between QRS high-traffic road
Table 2. Rockfall volume classes, expected frequencies, and re-turn periods according to the adopted magnitude-frequency curve (MFC).
Rockfall Annual Annual Return magnitude cumulative incremental period
class frequency frequency
(m3) (fi) (fh) (yr)
0.1 0.14 – –
1 0.054 0.086 11.69
10 0.021 0.033 30.05
100 0.008 0.013 77.24
1000 0.003 0.005 195.5
6 Results and comparison between the employed methods
6.1 RHRS results
The total rating was calculated for each of the 39 sections in both traffic directions (towards Furore and Maiori) and in two periods per year (spring/summer and autumn/winter) (Fig. 4). No appreciable difference was found among scores with reference to the above-mentioned conditions because, due to a very tortuous road path with small radii of curva-tures, PDSD is always very limited. With reference to AVR there are no great differences among the sections because, during the year, the daily traffic is almost constant. Along the road there are no ditches to retain any fallen rocks; ditch catchment, PDSD, and AVR are the factors that affect the consequence score. Among sections, differences in the haz-ard score are mainly due to the slope height, structural con-dition + friction, block size and rockfall history categories. These are the parameters that undergo most changes.
It is worth observing that, in 74 % of the cases, the sum of scores of consequence factors is higher than those com-ing from hazard factors (Fig. 4). In particular this is true for sections nos. 21, 30, 44, 45 and 50 with a low hazard score (about 100), whereas the consequence score attains a double value compared to the first one (about 220, on average). This occurrence highlights that the rockfall risk is mainly due to the lack of ditches, very limited PDSD values and a small roadway width. As shown by low relative frequency (fr) val-ues, the hazard due to these rockfalls is a minor factor.
6.2 mRHRS results
Due to the significantly more complex and laborious ap-proach required by mRHRS, compared to the original RHRS, only five road sections at Conca dei Marini, one section at Amalfi, and one section at Maiori were studied. These sec-tions were chosen because they have recognizable bound-aries on the map scale (1:5000) and their overall homogene-ity is a function of their relief type, geomorphology and
ge-28 1
Figure 3. Examples of unstable blocks impending over the studied road stretch. 2
3
Figure 4. The Rockfall risk rating for the traffic direction towards Furore and for the 4
spring/summer period, recorded for the 33 road sections studied by means of the RHRS. 1) 5
Consequence score; 2) Hazard score; 3) Road section affected by rock falls. 6
Fig. 4. The rockfall risk rating for the traffic direction towards Furore and for the spring/summer period, recorded for the 33 road sections studied by means of the RHRS. (1) Consequence score; (2) hazard score; and (3) road section affected by rockfalls.
ological structure. A total length of about 890 m of the road path was characterised.
On the basis of the geostructural features of discontinuities (joint orientation, spacing, RQD, joint condition and ground-water) and uniaxial compression strength values, a common rating regarding the basic rock mass rating (RMR) by Bi-eniawski (1989) has been calculated for all road sections (RMRb=65), given the homogeneity of the investigated rock masses. The SMR index (Romana, 1985), varying be-tween 42 and 89, identifies instability classes ranging from the second (“stable slopes”) to the third class (“partially sta-ble slopes”) with a clear prevalence of the second class crop-ping out in all three studied sites (Fig. 5). Similarly to what has already been evaluated by means of RHRS, this occur-rence testifies a low rockfall hazard. Furthermore, according to Palmstr¨om (1996) and ISRM (1978), block volumes (Vb) vary between 10 and 100 dm3. Even though poorer geome-chanical properties and consequent slope stability conditions were detected at Conca dei Marini and Maiori, these sites do not show a higher difference in the total hazard score, com-pared to Amalfi. Here (section no. 38), higher scores of the slope height category greatly contribute to raise the hazard.
6.3 CRHRS results
P. Budetta and M. Nappi: Comparison between QRS high-traffic road 1649
Fig. 5. mRHRS values characterising some of road sections and cyclographic projections of joint sets affecting homogeneous zones of rock masses. Key: (A) Conca dei Marini; (B) Amalfi; (C) Maiori; S – poles of bedding planes; K1. . .Kn – poles of tectonic joint sets. The red dots show the location of the geomechanical stations and related SMR values.
score category, was calculated (Fig. 6). Ditch catchment, an-nual precipitation and PDSD factors have the highest per-centage contribution, whereas the slope characters, geologi-cal factors, as well as launching features reach percentages varying between 10 % and 4 %. All other factors attain per-centages smaller than 1.5 % (Fig. 6). In conclusion, a small contribution to overall rockfall risk is supplied by the follow-ing categories: rockfall frequency, annual freeze–thaw cy-cles, seepage, degree of undercutting, jar slake, degree of interbedding, block size, friction, AVR, and the number of accidents.
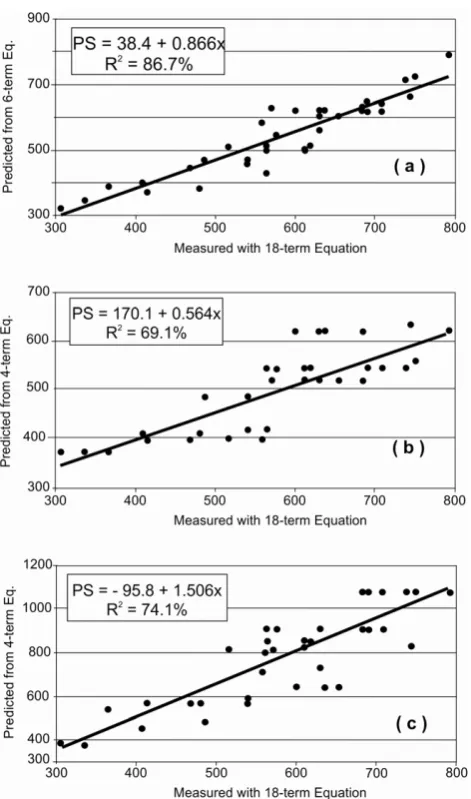
In order to predict the total hazard score (PS), using fewer parameters than the 18 contained in the CRHRS, the equa-tions developed by Santi et al. (2009) were used. Linear regressions were obtained correlating the actual measured CRHRS score (based on 18 parameters recorded in the field) with the score predicted from Eqs. (2), (3), and (4). The best fits were obtained using the linear least square regression – within a 95 % confidence interval – on the above-mentioned predictive equations, which are based on more independent variables (Fig. 7). The strength of the linear association be-tween variables was judged on the basis of the calculated coefficient of determinationR2 (ranging between 69 % and
31 1
Figure 6. Percentage contribution to the total final rating of the categories employed in the 2
CRHRS. 3
Fig. 6. Percentage contribution to the total final rating of the cate-gories employed in the CRHRS.
87 %). It is worth observing that, in order to predict PS val-ues, five hazard variables (SH, LF, AS, AP, and WG) were used – out of a total of 10 that appear in Eqs. (2) and (4) – having a higher percentage contribution to the measured 18-term score. On the contrary, in the 4-18-term Eq. (3), two hazard variables (RF and IN) are characterised by low percentage contributions (smaller than 1.5 %). Consequently, this equa-tion seems to be less suitable for predicting reliable PS val-ues. This occurrence is also confirmed by the higher values
1650 P. Budetta and M. Nappi: Comparison between QRS high-traffic road
32 1
Figure 7. Linear regressions obtained using the equations (2), (3) and (4) by Santi et al., 2009. 2
The x-axis plots the actual measured CRHRS score based on 18 parameters recorded in the 3
field. The y-axis plots scores attained from the 6-term eq. valid for cut slopes (a), 4-term eq. 4
valid for cut slopes (b), and 4-term eq. valid for total slopes (c), respectively. 5
Fig. 7. Linear regressions obtained using Eqs. (2), (3) and (4) by Santi et al. (2009). The x-axis plots the actual measured CRHRS score based on 18 parameters recorded in the field. The y-axis plots scores attained from the 6-term equation valid for cut slopes (a), 4-term equation valid for cut slopes (b), and 4-4-term equation valid for total slopes (c).
of theR2obtained linking PS values calculated with Eqs. (2) and (4) to the measured 18-term score (Fig. 7).
Total scores calculated by means of RHRS and CRHRS vary between 317÷543 and 400÷879, respectively. As a greater number of factors (18) must be rated by means of CRHRS, final ratings are higher than those obtained with the RHRS method (10 parameters). Nevertheless, as is evi-dent from their respective normalized coefficients of varia-tion (CV), the two intervals of values are characterised by a very low relative variability (Table 3). CV is given by
CV= σ
µ √
n−1 0≤CV≤1, (9)
Table 3. Main statistical data obtained with the employed methods. Interval values refer to the spring/summer period and in the direc-tion towards Furore. Arithmetic mean (µ); standard deviadirec-tion (σ); normalized coefficient of variation (CV).
Method Interval values µ σ CV
RHRS 317÷543 410 61.269 0.024
CRHRS 339÷879 676 120.745 0.028
whereσ is the standard deviation andµthe arithmetic mean of the population (ndata).
A good correlation was also found between final scores, which shows an increasing linear trend of CRHRS values as a function of the RHRS increase. The found equation is CRHRS=17.96+1.61RHRS r=0.82, (10) whereris Pearson’s correlation coefficient.
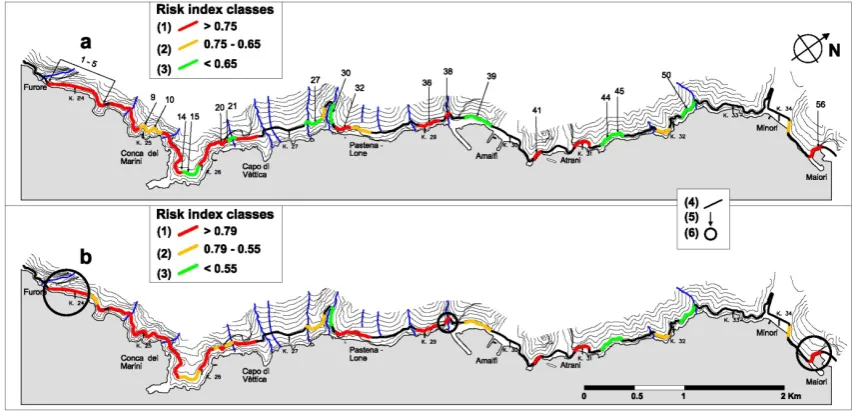
At last, in order to perform an effective comparison be-tween the systems to be achieved, total scores were appro-priately standardized. Each value is expressed as a percent-age ratio on the maximum value so that the highest risk index will be 1 and so on, until the minimum value. For each system three classes, which limit values identifying a high, medium and low risk respectively, have been fixed up (Fig. 8). Threshold limit values between classes were identi-fied taking into account rockfalls that occurred in each road section. Although 76 % of rockfalls affected sections with a high risk level, the remaining percentage involved sections with a medium risk. This is not surprising because it is pos-sible that, for some sections falling within this medium risk, the hazard score is comparable to that characterising sections affected, however, by a greater consequence score.
With reference to the mRHRS method, due to not many available data (only 7), it is impossible to perform a reliable statistical analysis. Consequently, only a general qualitative agreement between the ratings of hazard factors calculated by means of the three selected methods can be seen.
7 Discussion and conclusions
In the international literature there are no investigations con-cerning the main differences and similarities among the above-mentioned methods. Consequently, in order to com-pare results an attempt was performed on a road flanked by rock slopes characterised by complex geostructural and ge-omechanical layouts.
P. Budetta and M. Nappi: Comparison between QRS high-traffic road 1651
33
1
Figure 8. Comparison between rockfall risk classes evaluated, for the entire road stretch, by
2
means of the RHRS (a) and CRHRS (b), respectively. 1) High rockfall risk; 2) Medium
3
rockfall risk; 3) Low rockfall risk; 4) Road section unaffected by potential rock falls; 5) Road
4
section quoted in the text; 6) Road section studied by means of the mRHRS.
5
Fig. 8. Comparison between rockfall risk classes evaluated, for the entire road stretch, by means of the RHRS (a) and CRHRS (b). (1) High rockfall risk; (2) medium rockfall risk; (3) low rockfall risk; (4) road section unaffected by potential rockfalls; (5) road section quoted in the text; and (6) road section studied by means of the mRHRS.
some road sections, is mainly due to the lack of ditches, low PDSD values and a small roadway width, whereas a subor-dinate factor is the hazard caused by rockfalls. This result is in general agreement with low relative frequency (fr) values calculated for the road sections which display more reliable rockfall data (such as at Conca dei Marini and Amalfi). As far as the results of the mRHRS are concerned, it has been possi-ble to avoid subjective ratings for the geological characteris-tics, by means of applying the SMR index. However, in order to apply Romana’s SMR many scan lines and field measure-ments carried out by experienced rock-climbing geologists were necessary. The use of the SMR index may provide a better description of the rock slope stability, but makes the method significantly more complex than the original RHRS and may require more training and experience. This approach is notoriously laborious and cannot be applied along many kilometres of the road. Although it is impossible to statisti-cally compare mRHRS final ratings with those supplied by the other two methods (due to the few rated sections), a gen-eral qualitative agreement between the data available can be seen. If we compare only the ratings of hazard factors, this occurrence can be clearly seen. In fact, the hazard parame-ters may vary considerably case by case, whereas very often the consequence factors have similar scores.
With reference to the CRHRS, smaller differences can be observed between the final risk of the rated sections. This oc-currence is probably due to the presence of more numerous categories (ditch catchment, precipitations, freeze–thaw cy-cles, seepage/water, jar slake, degree of interbedding, and the number of accidents) with similar scores with respect to the other two methods. Because a greater number of factors are analysed and then rated, final ratings are higher than those obtained using the other two methods. Consequently, in
or-der to compare the employed methods, it was necessary to standardize them. With reference to the rockfall hazard cal-culated using the equations by Santi et al. (2009), it is not necessary to rate all 18 parameters regarding the outcropping sedimentary rock masses. The study showed that even though the four parameters in Eq. (3) are more easily detectable with field surveys or maps (the factors SH, RF, and AS can be di-rectly measured and then scored, whereas only IN requires a subjective evaluation), higherR2values are obtained corre-lating the values of PS – calculated with Eqs. (2) and (4) – to the measured 18-term score. A higher effectiveness of these equations can be assumed.
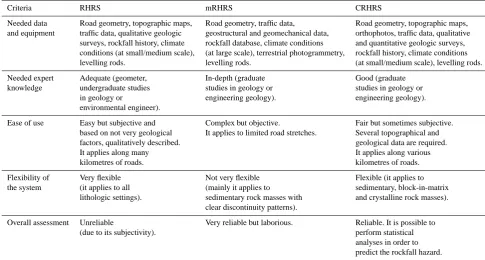
The adopted methods are “first-level” (RHRS and CRHRS) and “intermediate” (mRHRS) characterisation sys-tems useful for subsequent detailed geomechanical analyses in well-located high-hazard areas (Fell et al., 2008). With ref-erence to needed equipment and expert knowledge, ease of use, and flexibility of the systems, a comparison is proposed in Table 4. If needed input data along many kilometres of road are defective, it is preferable to use CRHRS as a first-level method. In order to predict the rockfall hazard, it is also possible to perform reliable statistical analyses. On the con-trary, if more suitable and numerous geological, traffic, ge-omechanical and topographical data are available, mRHRS as an intermediate characterisation method might be used.
Finally, it should be kept in mind that results supplied by the above-mentioned methods require continuous updat-ing. This happens not only when a better assessment of any components can modify the calculated risk level (e.g. changes in traffic intensity over time) but also when either stabilization or protective measures have been implemented (Ferlisi et al., 2012; Corominas et al., 2008).
1652 P. Budetta and M. Nappi: Comparison between QRS high-traffic road
Table 4. General comparison between criteria and concise overall assessment.
Criteria RHRS mRHRS CRHRS
Needed data Road geometry, topographic maps, Road geometry, traffic data, Road geometry, topographic maps,
and equipment traffic data, qualitative geologic geostructural and geomechanical data, orthophotos, traffic data, qualitative surveys, rockfall history, climate rockfall database, climate conditions and quantitative geologic surveys, conditions (at small/medium scale), (at large scale), terrestrial photogrammetry, rockfall history, climate conditions
levelling rods. levelling rods. (at small/medium scale), levelling rods.
Needed expert Adequate (geometer, In-depth (graduate Good (graduate
knowledge undergraduate studies studies in geology or studies in geology or
in geology or engineering geology). engineering geology).
environmental engineer).
Ease of use Easy but subjective and Complex but objective. Fair but sometimes subjective.
based on not very geological It applies to limited road stretches. Several topographical and
factors, qualitatively described. geological data are required.
It applies along many It applies along various
kilometres of roads. kilometres of roads.
Flexibility of Very flexible Not very flexible Flexible (it applies to
the system (it applies to all (mainly it applies to sedimentary, block-in-matrix
lithologic settings). sedimentary rock masses with and crystalline rock masses).
clear discontinuity patterns).
Overall assessment Unreliable Very reliable but laborious. Reliable. It is possible to
(due to its subjectivity). perform statistical
analyses in order to predict the rockfall hazard.
Acknowledgements. The authors are grateful to D. Calcaterra, B. Merz and three referees for their valuable comments and suggestions that improved this paper. The authors would also like to thank the Regional Agency “Autorit`a di Bacino Destra Sele” and ANAS “Ente Nazionale per le Strade”, who provided geomechanical, traffic, and landslide data. This work was carried out with a financial contribution from the University of Naples “Federico II”, under the guidance of P. Budetta.
Edited by: B. Merz
Reviewed by: L. Pantelidis and two anonymous referees
References
AASHTO (American Association of State and Highway Trans-portation Officials): A Policy on Geometric Design of Highways and Streets (The Green Book), AASHTO, Washington, 906 pp., 2011.
Agliardi, F., Crosta, G. B., and Frattini, P.: Integrating rock-fall risk assessment and countermeasure design by 3D mod-elling techniques, Nat. Hazards Earth Syst. Sci., 9, 1059–1073, doi:10.5194/nhess-9-1059-2009, 2009.
Bateman, V.: Development of a database to manage rockfall hazard: The Tennessee rockfall hazard database, in: Proc. 82nd annual meeting of Transportation Research Board, Washington DC, 97– 103, doi:10.3141/1821-12, 2003.
Bieniawski, Z. T.: Engineering Rock Mass Classifications, John Wi-ley & Sons, New York, 251 pp., 1989.
Bonardi, G., Ciarcia, S., Di Nocera, S., Matano, F., Sgrosso, I., and Torre, M.: Carta delle principali unit`a cinematiche
dell’Appennino meridionale – Nota illustrative, It. J. of Geosci., 128, 47–60, doi:10.3301/IJG.2009.128.1.47, 2009 (in Italian). Budetta, P.: Assessment of rockfall risk along roads, Nat. Hazards
Earth Syst. Sci., 4, 71–81, doi:10.5194/nhess-4-71-2004, 2004. Budetta, P., De Riso, R., and Santo, A.: Landslide hazard and
risk along the campanian roads (Italy), in: Proc. Int. Congr. “G´eoline”, Lyon, France, 1–13, 2005.
Bunce, C. M., Cruden, D. M., and Morgenstern, N. R.: Assessment of the hazard from rockfall on a highway, Can. Geotech. J., 34, 344–356, doi:10.1139/t97-009, 1997.
Cantarella, G. E. and De Luca, S.: Studio della mobilit`a in Costiera Amalfitana per un sistema integrato di trasporto collettivo, Re-search report, Department of Civil Engineering, University of Salerno, Italy, 105 pp., 2006 (in Italian).
Corominas, J. and Moya, J.: A review of assessing landslide fre-quency for hazard zoning purposes, Eng. Geol. 102, 193–213, doi:10.1016/j.enggeo.2008.03.018, 2008.
Drumm, E. C., Mauldon, M., Dunne, W., Bateman, V. C., and McCarter, B.: Rockfall Management System for Tennessee: Fi-nal Report – Phase II, Tennessee Department of Transportation, Nashville, available at: www.tdot.state.tn.us/longrange/reports/ res1189.pdf, last access: 20 June 2012, 2005.
Ducci, D. and Tranfaglia, G.: The effect of climate change on the hydrogeological resources in Campania region (Italy), in: Groundwater and climatic changes, edited by: Dragoni, W., Geological Society, London, Special Publications, 288, 25–38, doi:10.1144/SP288.3, 2008.
P. Budetta and M. Nappi: Comparison between QRS high-traffic road 1653
Fell, R., Corominas, J., Bonnard, C., Cascini, L., Leroi, E., and Sav-age, W. Z.: Guidelines for landslide susceptibility, hazard and risk zoning for land-use planning, Commentary, Eng. Geol., 102, 99–111, doi:10.1016/j.enggeo.2008.03.009, 2008.
Ferlisi, S., Cascini, L., Corominas, J., and Matano, F.: Rockfall risk assessment to persons travelling in vehicles along a road: the case study of the Amalfi coastal road (Southern Italy), Nat. Hazards, 62, 691–721, doi:10.1007/s11069-012-0102-z, 2012.
Ferrero, A. M., Migliazza, M., Roncella, R., and Rabbi, E.: Rock slopes risk assessment based on advanced geostructural survey techniques, Landslides, 8, 221–231, doi:10.1007/s10346-010-0246-4, 2011.
Franklin, J. A. and Senior, S. A.: The Ontario rockfall hazard rating system, in: Proc. Int. Conf. on Eng. Geol. and the Env., Balkema, Rotterdam, 1, 647–656, 1997.
Hack, R.: An evaluation of slope stability classification. Keynote Lecture, in: Proc. ISRM “Eurock 2002”, edited by: Dinis da Gama, C. and Ribeira e Sousa, L., Sociedade Portuguesa de Geotecnia, Lisboa, Portugal, 3–32, 2002.
Hungr, O., Evans, S. G., and Hazzard, J.: Magnitude and frequency of rockfalls and rock slides along the main transportation cor-ridors of southwestern British Columbia, Can. Geotech. J., 36, 224–238, doi:10.1139/t98-106, 1999.
ISRM (International Society of Rock Mechanics): Suggested meth-ods for the quantitative description of discontinuities in rock masses, Int. J. Rock Mech. Min., 15, 319–368, 1978.
Lato, M. J., Diederichs, M. S., Hutchinson, D. J., and Harrap, R.: Evaluating roadside rockmasses for rockfall hazards using LiDAR data: optimizing data collection and processing proto-cols, Nat. Hazards., 60, 831–864, doi:10.1007/s11069-011-9872-y, 2012.
Liang, R., Geiger, G., Beach, K., and Pensomboon, G.: Landslide hazard rating system in Ohio DOT, in: Proc. of GeoCongress 2006 “GIS based site characterization and geohazard analysis”, ASCE Conf. Proc., 245–269, doi:10.1061/40803(187)124, 2006. Malamud, B. D., Turcotte. D. L., Guzzetti, F., and Reichenbach, P.: Landslide inventories and their statistical properties, Earth Surf. Proc. Land., 29, 687–711, 2004.
Mekni, M., Sahli, N., and Moulin., B.: A geosimulation approach involving spatially-aware agents a case study on the identifica-tion of risky areas for trains, in: Symp. Agent-Directed Sim-ulation “ADS ’08”, Part of the 2008 Spring SimSim-ulation Multi-conference (SpringSim’08), 39–44, 2008.
Mignelli, C., Lo Russo, S., and Peila, D.: ROckfall risk MAn-agement assessment: the RO.MA. approach, Nat. Hazards, 62, 1109–1123, doi:10.1007/s11069-012-0137-1, 1012.
Ministerial Decree 5/11/2001, no. 6972: Norme funzionali e geo-metriche per la costruzione delle strade, Ministero delle Infras-trutture e dei Trasport, Gazzetta Ufficiale del 04/01/2002 n. 3, 90 pp., 2002 (in Italian).
Pack, R. T., Farnsworth, C. B., and Leonard, B. D.: Development of a rockfall hazard rating system for the State of Utah, in: Proc. of the First North American Landslide Conference, Vail, Colorado, 134–145, 2007.
Palmstr¨om, A.: The rock mass index (RMI) applied in rock me-chanics and rock engineering, Joumal of Rock Meme-chanics and Tunnelling Technology, 11, 1–4, 1996.
Pantelidis, L.: Rock slope stability assessment through rock mass classification systems, Int. J. Rock Mech. Min., 46, 315–325, doi:10.1016/j.ijrmms.2008.06.003, 2009.
Pantelidis, L.: A critical review of highway slope instability risk assessment systems, B. Eng. Geol. Environ., 70, 395–400, doi:10.1007/s10064-010-0328-5, 2011.
Picarelli, L., Oboni, F., Evans, S. G., Mostyn, G., and Fell, R.: Hazard characterization and quantification, in: Proc. Landslide Risk Management, edited by: Hung, O., Fell, R., Couture, R., and Eberhardt, E., Taylor and Francis Group, London, 27–61, ISBN: 04 1538 043X, 2005.
Pierson, L. A. and Van Vickle, R.: Rockfall Hazard Rating System – Partecipants’ manual, Federal Highway Administration, US De-partment of Transportation, Report FHWA-SA-93-057, 104 pp. 1993.
Pierson, L. A., Davis, S. A., and Van Vickle, R.: Rockfall hazard rat-ing system implementation manual. Report FHWA-OR-EG-90-01. Federal Highway Administration, US Department of Trans-portation, 80 pp., 1990.
Pierson, L. A., Beckstrand, D. L., and Black, B. A.: Rockfall Haz-ard Classification and Mitigation System. Report FHWA/MT-05-011/8176, State of Montana Department of Transportation Re-search Programs, 277 pp., available at: http://www.mdt.mt.gov/ research/projects/geotech/rockfall.shtml, last access: 12 January 2012, 2005.
Progetto IFFI: Inventario dei fenomeni franosi in Italia, available at: http://www.isprambiente.gov.it/it/progetti/ iffi-inventario-dei-fenomeni-franosi-in-italia, last access: 28 May 2013, 2010 (in Italian).
Romana, M.: New adjustment ratings for application of Bieniawski classification to slopes, in: Proc. Int. Symp. on “The role of rock mechanics”, ISRM, Zacatecas, Mexico, 49–53, 1985.
Romana, M.: Practice of SMR classification for slope appraisal, in: Proc. 5th Int. Symp. on Landslides, Balkema, Rotterdam, 1227– 1229, 1988.
Romana, M.: SMR Classification, in: Proc. 7th Int. Congr. on Rock Mech., Balkema, Rotterdam, 955–960, 1991.
Rose, B. T.: Tennessee Rockfall Management System, Disserta-tion submitted to the faculty of Virginia Polytechnic Institute and State University in partial fulfilment of the requirements for the degree of Doctor of Philosophy in Civil Engineering, 100 pp., available at: http://scholar.lib.vt.edu/theses/available/ etd-10132005-133738/, last access: 29 May 2013, 2005. Russell, C. P., Santi, P. M., and Higgins, J. D.: Modification
and statistical analysis of the Colorado Rockfall Hazard Rat-ing System, Report CDOT-2008-7, Colorado Department of Transportation DTD Applied Research and Innovation Branch, 137 pp., available at: http://www.coloradodot.info/programs/ research/pdfs/2008/crhrs.pdf, last access: 20 June 2012, 2008. Santi, P. M., Russell, C. P., Higgins J. D., and Spriet, J.
I.: Modification and statistical analysis of the Colorado Rockfall Hazard Rating System, Eng. Geol., 104, 55–65, doi:10.1016/j.enggeo.2008.08.009, 2009.
Youssef, A. and Maerz, N. H.: Development, justification, and ver-ification of a rock fall hazard rating system, B. Eng. Geol. Envi-ron., 71, 171–186, doi:10.1007/s10064-010-0339-2, 2012.