Effect of carbon doping on electronic structure and optical
properties of ZnO clusters
Sunil P. Chavan, Vaishali A. Bambole
Department of Physics, University of Mumbai, Mumbai, Maharashtra, India
ABSTRACT
A systematic study of the electronic and optical properties of the ZnnOn cluster and ZnnOn−1C (n = 1-5) is
presented in the framework of time dependent density functional theory (TDDFT). The binding energy (BE), ionization potential (IP), electron affinity (EA) and HOMO–LUMO gap were calculated to compare the stability of the doped clusters. A study of the optical band gap change for ZnO cluster and C-doped ZnO clusters has been investigated. The optical gap and the optical spectra depend on the geometry and size of the cluster. Our study reveals this dependence and also adds the effect of carbon doping. This is fruitful for tuning optical band gap for optoelectronic devices using suitable doping elements.
Keywords: C-doped ZnO clusters, TDDFT, optical gap, absorption spectra
I.
INTRODUCTION
The invention of zero-dimensional clusters formed by various elements has been a back-bone for building blocks of nano-scale materials. The significant efforts have been devoted to ZnO clusters due to its wide band gap (3.37eV) and large exciton binding energy (60meV). The ZnO system shows transparency to visible light and has high electron mobility which helps to utilize it in various potential applications in the field of optoelectronics and spintronics such as photo voltaic solar cells, optical sensitizers, photocatalysts, quantum devices or nanobiomedicine [1,2]. The novel properties of nanomaterials that usually differ from those of the bulk matter, which arise from the quantum confinement effect. The modification of these novel physical and chemical properties of nanomaterials can be achieved by doping with suitable elements.
Several experimental and theoretical studies are reported to synthesize and explore the optical properties of small and medium-sized ZnO clusters. The experimental evidence of ZnO clusters is found in
synthesized ZnO nanoclusters using electroporation of vesicles [3] and further other studies by Bulgakov et al. [4] The optical studies of ZnO clusters shows enhancement in the intensity and the blue shift of the spectral lines with an increase in size has been reported by some of the groups [5–7]. To fabricate hybrid materials with unique properties, chemical doping process has been widely used in materials science. Doping modify the electronic levels of the nanocluster, and introduce new states that could contribute to the absorption bands. The mechanism of ferromagnetic ordering in Carbon doped ZnO showed interesting results [8,9]. So it is interesting to study the impact of carbon doping on optical properties of ZnO clusters.
In this study, we have selected ZnnOn, n = 1-5 clusters
and we replace one oxygen atom by carbon atom. The total energy calculations suggest that C is more stable at the O site than at the Zn site in ZnnOn clusters. To
nature of optical excitation in ZnO clusters and carbon doped boron clusters (ZnnOn and ZnnOn−1C
with n=1–5) with the help of absorption spectra, eigen spectra and molecular orbital diagrams. For this study, we used TDDFT framework which are implemented in DMol3 code [10,11].
This research paper is organized as follows. In the next section, we describe the computational methods in brief. In section III, we discuss the results. In section IV, we summarize our results along with some important concluding remarks.
II.
COMPUTATIONAL METHODS
All calculations were performed under generalized gradient approximation (GGA) and Perdew-Burke-Ernzerhof (PBE) exchange and correlation [12,13] with double numerical basis set plus polarization (DNP) function using the DMol3 package [14]. The quality of the self-consistent field convergence tolerance was set as fine. In the generation of numerical basis sets, a global orbital cutoff of 6.0 Å
and SCF convergence of 10-6 eV criterion was selected
to get reliable accuracy. After ground state calculations, the optical absorption spectra were calculated with TDDFT method within the adiabatic local density approximation (ALDA) [10]. To calculate the optical transitions, ALDA kernel exchange correlation terms in a singlet state were used with adequate number of empty bands. Gaussian broadening was applied to the eigenvalues to get the optical spectra of the clusters.
III.
RESULTS AND DISCUSSION
A. Cluster geometries and stability
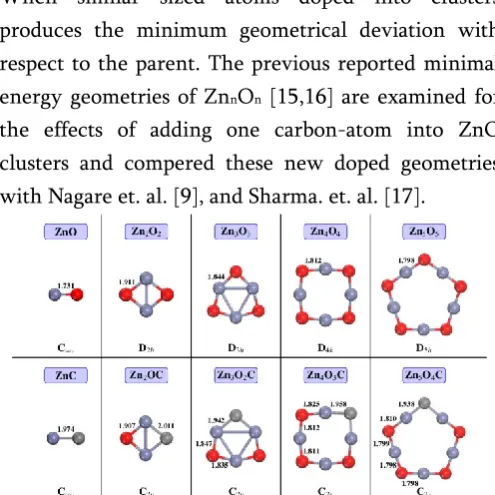
The structural properties of optimized geometries of lowest-energy structures of ZnO and carbon doped ZnO clusters are depicted in Figure 1. We substitute carbon atoms in place of oxygen atom and it is seen that there is very small effect on geometries of host
clusters. The change in bond-length due to doping can be easily observed in geometries. There is very small difference between atomic radii of oxygen and carbon. When similar sized atoms doped into clusters produces the minimum geometrical deviation with respect to the parent. The previous reported minimal energy geometries of ZnnOn [15,16] are examined for
the effects of adding one carbon-atom into ZnO clusters and compered these new doped geometries with Nagare et. al. [9], and Sharma. et. al. [17].
Figure 1. The ground state geometries of ZnO clusters and C-doped ZnO clusters along with their symmetry
and bond-length. The red, blue and grey represent Oxygen, Zinc and Carbon atom respectively.
The relative stability of structures are evaluated by using the average binding energy shown in Figure 2 (a). The average binding energy tends to increase with increasing size for ZnnOn and same trends followed by
ZnnOn-1C. While the binding energy of the ZnnOn-1C
clusters are smaller than those of ZnnOn due to the
Figure 2. The Total Binding energy, Ionization potential, Electron affinity, HOMO-LUMO gap and
Optical gap of ZnO and C-doped ZnO clusters.
We compute ionization potential (IP), electron affinity (EA) and HOMO-LUMO gap of ZnO and carbon doped ZnO clusters shown in Figure 2 (b), (c) and (d). All the calculated values consolidate structural stability of these clusters. We evaluate total energy differences between the SCF calculations performed for the neutral and charged systems (±1) to obtain the electron affinity (EA) and the ionization potential (IP) (IP = EN−1 – EN, EA = EN – EN+1) where EN
is the total energy of the N-electron system. The
values for ZnnOn clusters are comparable with
reported experimental results by Bulgakov et. al. [4] and theoretical results by Reber et. al. And others. [15,18] The binding energy, IP, EA and
HOMO-LUMO gap of ZnnOn−1C clusters are in good agreement
with previous results [9].
B. Optical properties of ZnO and C-doped ZnO
clusters
After discussing the structural stability of the clusters, the attention is now towards the study of optical excitation of clusters. The optical gap is defined as first optical transition with non zero oscillator strength. Optical gaps of ZnnOn clusters are lies in IR and UV
regions while ZnnOn−1C clusters are lies in IR and
visible regions shown in Figure 2 (e). Optical gap of
carbon doped ZnO is smaller than their host clusters except dimer. The difference between optical gap and HOMO-LUMO gap is minimum for ZnC cluster (0.008eV) and maximum for Zn4O4 and Zn5O5 cluster
(1.206eV and 1.135eV).
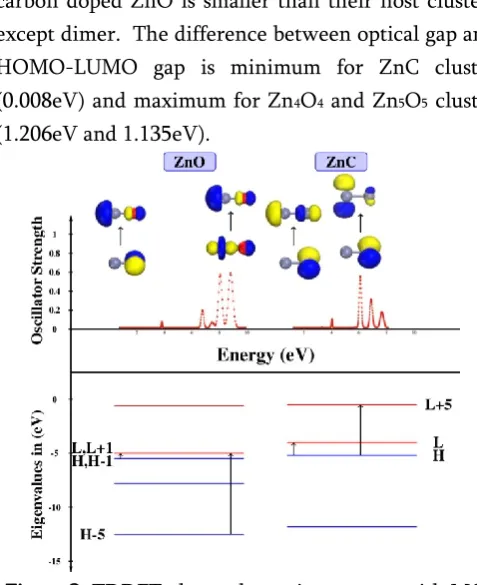
Figure 3. TDDFT photo-absorption spectra with MO of respective transitions, and eigenvalue spectra of the
ZnO and ZnC cluster.
Optical spectra of ZnO and ZnC clusters are presented in Figure 3 with molecular orbital diagram for first and most intense transition. The Figure 3 also contains eigenvalue spectra along with the electronic transitions between occupied and unoccupied states. The spectrum of ZnO cluster shows first transition at 0.81eV with fosc = 0.001 for transition from H-1→L.
The weak transitions occurs at 3.88eV (fosc = 0.065)
and 7.50eV (fosc = 0.029).
The strongest transition exhibits at 8.88eV (fosc = 0.598)
with two more prominent peaks at 6.82eV (fosc = 0.191)
and 8.11eV (fosc = 0.290). All the results are validated
with previous results.[6,19] While spectrum of ZnC cluster shows first transition at 1.31eV with fosc =
0.0016 for transition from H→L. The weak transitions
are depicts at 3.37eV (fosc = 0.0039), 4.08eV (fosc = 0.094)
and 7.69eV (fosc = 0.086). Whereas the most prominent
peak occur at 6.15eV with fosc = 0.560 paired with
of optical gap of ZnO and ZnC show increase which is quite different from remaining clusters.
Figure 4. TDDFT photo-absorption spectra of the (ZnO)n with n=2-5 and C-doped ZnO cluster
We visualize the molecular orbital which contribute to the first and most intense electronic excitations. For ZnO, it is clearly seen that the contribution of H and H-1 (doubly degenerate states) which are localized on oxygen atom with ‘p’ character, whereas, the H-5 orbital (Zn-3d) is located on Zn site and the LUMO’s are mainly situated at Zinc atom with ‘sp’ hybridization. It also finds that O-2p, 3d and Zn-sp orbital lies in the same plane. While in ZnC, H and L+5 state are also shows ‘p’ character localized on carbon atom and zinc atom respectively. This indicates that O-2p and C-2p contributes in optical transitions with Zn-3d and Zn-sp orbital.
Now, we discuss optical excitation in ZnnOn and
ZnnOn−1C clusters with n = 2–5 shown in Figure 4. The
calculated excitation energies, oscillator strength for first and most intense are summarized in Table I and II. The absorption spectrum of Zn2O2 and Zn2OC are
shown in Figure 4. It is observed that the first band is optically inactive at 1.28 eV (fosc = 0) and the first
non-vanishing oscillator strength below 8.55eV lies at
1.83eV (fosc = 0.017) for transition from H→L. The
small transitions appears at 2.43eV (fosc = 0.026). The
most prominent peak observed at 8.15eV (fosc = 0.459)
with other peaks at 6.63eV (fosc = 0.251) and 7.65eV
(fosc = 0.313). The transition at 8.15eV occurs to
H-5→L+2 excitation. The Zn2OC shows first transition at
1.27eV with fosc = 0.001 for transition from H→L+1
and small transitions at 4.83eV (fosc = 0.096), 6.66eV
(fosc = 0.099) and 7.01eV (fosc = 0.088). The most
prominent peak appear at 6.09eV (fosc = 0.160) for
transition from H→L+6.
Table 1. Energy of first peak and most intense peak with oscillator strength and transition states for ZnO
clusters
Cluster ETDDFT
(in eV)
Oscillator Strength
Transition
For first transition
ZnO 0.81 0.001 H-1→L
Zn2O2 1.83 0.017 H→L
Zn3O3 3.78 0.074 H-3→L
Zn4O4 4.18 0.061 H-6→L
Zn5O5 4.17 0.067 H-6→L
For most intense transition
ZnO 8.88 0.598 H-5→L
Zn2O2 8.15 0.459 H-5→L+2
Zn3O3 7.95 0.480
H-8→L+11
Zn4O4 8.45 0.431 H-8→L+5
Zn5O5 8.35 0.351
H-10→L+3
The optical spectra of Zn3O3, Zn4O4 and Zn5O5 with
their respective carbon doped clusters are shown in Figure 4. The first transition of ZnnOn and ZnnOn−1C (n
cluster. Introduction of carbon atom in ZnO clusters increases number of peaks in absorption spectra, that means new transition probabilities are introduced.
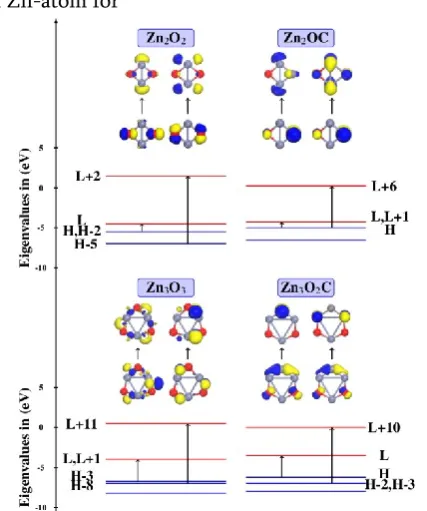
The molecular orbital analysis with eigenvalue spectra represented in Figure 5 and Figure 6. It clearly seen that the contribution of O-2p, Zn-3d and Zn-sp orbital during electronic excitation for ZnnOn (n = 2–
5). The charge distributed around O-atom for HOMO and Zn-atom for
Figure 5. MO of transitions and eigenvalue spectra of the Zn2O2 and Zn3O3 with their respective C-doped
luster
LUMO in ZnnOn clusters. But in ZnnOn−1C clusters,
HOMO shows to ‘p’ character on Zn-atom, while ‘p’ character is shifted on C-atom in LUMO. The carbon doped ZnO MO shows the localized C-2p states overlap well with the O-2p states.
Figure 6. MO of transitions and eigenvalue spectra of the Zn4O4 and Zn5O5 with their respective C-doped
luster
With introduction of carbon, there is a competition between oxygen and carbon for charge transfer from zinc. The molecular orbital analysis of ZnO cluster clearly represents the contribution of O-2p, Zn-3d and Zn-sp orbitals during electronic excitation, while in C-doped ZnO cluster contribution of C-2p is added to excitation.
Table 2. Energy of first peak and most intense peak with oscillator strength and transition states for
C-doped ZnO clusters
Cluster ETDDFT
(in eV)
Oscillator Strength
Transition
For first transition
ZnC 1.31 0.002 H→L
Zn2OC 1.27 0.001 H→L+1
Zn3O2C 2.24 0.004 H-3→L
Zn4O3C 0.70 0.0001 H→L
Zn5O4C 0.70 0.0002 H→L+1
For most intense
ZnC 6.15 0.560 H→L+5
transition Zn
3O2C 6.07 0.099
H-2→L+10
Zn4O3C 8.53 0.463
H-8→L+23
Zn5O4C 9.72 0.352
H-27→L+27
Thus, the optical absorption spectra of ZnnOn clusters
show the electronic excitation in the ultra-violet region except the Zn2O2 cluster. The carbon doping
shifts the excitation towards visible and infrared regions. The introduction of carbon in ZnO clusters, produces significant effect on absorption spectra. The energy range shifted towards the IR region with change in oscillator strength. The doping of C-atom can be useful for tunable optoelectronic devices.
IV.
CONCLUSION
The structural, electronic and optical properties of the ZnO clusters and C-doped ZnO clusters have been calculated in the framework of time dependent density functional theory (TDDFT). To investigate the doped cluster, oxygen atom is replaced by carbon atom from ZnO clusters. The calculations of total binding energy, ionization potential, electron affinity and HOMO-LUMO gaps of the clusters were performed for analyzing structural stability of the clusters. All the calculations show that host clusters are more stable than that of doped clusters. The optical properties of the clusters are calculated within the framework of TDDFT with ALDA as the exchange-correlation function. All the doped clusters exhibited wider ranged absorption spectra with respect to host clusters. The optical gap of C-doped ZnO clusters lies in IR region while optical gap ZnO clusters lies in UV region. Thus optical response of ZnO can be tune by suitable doping elements, make them a promising material for tunable optoelectronic devices.
V.
REFERENCES
[1]. Z. L. Wang. "Zinc oxide nanostructures: growth, properties and applications", Material Today, 7] 23, 2004.
[2]. M. A. Stroscio and M. Dutta, editors. "Biological
Nanostructures and Applications of
Nanostructures in Biology", Kluwer, New York, 2004.
[3]. S. Wu, N. Yuan, H. Xu, X. Wang, and Z. A
Schelly. "Synthesis and bandgap oscillation of uncapped, ZnO clusters by electroporation of vesicles", Nanotechnology, 17] 4713, 2006.
[4]. A. V. Bulgakov, A. B. Evtushenko, Y. G.
Shukhov, I. Ozerov, and W. Marine. "Cluster generation under pulsed laser ablation of zinc oxide", Appl Phys A, 101:585-589, 2010.
[5]. H. J. Chang, C. Z. Lu, Y. Wang, C. Son, S. Kim,
Y. H. Kim, and I. Choi. "Optical Properties of ZnO Nanocrystals Synthesized by Using Sol-gel Method", Journal of the Korean Physical Society, 45] 959-962, 2004.
[6]. B. J. Nagare, S. Chavan, and V. Bambole. "Study of electronic and optical properties of ZnO clusters using TDDFT method", Material Research Express, 4] 106304, 2017.
[7]. Y. Masuda, M. Yamagishi, W. S. Seo, and K.
Koumoto. "Photoluminescence from ZnO Nanoparticles Embedded in an Amorphous Matrix", Crystal Growth and Design, 8] 1503-1508, 2008.
[8]. H. Pan, J. B. Yi, L. Shen, R. Q. Wu, J. H. Yang, J. Y. Lin, Y. P. Feng, J. Ding, L. H. Van, and J. H. Yin. "Room-Temperature Ferromagnetism in Carbon-Doped ZnO", Physics Review Letters, 99] 127201, 2007.
[10]. B. Delley. "Time dependent density functional theory with DMol3", Journal of Physics: Condensed Matter, 22] 384208, 2010.
[11]. B. Delley. "Modern Density Functional Theory: A Tool for Chemistry", volume 2, Elsevier Science, Amsterdam, 1995.
[12]. J. P. Perdew and A. Zunger. "Self-interaction correction to density-functional approximations for many-electron systems", Physical Review B, 23] 5048, 1981.
[13]. J. P. Perdew and W. Yue. "Accurate and simple
density functional for the electronic exchange energy: Generalized gradient approximation", Physical Review B, 33] 8800, 1986.
[14]. B. Delley. "An all-electron numerical method for solving the the local density functional for polyatomic molecules", Journal of Chemical Physics, 92] 508, 1990.
[15]. B. Wang, S. Nagase, J. Zhao, and G. Wang.
"Structural growth sequences and electronic properties of zinc oxide clusters (ZnO)n with (n=2-18). Journal of Physical Chemistry C, 111] 4956-4963, 2007.
[16]. A. A. Al-Sunaidi, A. A. Sokol, C. R. A. Catlow, and S. M. Woodley. "Structures of Zinc oxide nanoclusters: As found by revolutionary algorithm techniques", Journal of Physical Chemistry C, 112] 18860-18875, 2008.
[17]. H. Sharma and R. Singh. "Spin-polarized density functional investigation into ferromagnetism in C-doped (ZnO)n clusters; n = 1-12, 16", Journal of Physics: Condensed Matter, 23] 106004, 2011.
[18]. A. C. Reber, S. N. Khanna, J. S. Hunjan, and M.