R E S E A R C H
Open Access
Partial least squares based gene expression
analysis in renal failure
Shuang Ding, Yinhai Xu, Tingting Hao and Ping Ma
*Abstract
Background:Preventive and therapeutic options for renal failure are still limited. Gene expression profile analysis is powerful in the identification of biological differences between end stage renal failure patients and healthy controls. Previous studies mainly used variance/regression analysis without considering various biological, environmental factors. The purpose of this study is to investigate the gene expression difference between end stage renal failure patients and healthy controls with partial least squares (PLS) based analysis.
Methods:With gene expression data from the Gene Expression Omnibus database, we performed PLS analysis to identify differentially expressed genes. Enrichment and network analyses were also carried out to capture the molecular signatures of renal failure.
Results:We acquired 573 differentially expressed genes. Pathway and Gene Ontology items enrichment analysis revealed over-representation of dysregulated genes in various biological processes. Network analysis identified seven hub genes with degrees higher than 10, includingCAND1,CDK2,TP53,SMURF1,YWHAE,SRSF1, andRELA. Proteins encoded byCDK2,TP53, andRELAhave been associated with the progression of renal failure in previous studies. Conclusions:Our findings shed light on expression character of renal failure patients with the hope to offer potential targets for future therapeutic studies.
Virtual Slides:The virtual slide(s) for this article can be found here: http://www.diagnosticpathology.diagnomx.eu/vs/ 1450799302127207
Keywords:Renal failure, Partial least squares, Gene expression, Network
Background
Renal failure refers to the medical condition that kidneys fail to adequately filter waste products from blood. It is usually not reversible and patients with end stage renal failure have to be treated with long term dialysis or organ transplant [1,2]. Preventive and therapeutic options for this disease are still limited [3]. Capture the gene expression signature of end stage renal failure patients may enhance the development of novel therapeutic strategies.
High throughput microarray analysis is powerful to characterize the underlying pathogenesis of various diseases. Several studies have investigated the gene expression difference between renal failure patients and controls using this strategy [4-6]. These studies generally carried out variance or regression analysis to
detect dysregulated genes. This statistical procedure ignored unaccounted array specific factors, including various biological, environmental factors. Previous studies [7,8] have suggested that partial least squares (PLS) based expression profile analysis is efficient in dealing with large amount of genes and fairly small samples. Compared with variance and regression analysis, PLS based analysis is more sensitive while maintaining reasonable high specificity, small false discovery rate and false non-discovery rate. Previous study using PLS analysis on other complex disease such as breast cancer has proved its feasibility [9]. Therefore, capturing the gene expression signature in renal failure patients by using PLS based analysis may provide new understanding of the pathogenesis and offer potential therapeutic targets.
In the current study, to investigate the gene expression difference between end stage renal failure patients and healthy controls, we performed PLS-based analysis by * Correspondence:[email protected]
Department of medical laboratory, The affiliated hospital of Xuzhou Medical College, No.99 Huaihaixi Road, Xuzhou 221000, China
using gene expression data from the gene expression omnibus (GEO) database. Pathways or Gene Ontology items significantly over-represented with dysregulated genes were also acquired by using enrichment analysis. In addition, we constructed a protein-protein interaction (PPI) network with the proteins encoded by dysregulated genes to identify hub genes that may be related with disease progression.
Methods
Microarray data
The whole data set of gene expression profile GSE37171 from the GEO database was downloaded. This series represents transcription profile of 63 end-stage renal failure patients and 20 healthy controls. All samples were taken from peripheral blood. The dataset was based on the GPL570 platform ([HG-U133_Plus_2] Affymetrix Human Genome U133 Plus 2.0 Array). This study is approved by the institutional review board of the affiliated hospital of Xuzhou medical college (NO. 131081).
Identification of differentially expressed genes
Normalization of raw intensity values was performed by using Robust Multi-array Analysis (RMA) [10]. The resulting log2-transformed expression value of each probe was used in subsequent analysis. A multivariate linear model was used to describe the relationship between gene expression values and the disease status. For each sample, the model is expressed as:
y¼Xp i¼1
αixiþb ð1Þ
where y is the binary variable of disease status, 0 coded as control and 1 coded as renal failure; p is the total number of genes in the array. PLS analysis was then carried out to estimate the effects of each gene. The main purpose of PLS regression was to build orthogonal components (called‘latent variables’here). It is:
COV tðk;uk→maxÞ ð2Þ
Subject to tk k ¼k 1 and k k ¼uk 1 ð3Þ
where tk is the kth latent variable decomposes from all individuals’genes expression dataX(the matrix ofn×p,n refers to the number of individuals and p refers to the number of genes),ukis thekth latent variable decomposes from the phenotype data Y (n ×1) [11]. The non-linear iterative partial least squares (NIPALS) algorithm [12] was used to calculate the PLS latent variables derived from the expression profile on the target trait, as follows:
1) Randomly initializeu0=Y
2)w = XTu0, w = w/||w|| 3)t = Xw
4) c = YTt, c = c/||c|| 5) u = Yc
6) ifu-u0< 10E-8, go to step 7), elseu0=u,
repeat step 2)-5) 7) X=X-ttTX,Y=Y-ttTY
Then go back to 2) to calculate the next latent variable. To evaluate the importance of the expressed genes on disease, the statistics of variable importance on the projection (VIP) [13] was calculated as:
VIPj¼
ffiffiffiffiffiffiffiffiffiffiffiffiffiffiffiffiffiffiffiffiffiffiffiffiffiffiffiffiffiffiffiffiffiffiffiffiffiffiffiffiffiffiffiffi pXhk¼1Cor2 Y;t
k ð Þw2
kj Xh
k¼1Cor 2 Y;t
k
ð Þ
v u u u
t ð4Þ
where, the Cor operator is the Pearson correlation coefficient, and for each wk, it should be normalized by dividing‖wk‖, andhis the number of latent variables used in the model.
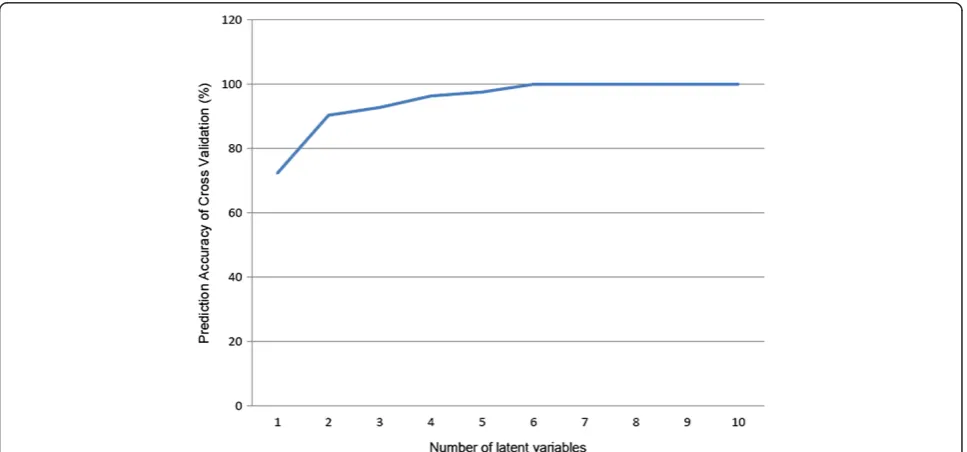
To avoid the model over fitting, the best number of latent variables (habove) was determined by the prediction accuracy based on three folds cross validation. TheVIPfor each gene was then calculated with thehlatent variables to obtain genes associated with renal failure. In addition, the false discovered rate (FDR) procedures were used to control the expected proportion of incorrectly rejected null hypotheses. The permutation procedure (N =10000 times) was used to obtain the empirical distribution of PLS-basedVIPin each replicate. The FDR for each gene was then calculated as:
FDRi¼
X10000 j
Xp
iBool VIPi;j>VIPi
=ð10000pÞ ð5Þ
where Bool represents the logical value of expression:
“True”codes as 1 and“False”codes as 0. Significant genes were selected with a threshold of FDR < 0.01.
Enrichment analysis
Annotation of all probes was carried out by using the simple omnibus format in text (SOFT) files. To capture biologically relevant character of differentially expressed genes, enrichment analysis was implemented. All genes were firstly mapped to the Kyoto Encyclopedia of Genes and Genomes (KEGG) pathways (http://www.genome.jp/ kegg/) [14] and Gene Ontology database [15]. Biological processes significantly overrepresented with differentially expressed genes were identified by using the hyper geometric distribution test.
Network analysis
expressed genes, those with more interactions with other proteins may play more important roles in the progression of renal failure. To visualize the interaction among these proteins and identify key molecules, a network was constructed by using the software Cytoscape (V 2.8.3, http://www.cytoscape.org/) [17]. The database (http:// ftp.ncbi.nlm.nih.gov/gene/GeneRIF/) of NCBI was used to get the interaction information of all proteins. For each protein, the number of links (interactions) was defined as its degree. Proteins with degrees over 10 were selected as hub molecules in this study.
Results
According to the prediction accuracy based on cross validation, six latent variables were used in the detection of differentially expressed genes (Figure 1). The results revealed that 573 genes were differentially expressed between end-stage renal failure patients and healthy controls, including 141 downregulated genes in patients and 432 upregulated ones. For all genes in the array, 6084 genes were mapped to various pathways, including 203 differentially expressed genes. The pathways enriched with differentially expressed genes are listed in Table 1. These pathways are involved in several systems, including nervous system, digestive system, and endocrine system. In addition, three cancer pathways, transcriptional misre-gulation in cancers (hsa05202), chronic myeloid leukemia (hsa05220) and small cell lung cancer (hsa05222) were also enriched with differentially expressed genes. A total of 16517 genes in the array were annotated based on the GO database, including 518 differentially expressed genes.
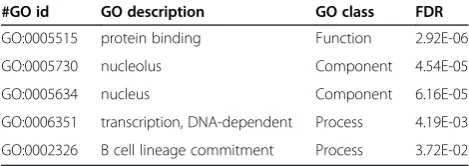
Table 2 represents the five GO items enriched with selected genes. Protein binding (GO: 0005515) was the most significant GO item with over represented selected genes. In consistent with the pathway analysis, a transcrip-tion related GO item: transcriptranscrip-tion, DNA-dependent (GO: 0006351) was also identified to be overrepresented with dysregulated genes.
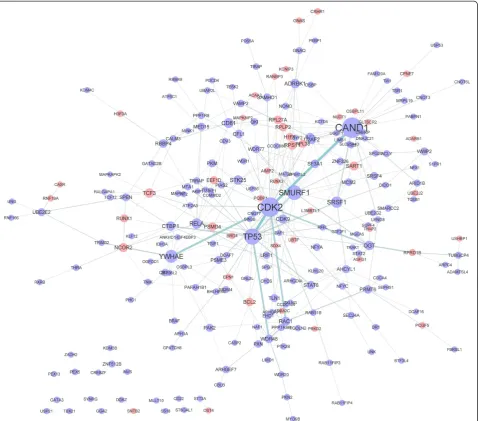
Figure 2 illustrates the interaction network of proteins encoded by differentially expressed genes. Seven proteins, CAND1, CDK2, TP53, SMURF1, YWHAE, SRSF1, and RELA were identified to be hub molecules, with degrees of 31, 29, 22, 19, 15, 12, and 10 respectively.
Discussion
Renal failure is a complex medical condition which may result from kidney injury or chronic diseases [18,19]. Microarray is a powerful technology for investigating the gene expression difference between end-stage renal failure patients and healthy controls. However, it is challenging to develop a suitable statistical model to deal with the small sample number and fairly large amount of genes. Previous studies on renal failure mainly used variance or regression analysis, without considering unaccounted array specific factors. Here we used PLS based analysis to identify dysregulated genes in end-stage renal failure patients.
Pathway enrichment analysis revealed that overrep-resentation of dysregulated genes in various systems. Dysfunction of various systems may be complications of renal failure since kidneys are essential in the maintenance of homeostatic status. In addition, we also detected cancer-related pathways and GO items to be enriched
with differentially expressed genes. The correlation between renal failure and cancer related biological processes may due to the dysfunction of cell cycle and DNA repair process in patients. Previous studies have demonstrated the enhanced expression of DNA repair-related proteins and induced cell cycle arrest at G1/S and G2/M in renal failure rats [20-22]. Overrepre-sentation of dysregulated genes in the chronic myeloid leukemia (hsa05220) pathway revealed the similar gene expression of these two diseases which may explain the causative effect of lymphocytic leukemia on renal failure [19]. These identified biological processes revealed the molecular signatures of renal failure.
To detect hub molecules, we constructed a network with proteins encoded by identified differentially expressed genes (Figure 2). Several hub molecules have been identified to play important roles in the progression of renal failure before. Take RELA for example, protein encoded by this gene is NF-kappaB p65. In consistent with our results, detection of NF-kappaB p65 based on immunohistochemi-cal staining and ELISA suggested that NF-kappaB p65 in rat glomeruli of multiple organ failure was significantly higher than that of control group [23]. Attenuation of NF-kappaB p65 activation is effective in reducing endotoxic kidney injury [24]. Inhibition of inflammation through NF-κB also reduced renal dysfunction caused by sepsis in mice [25]. The involvement of NF-kappaB p65 in renal
failure may be due to its interaction with inflammatory chemokines [26], such as CXCL16, which was increased in active nephrotic syndrome patients and correlated with blood lipids, urine protein and inflammation responses [27]. Genes involved in regulation of cell cycle, TP53 and CDK2, were also identified as hub genes. Their involvements in renal failure through regulation of G1 cell cycle arrest were reported before [28]. Moreover, paricalcitol could prevent cisplatin-induced renal injury by suppressing the up regulation of TP53 and CDK2 [29]. Therefore, our study confirmed that these three genes may serve as potential targets for renal failure treatments. For the rest four hub genes, SRSF1, CAND1, SMURF1, andYWHAE, no previous report of their association with renal failure has been proposed before. Protein encoded bySRSF1is a member of the arginine/serine-rich splicing factor protein family. Up regulation of SRSF1 could increases the cellular pool of active p53 [30], suggesting the implication of SRSF1 in renal failure through its regula-tion of the p53. ForSMURF1, protein encoded by this gene is an ubiquitin ligase that is specific for receptor-regulated SMAD proteins. It is reported that reduction of Smad7 due to the overexpression of Smurf1 in unilateral ureteral obstruction kidneys plays an important role in the progres-sion of tubulointerstitial fibrosis [31], which a harmful process leading inevitably to renal function deterioration. Consistently, our analysis detected the up regulation of
SMURF1, suggesting it may contribute to the progression of renal failure through its ubiquitination of SMAD7.
Protein encoded by YWHAE belongs to the 14-3-3
family of proteins which mediate signal transduction by binding to phosphoserine-containing proteins. Quantitative protein expression profiling revealed that overexpression of YWHAE prompt the proliferation of renal cancer cells [32]. CAND1 may also promote the progression of renal cell carcinoma through its interaction with carbonic anhydrase IX [33]. Whether the up regulation contributes Table 1 Pathways enriched with differentially expressed gene
KEGG id Pathway description Pathway class P-value
hsa04722 Neurotrophin signaling pathway Nervous system 2.09E-03
hsa05202 Transcriptional misregulation in cancers Cancers 5.20E-03
hsa04120 Ubiquitin mediated proteolysis Folding, sorting and degradation 5.22E-03
hsa05220 Chronic myeloid leukemia Cancers 1.05E-02
hsa05222 Small cell lung cancer Cancers 2.28E-02
hsa05010 Alzheimer's disease Neurodegenerative diseases 2.43E-02
hsa04970 Salivary secretion Digestive system 2.85E-02
hsa04130 SNARE interactions in vesicular transport Folding, sorting and degradation 3.08E-02
hsa04912 GnRH signaling pathway Endocrine system 3.17E-02
hsa04972 Pancreatic secretion Digestive system 3.87E-02
hsa05100 Bacterial invasion of epithelial cells Infectious diseases 4.05E-02
hsa04730 Long-term depression Nervous system 4.60E-02
Table 2 GO items enriched with differentially expressed gene
#GO id GO description GO class FDR
GO:0005515 protein binding Function 2.92E-06
GO:0005730 nucleolus Component 4.54E-05
GO:0005634 nucleus Component 6.16E-05
GO:0006351 transcription, DNA-dependent Process 4.19E-03
to the pathogenesis of renal failure needs further investigation.
Conclusions
In summary, with gene expression profile downloaded from the GEO database, we carried out PLS based analysis to identify differentially expressed genes in end-stage renal failure patients and healthy controls. Path-way and GO enrichment analyses were also implemented to capture biological relevant characters. A network of proteins encoded by differentially expressed genes was constructed to identify key molecules. Our results facilitate the disclos-ure of the molecular mechanism underlying renal faildisclos-ure progression.
Consent
Written informed consent was obtained from the patients for the publication of this report and any accompanying images.
Competing interest
The authors declare that they have no competing interests.
Authors’contributions
PM designed the research and revised the manuscript. SD drafted the manuscript. SD, YX and TH carried out data analysis. All authors read and approved the final manuscript.
Received: 17 April 2014 Accepted: 25 June 2014 Published: 5 July 2014
Reference
1. Gross P, Schirutschke H, Barnett K:Should we prescribe blood pressure lowering drugs to every patient with advanced chronic kidney disease? A comment on two recent meta-analyses.Pol Arch Med Wewn2009, 119:644–647.
2. Remuzzi G, Benigni A, Finkelstein FO, Grunfeld JP, Joly D, Katz I, Liu ZH, Miyata T, Perico N, Rodriguez-Iturbe B, Antiga L, Schaefer F, Schieppati A, Schrier RW, Tonelli M:Kidney failure: aims for the next 10 years and barriers to success.Lancet2013,382:353–362.
3. Lameire NH, Bagga A, Cruz D, De Maeseneer J, Endre Z, Kellum JA, Liu KD, Mehta RL, Pannu N, Van Biesen W, Vanholder R:Acute kidney injury: an increasing global concern.Lancet2013,382:170–179.
4. Guebre-Egziabher F, Debard C, Drai J, Denis L, Pesenti S, Bienvenu J, Vidal H, Laville M, Fouque D:Differential dose effect of fish oil on inflammation and adipose tissue gene expression in chronic kidney disease patients.
Nutrition2013,29:730–736.
5. Zaza G, Granata S, Rascio F, Pontrelli P, Dell'Oglio MP, Cox SN, Pertosa G, Grandaliano G, Lupo A:A specific immune transcriptomic profile discriminates chronic kidney disease patients in predialysis from hemodialyzed patients.BMC Med Genet2013,6:17.
6. Sun Y, Ding W, Wei Q, Shen Z, Wang C:Dysregulated gene expression of extracellular matrix and adhesion molecules in saphenous vein conduits of hemodialysis patients.J Thorac Cardiovasc Surg2012,144:684–689. 7. Chakraborty S, Datta S, Datta S:Surrogate variable analysis using partial
least squares (SVA-PLS) in gene expression studies.Bioinformatics2012, 28:799–806.
8. Ji G, Yang Z, You W:PLS-based gene selection and identification of tumor-specific genes.Ieee Trans Syst Man Cybern-Part C: Appl Rev2011, 41:830–841.
9. Gao QG, Li ZM, Wu KQ:Partial least squares based analysis of pathways in recurrent breast cancer.Eur Rev Med Pharmacol Sci2013,17:2159–2165. 10. Irizarry RA, Hobbs B, Collin F, Beazer-Barclay YD, Antonellis KJ, Scherf U,
Speed TP:Exploration, normalization, and summaries of high density oligonucleotide array probe level data.Biostatistics2003,4:249–264. 11. Barker M, Rayens W:Partial least squares for discrimination.J Chemometr
2003,17:166–173.
12. Martins JPA, Teofilo RF, Ferreira MMC:Computational performance and cross-validation error precision of five PLS algorithms using designed and real data sets.J Chemometr2010,24:320–332.
13. Gosselin R, Rodrigue D, Duchesne C:A Bootstrap-VIP approach for selecting wavelength intervals in spectral imaging applications.Chemometr Intell Lab Syst2010,100:12–21.
14. Kanehisa M, Goto S:KEGG: kyoto encyclopedia of genes and genomes.
Nucleic Acids Res2000,28:27–30.
15. Ashburner M, Ball CA, Blake JA, Botstein D, Butler H, Cherry JM, Davis AP, Dolinski K, Dwight SS, Eppig JT, Harris MA, Hill DP, Issel-Tarver L, Kasarskis A, Lewis S, Matese JC, Richardson JE, Ringwald M, Rubin GM, Sherlock G:Gene ontology: tool for the unification of biology. The Gene Ontology Consortium.Nat Gen2000,25:25–29.
16. Stelzl U, Worm U, Lalowski M, Haenig C, Brembeck FH, Goehler H, Stroedicke M, Zenkner M, Schoenherr A, Koeppen S, Timm J, Mintzlaff S, Abraham C, Bock N, Kietzmann S, Goedde A, Toksöz E, Droege A, Krobitsch S, Korn B, Birchmeier W, Lehrach H, Wanker EE:A human protein-protein interaction network: a resource for annotating the proteome.Cell2005, 122:957–968.
17. Shannon P, Markiel A, Ozier O, Baliga NS, Wang JT, Ramage D, Amin N, Schwikowski B, Ideker T:Cytoscape: a software environment for integrated models of biomolecular interaction networks.Genome Res 2003,13:2498–2504.
18. Ferreira RD, Custodio FB, Guimaraes CS, Correa RR, Reis MA: Collagenofibrotic glomerulopathy: three case reports in Brazil.
Diagn Pathol2009,4:33.
19. Dou X, Hu H, Ju Y, Liu Y, Kang K, Zhou S, Chen W:Concurrent nephrotic syndrome and acute renal failure caused by chronic lymphocytic leukemia (CLL): a case report and literature review.Diagn Pathol2011,6:99. 20. Zhou H, Kato A, Yasuda H, Miyaji T, Fujigaki Y, Yamamoto T, Yonemura K,
Hishida A:The induction of cell cycle regulatory and DNA repair proteins in cisplatin-induced acute renal failure.Toxicol Appl Pharmacol2004, 200:111–120.
21. Price PM, Megyesi J, Saf Irstein RL:Cell cycle regulation: repair and regeneration in acute renal failure.Kidney Int2004,66:509–514.
22. Nishihara K, Masuda S, Nakagawa S, Yonezawa A, Ichimura T, Bonventre JV, Inui K:Impact of Cyclin B2 and Cell division cycle 2 on tubular hyperplasia in progressive chronic renal failure rats.Am J Physiol Renal Physiol2010, 298:F923–F934.
23. Chen XM, Du XG:[Relationship between glomerular lesion and NF-kappaB p65 activity in rat multiple organ failure caused by zymosan].Xi Bao Yu Fen Zi Mian Yi Xue Za Zhi2005,21:486–488. 492.
24. Meyer-Schwesinger C, Dehde S, von Ruffer C, Gatzemeier S, Klug P, Wenzel UO, Stahl RA, Thaiss F, Meyer TN:Rho kinase inhibition attenuates LPS-induced renal failure in mice in part by attenuation of NF-kappaB p65 signaling.Am J Physiol Renal Physiol2009,296:F1088–F1099.
25. Coldewey SM, Rogazzo M, Collino M, Patel NS, Thiemermann C:Inhibition of IkappaB kinase reduces the multiple organ dysfunction caused by sepsis in the mouse.Dis Model Mech2013,6:1031–1042.
26. Lotzer K, Dopping S, Connert S, Grabner R, Spanbroek R, Lemser B, Beer M, Hildner M, Hehlgans T, van der Wall M, Mebius RE, Lovas A, Randolph GJ, Weih F, Habenicht AJ:Mouse aorta smooth muscle cells differentiate into lymphoid tissue organizer-like cells on combined tumor necrosis factor receptor-1/lymphotoxin beta-receptor NF-kappaB signaling.
Arterioscler Thromb Vasc Biol2010,30:395–402.
27. Zhen J, Li Q, Zhu Y, Yao X, Wang L, Zhou A, Sun S:Increased serum CXCL16 is highly correlated with blood lipids, urine protein and immune reaction in children with active nephrotic syndrome.Diagn Pathol2014, 9:23.
28. Yang QH, Liu DW, Long Y, Liu HZ, Chai WZ, Wang XT:Acute renal failure during sepsis: potential role of cell cycle regulation.J Infect2009, 58:459–464.
29. Park JW, Cho JW, Joo SY, Kim CS, Choi JS, Bae EH, Ma SK, Kim SH, Lee J, Kim SW:Paricalcitol prevents cisplatin-induced renal injury by suppressing apoptosis and proliferation.Eur J Pharmacol2012,683:301–309.
30. Fregoso OI, Das S, Akerman M, Krainer AR:Splicing-factor oncoprotein SRSF1 stabilizes p53 via RPL5 and induces cellular senescence.Mol Cell 2013,50:56–66.
31. Fukasawa H, Yamamoto T, Togawa A, Ohashi N, Fujigaki Y, Oda T, Uchida C, Kitagawa K, Hattori T, Suzuki S, Kitagawa M, Hishida A:Down-regulation of Smad7 expression by ubiquitin-dependent degradation contributes to renal fibrosis in obstructive nephropathy in mice.Proc Natl Acad Sci U S A 2004,101:8687–8692.
32. Liang S, Xu Y, Shen G, Liu Q, Zhao X, Xu Z, Xie X, Gong F, Li R, Wei Y: Quantitative protein expression profiling of 14-3-3 isoforms in human renal carcinoma shows 14-3-3 epsilon is involved in limitedly increasing renal cell proliferation.Electrophoresis2009,30:4152–4162.
33. Buanne P, Renzone G, Monteleone F, Vitale M, Monti SM, Sandomenico A, Garbi C, Montanaro D, Accardo M, Troncone G, Zatovicova M, Csaderova L, Supuran CT, Pastorekova S, Scaloni A, De Simone G, Zambrano N: Characterization of carbonic anhydrase IX interactome reveals proteins assisting its nuclear localization in hypoxic cells.J Proteome Res2013, 12:282–292.
doi:10.1186/1746-1596-9-137
Cite this article as:Dinget al.:Partial least squares based gene expression analysis in renal failure.Diagnostic Pathology20149:137.
Submit your next manuscript to BioMed Central and take full advantage of:
• Convenient online submission
• Thorough peer review
• No space constraints or color figure charges
• Immediate publication on acceptance
• Inclusion in PubMed, CAS, Scopus and Google Scholar
• Research which is freely available for redistribution