A BIOCHEMICAL AND BEHAVIOURAL STUDY OF THE
TOXIC EFFECTS OF 3-NITROPROPIONIC ACID AND
METHAMPHETAMINE IN THE RAT.
Oweikumo Lambert Eradiri
B.Pharm. (Hons.), MPSN.
The School of Pharmacy, University of London,
29/39, Brunswick Square,
London W C IN lAX.
A thesis submitted in partial fiilfilment of the requirements of the Faculty of
Medicine, University of London, for the award of the degree of Doctor of
Philosophy.
ProQuest Number: 10104902
All rights reserved
INFORMATION TO ALL USERS
The quality of this reproduction is dependent upon the quality of the copy submitted. In the unlikely event that the author did not send a complete manuscript and there are missing pages, these will be noted. Also, if material had to be removed,
a note will indicate the deletion.
uest.
ProQuest 10104902
Published by ProQuest LLC(2016). Copyright of the Dissertation is held by the Author. All rights reserved.
This work is protected against unauthorized copying under Title 17, United States Code. Microform Edition © ProQuest LLC.
ProQuest LLC
789 East Eisenhower Parkway P.O. Box 1346
Abstract
The effective treatment of Parkinson’s disease (PD) has been hindered by a variety of factors including the lack of a precise understanding of the aetiology of the disease, as well as the loss of efficacy of the mainstay therapeutic agent, L-3,4 dihydroxyphenylalanine (L-DOPA). This work was embarked upon with the aim of producing parkinsonian conditions in a rat by harnessing various theories proposed for the aetiology of the disorder. In addition, it was intended to take a closer look at the mechanism(s) of action of L-DOPA, to determine if there are additional ways of enhancing and prolonging its effectiveness.
An over-view of the theories put forward for the cause and progression of PD reveals two schools of thought: Metabolic Stress and Oxidative Stress. While these groups of factors are independent in their own rights, they are oAen cyclical and inter-related. The Metabolic Stress theories suggest that PD is a consequence of an acquired or inherent metabolic defect that triggers off a variety o f reactions that ultimately lead to neuron death. Proponents of the Oxidative Stress theories tend to suggest that ah internal or external trigger factor impinges on and overwhelms the body’s anti-oxidative mechanisms, causing metabolic failure and,
ultimately, cell death. However, the specific reason(s) why the dopaminergic cell bodies of the substantia nigra pars compacta (SNpc) begin to die in PD patients remain(s) cryptic.
Methamphetamine (METH), a common drug o f abuse, has been shown to induce the release of dopamine and glutamate in the basal ganglia. Its ability to reverse the dopamine (DA) transporter localises its effects to catecholaminergic neurones, while its glutamate-releasing characteristic gives it an excitotoxic potential. 3-nitropropionic acid (3-NP) is a food contaminant commonly found in mildewed sugar-cane. Its ability to inhibit succinate
The mutual potentiation of 3-NP and METH exploited in this regimen (which we have termed the 3-NPM model), yielded animals with alterations in tissue levels o f DA and 5-
hydroxytryptamine (5-HT), but not those of aspartate and glutamate in the nucleus accumbens
septi (NAcc), prefrontal cortex (PFC), substantia nigra (SN) and the corpus striatum (ST). The activity of the enzyme L-DOPA decarboxylase (DDC) was not significantly altered in the four brain regions analysed, whereas the enzyme 5-hydroxytryptophan decarboxylase
(5-HTPDC) was significantly reduced in the nigrostriatal tract. The results suggest that 3-NPM treatment compromises nigrostriatal dopamine function in a way that could mimic the preclinical stages of parkinsonism.
The spontaneous motility of 3-NPM-treated rats did not differ significantly from unlesioned animals, but they exhibited an enhanced sensitivity to the motor stimulant effects o f direct and indirect DA agonists. There was an enhanced response to the D^ agonist RU 24213, but not to the Dj agonist, SKF 38393. A biphasic response to the D^/D^ agonist, apomorphine was observed, while the indirect DA receptor agonist, MK 801, significantly enhanced and prolonged locomotor activity in these rats.
Administration o f L-DOPA in conjunction with the peripheral aromatic 1-amino acid decarboxylase (AADC) inhibitor, benserazide, has been the mainstay of PD therapy. It was
possible to render a threshold dose of L-DOPA (for reversing rigidity in reserpinised rats, 100 mg/kg) effective by combining it with the antiparkinson drug budipine. This drug has been shown to raise DA levels by stimulating AADC. Addition o f the central AADC inhibitor, NSD 1015, to this combination fiirther enhanced the locomotor stimulating effects o f L-DOPA.
This indication of a DA-independent role for L-DOPA was found to be D2 rather than D^
sensitive, in the three animal paradigms used. Furthermore, NSD 1015 was shown to reverse
This work suggests the use of the 3-NPM model as a paradigm for the early stages of PD, and emphasizes the importance of the D2 receptor pathways in the treatment o f the disease. In
Publications
Biggs, e s , Fisher, A., Eradiri, O. and Starr, M.S. (1999) Lack of correlation between neurochemical changes and motor activity following L-Dopa administration to rats with drug- induced parkinsonism. J. Pharm. Pharmacol., 51 (Suppl.); 19.
Eradiri, O.L. and Starr, M.S. (1999) Striatal dopamine depletion and behavioural sensitization
induced by methamphetamine and 3-nitropropionic acid. Eur. J. Pharmacol. 386: 217-226.
Fisher, A., Biggs, C.S., Eradiri, O. and Starr, M.S. (2000) Dual effects of L-3,4-
Acknowledgement
I would like to express my profound gratitude to my supervisor, Professor Michael Starr, for his excellent guidance, optimism and generosity during this work. His fatherly counsel, boundless wisdom and ready availability ensured that this research was completed within the stipulated time frame.
I also would like to thank the Committee of Vice Chancellors and Principals of United Kingdom Universities, for their financial support of this work through an Overseas Research Student Scholarship.
I am grateful to my colleagues Drs Simi Kaur, Andy Fisher, Chris Biggs, Faddy Sadideen, and others, for their comprehensive induction programme, as well as their willingness to help in times o f crises. I am appreciative of the invaluable help offered by Steve Coppard, Donna and Dave, who ensured a constant supply and maintenance o f the animals used in this study.
I cannot forget the encouragement and prayer support provided by my friends, and the brethren, especially Pastors Enoch Adeboye, Bola Olurotimi, Chris Gbenle, Daniel Akhazemea, Tony Peters, Torty Onoh, Gbile Akanni and Joel Adeleke.
Words are not sufficient to express my appreciation, love and indebtedness to my wife
Chienyeze, my son Wengiditie, my parents Sir (Dr.) Lambert and Lady Eradiri, Professor and Mrs. James Egere, as well as my siblings Binaebi, Douifie, Chimsom, Akwaugo, Suokoro,
Ebiekure, Ihunnaya, Onyema, Asabatie, Erepamo and Tutiemo, for their vision, sacrifice and immeasurable contribution to my soundness o f mind in the course o f conducting this research.
May God also remember the invaluable inputs of my uncles, Okpo, Ukiebo and Panebi, as well as my cousins Gbala, Zinake, Kuiaka and Patani.
Finally, I am totally indebted to the Lord God Almighty, whose breath in my nostrils, wisdom in my mind, strength in my hands and boundless provision initiated and completed this
Table of Contents Page
Title 1
Abstract 2
Publications 5
Acknowledgement 6
Table of Contents 7
List of figures 16
List of tables 22
Abbreviations 24
CHAPTER ONE - GENERAL INTRODUCTION 26
1.1 The aetiology of Parkinson’s disease 27
1.2 The neurochemistry of PD 28
1.2.1 Dopamine in PD 30
1.2.2 5-H TinPD 31
1.2.3 Noradrenaline in PD 31
1.2.4 Acetylcholine in PD 32
1.2.5 Gamma-aminobutyric acid in PD 32
1.2.6 Glutamate in PD 33
1.2.7 Neuropeptides in PD 33
1.3 Dopamine receptors and PD 33
1.3.1 D 1 -like dopamine receptors 3 4
1.3.2 D2-like dopamine receptors 34
1.4 Glutamate receptors and PD 35
1.4.1 Metabotropic glutamate receptors 3 5
1.4.2 lonotropic glutamate receptors 36
1.4.2.1 AMPA receptors 36
1.5 Dopamine/Glutamate interactions in the treatment o f PD 37
1.6 Regulation of AADC by DA and glutamate 39
1.7 Models of PD 41
1.7.1 Cholinergic agonists 41
1.7.2 Neuronal lesions 42
1.7.2.1 6-hydroxydopamine lesions 42
1.7.2.2 MPTP lesions 43
1.7.3 Monoamine depleters 45
1.8 Methamphetamine as a model of PD 45
1.8.1 Toxic effects of METH 46
1.8.2 Behavioural effects of METH 47
1.8.3 Mechanisms of METH toxicity 47
1.8.4 Dosing schedules with METH 50
1.8.4.1 METH and DSP-4 52
1.8.4.2 METH and 3-NP 52
1.9 Mechanisms of nigral cell death in PD 54
1.9.1 Metabolic Stress 54
1.9.2 Oxidative Stress 56
CH APTER TW O - MATERIALS AND METHODS 59
2.1 Animals 60
2.2 Induction o f parkinsonism 60
2.2.1 Preliminary experiments 60
2.2.2 Model experiments 62
2.3 Behavioural experiments 63
2.3.1 Control rats 63
2.3.2 3-NPM-treated rats 64
2.3.3 Drugs used in behaviour experiments 64
2.3.3.1 D-amphetamine 64
2.3.3.2 AMPT 64
2.3.3.4 Benserazide 65
2.3.3.5 Budipine 65
2.3.3 6 L-DOPA 65
2 3.3.1 L-DOPA methyl ester 65
2.3.3.8 MK801 65
2.3 3.9 NSD 1015 65
2.3.3.10 RU 24213 66
2.3.3.11 SCH 23390 66
2.3.3.12 SKF 38393 66
2.3.3.13 (+) Sulpiride 66
2.4 Neurochemistry 66
2.4.1 Tissue levels o f catecholamine 66
2.4.2 AADC enzyme assay 67
2.4.3 HPLC analysis 68
2.4.3.1 Analysis o f catecholamines 68
2.4.3.2 Analysis of excitatory amino acids 68
2.4.4 Protein assay 69
2.5 Statistical analysis 70
RESULTS AND DISCUSSION
CHAPTER THREE - NEUROCHEMICAL BASIS OF THE 3-NPM MODEL 71
3.1 Introduction 72
3.2 Results 73
3.2.1 Preliminary investigations 73
3.2.1.1 Effects o f METH on tissue DA levels 74
3.2.1.2 Effects of different combinations of 3-NP and METH on tissue DA levels 75 3.2.1.3 Effects o f different combinations of 3-NP and METH on tissue 5-HT levels 77
3 .2.1.4 Locomotor response to a challenge with apomorphine 80
3.2.1.5 Indications from the preliminary studies 81
3.2.2.1 Differential effects of 3-NPM and 3-NP3M on tissue DA levels in the
mesolimbic system 83
3.2.2.2 Differential effects of 3-NPM and 3-NP3M on tissue DA levels in the
nigrostriatal system 83
3.2.2.3 Comparative effects of 3-NPM and 3-NP3M on tissue 5-HT levels in the
meolimbic system 84
3.2.2.4 Comparative effects of 3-NPM and 3-NP3M on tissue 5-HT levels in the
nigrostriatal system 85
3.2.2.5 Differential effects of 3-NPM and 3-NP3M on DDC activity in the
mesolimbic system 86
3.2.2.6 Differential effects of 3-NPM and 3-NP3M on DDC activity in the
nigrostriatal system 86
3.2.2.7 Differential effects of 3-NPM and 3-NP3M on 5-HTPDC activity in the
mesolimbic system 88
3.2.2.8 Differential effects of 3-NPM and 3-NP3M on 5-HTPDC activity in the
nigrostriatal system 88
3.2.2.9 Comparative effects of 3-NPM and 3-NP3M on tissue levels o f aspartate in the
mesolimbic system 89
3.2.2.10 Comparative effects of 3-NPM and 3-NP3M on tissue levels of aspartate in the
nigrostriatal system 89
3.2.2.11 Differential effects of 3-NPM and 3-NP3M on tissue glutamate levels in the
nigrostriatal system 91
3.2.3 Toxicity profile of the toxins 91
3.2.3.1 Toxic outcomes with 3-NP 92
3.2.3.2 Toxic effects of METH 92
3.2.3.3 Toxicity with 3-NPM 93
3.2.3.4 Effects of 3-NP and METH on body weight 94
CH A PTER FOUR - PROGRESSIVE NEUROCHEM ICAL CHANGES W ITH 3-NPM
AND THE EFFECTS OF BOLUS M ETAM PHETAM INE DOSING 99
4.1 Introduction 100
4.2 Results 100
4.2.1 Time-dependent changes in 3-NPM-induced toxicity 100
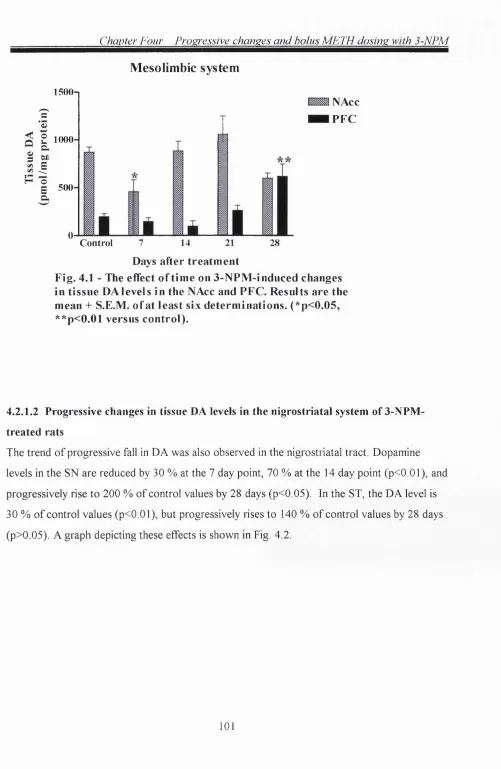
4.2.1.1 Progressive changes in tissue DA levels in the mesolimbic system o f 3-NPM-
treated rats 100
4.2.1.2 Progressive changes in tissue DA levels in the nigrostriatal system of 3-NPM-
treated rats 101
4.2.1.3 Progressive changes in tissue 5-HT levels in the mesolimbic system of 3-NPM-
treated rats 102
4.2.1.4 Progressive changes in tissue 5-HT levels in the nigrostriatal system of 3-NPM-
treated rats 102
4.2.1.5 Progressive changes in DDC activity in the mesolimbic system o f
3-NPM-treated rats 104
4.2.1.6 Progressive changes in DDC activity in the nigrostriatal system o f
3-NPM-treated rats 104
4.2.1.7 Progressive changes in 5-HTPDC activity in the mesolimbic system of 3-NPM-
treated rats 105
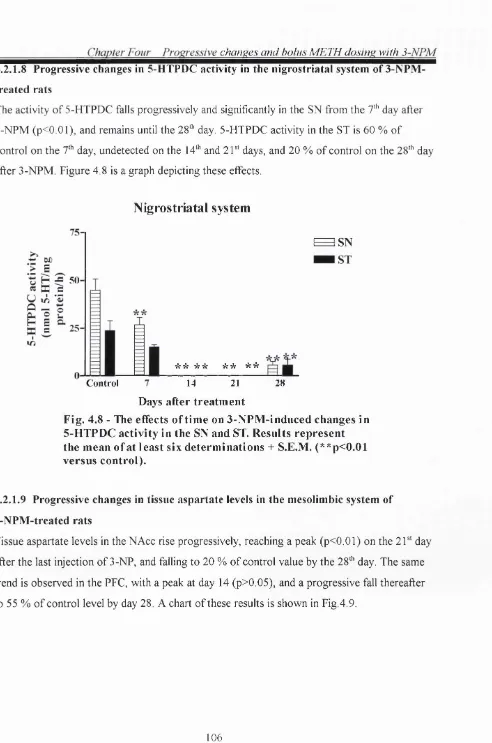
4.2.1.8 Progressive changes in 5-HTPDC activity in the nigrostriatal system o f 3-NPM-
treated rats 106
4.2.1.9 Progressive changes in tissue aspartate levels in the mesolimbic system o f 3-NPM-
treated rats 106
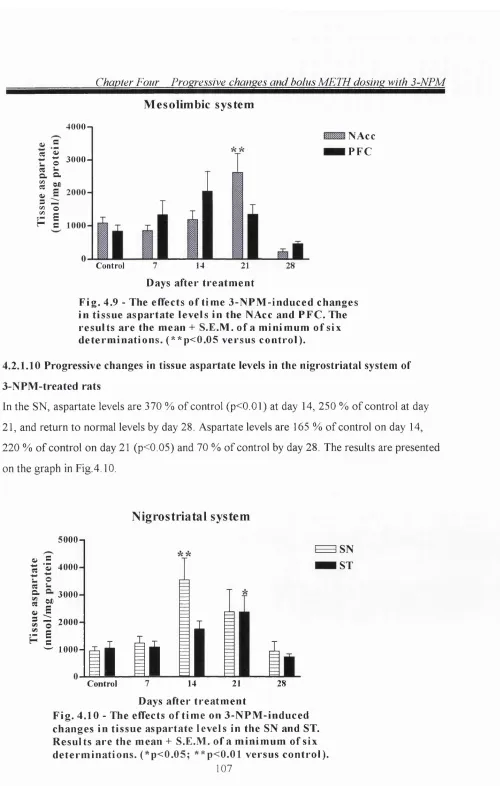
4.2.1.10 Progressive changes in tissue aspartate levels in the nigrostriatal system of
3-NPM-treated rats 107
4.2.1.11 Progressive changes in tissue glutamate levels in the mesolimbic system of
3-NPM-treated rats 108
4.2.1.12 Progressive changes in tissue glutamate levels in the nigrostriatal system of
3-NPM-treated rats 108
4.2.2.1 Differential effects of 3-NPM and 3-NPMsd. on tissue DA levels in the
mesolimbic system 109
4.2.2.2 Differential effects of 3-NPM and 3-NPMsd. on tissue DA levels in the
nigrostriatal system 110
4.2.2.3 Differential effects of 3-NPM and 3-NPMsd. on tissue 5-HT levels in the
mesolimbic system 111
4.2.2.4 Comparative effects of 3-NPM and 3-NPMsd. on tissue 5-HT levels in the
nigrostriatal system 111
4.2.2.5 Comparative effects of 3-NPM and 3-NPMsd. on DDC activity in the
mesolimbic system 112
4.2.2.6 Differential effects of 3-NPM and 3-NPMsd. on DDC activity in the
nigrostriatal system 112
4.2.2.7 Differential effects of 3-NPM and 3-NPMsd. on 5-HTPDC activity in the
mesolimbic system 114
4.2.2.8 Differential effects of 3-NPM and 3-NPMsd. on 5-HTPDC activity in the
nigrostriatal system 114
4.2.2.9 Differential effects of 3-NPM and 3-NPMsd. on tissue aspartate levels in the
mesolimbic system 114
4.2.2.10 Differential effects of 3-NPM and 3-NPMsd. on tissue aspartate levels in the
nigrostriatal system 116
4.2.2.11 Differential effects of 3-NPM and 3-NPMsd. on tissue glutamate levels in the
mesolimbic system 116
4.2.2.12 Differential effects o f 3-NPM and 3-NPMsd. on tissue glutamate levels in the
nigrostriatal system 117
4.3 Discussion 118
CHAPTER FIVE - BEHAVIOURAL ASSESSMENT OF THE 3-NPM MODEL 121
5.1 Introduction 122
5.2 Results 122
5.2.1 Locomotor responses to apomorphine 122
5.2.1.2 Locomotor responses of the 3-NPM groups to apomorphine 124
5.2.1.3 Effects of DA D1 and D2 antagonists on the locomotor properties of
apomorphine in 3-NPM-treated rats 125
5.2.1.4 Differential effects of apomorphine in 3-NPM and 3-NPMsd.-treated rats 126
5.2.2 Locomotor responses to MK 801 127
5.2.2.1 Comparative effects ofM K 801 in unlesioned and 3-NPM-treated rats 127 5.2.2.2 Effects of DA D1 and D2 antagonists on the locomotor properties o f MK 801
in 3-NPM-treated rats 128
5.2.3 Locomotor responses to SKF 38393 129
5.2.3.1 Comparative effects of SKF 38393 in unlesioned and 3-NPM-treated rats 129 5.2.3.2 Effects of DA D2 antagonism on the locomotor properties o f SKF 38393
in 3 -NPM-treated rats 130
5.2.4 Locomotor responses to RU 24213 131
5.2.4.1 Differential effects of RU 24213 in unlesioned and 3-NPM-treated rats 131 5.2.4.2 Effects o fD A D l and D2 antagonists on the locomotor properties o f RU 24213
in 3 -NPM-treated rats 13 2
5.3 Discussion 133
CHAPTER SIX - EVIDENCE THAT L-DOPA-INDUCED LOCOMOTION MAY BE
BOTH DOPAMINE DEPENDENT AND DOPAMINE INDEPENDENT 13 8
6.1 Introduction 139
6.2 Methods 139
6.3 Results 141
6.3.1 Experiments in reserpine-treated rats 141
6.3 .1 1 Effects of peripheral AADC inhibition on L-DOPA-induced behaviour in
reserpine-treated rats 141
6.3.1.2 Effects of NMDA antagonism on L-DOPA-induced behaviour in
reserpine-treated rats 142
6.3.1.3 Effects of NMDA antagonism and central AADC inhibition on
6.3.1.4 Differential involvement o fD l and D2 receptors in L-DOPA-induced
locomotion in reserpine-treated rats 148
6.3.1.5 Effects of tyrosine hydroxylase inhibition on d-amphetamine-induced
locomotion in reserpine-treated rats 151
6.3.1.6 Locomotor effects o f L-DOPA methyl ester in reserpine-treated rats 154 6.3.1.7 Differential involvement o fD l and D2 receptors in LDME-induced
locomotion in reserpine-treated rats 154
6.3 .1.8 Effects of budipine on L-DOPA methyl ester-induced locomotion in
reserpine-treated rats 156
6.3.2 Experiments in monoamine intact rats 157
6.3.2.1 Effects o f low- and high-dose LDOPA on locomotion in intact rats 157
6.3.2.2 Effects of budipine on L-DOPA-induced locomotion in intact rats 157
6.3..2.3 Effects of central AADC inhibition on L-DOPA-induced locomotion in
intact rats 159
6.3.3 Experiments in 3-NPM-treated rats 160
6.3.3.1 Effects o f central AADC inhibition on L-DOPA-induced locomotion in
3 -NPM-treated rats 160
6.3.3.2 Effects of budipine on L-DOPA-induced locomotion in 3-NPM-treated rats 161
6.4 Discussion 162
CHAPTER SEVEN - COMPARATIVE STUDY OF THE BIOCHEMICAL EFFECTS
OF L-DOPA IN RESERPINE AND 3-NPM-TREATED RATS 168
7.1 Introduction 169
7.2 Methods 169
7.3 Results 170
7.3.1 Experiments in reserpine-treated rats 170
7.3.1.1 Effects of L-DOPA in the presence and absence of central and peripheral
AADC inhibitors on tissue DA levels in reserpine-treated rats 170
7.3.1.2 Effects of L-DOPA in the presence and absence of central and peripheral
7.3.1.3 Effects of L-DOPA in the presence and absence of central and peripheral
AADC inhibitors on tissue 5-HT levels in reserpine-treated rats 172
7.3.1.4 Effects of L-DOPA in the presence and absence o f central and peripheral
AADC inhibitors on DA formation in reserpine-treated rats 172
7.3.1.5 Effects of L-DOPA in the presence and absence of central and peripheral
AADC inhibitors on 5-HT formation in reserpine-treated rats 173
7.3.1.6 Effects of L-DOPA in the presence and absence of central and peripheral
AADC inhibitors on tissue levels of excitatory amino acids in reserpine-treated rats 176
7.3.2 Experiments in 3-NPM-treated rats 178
7.3.2.1 Effects of L-DOPA in the presence and absence o f central and peripheral
AADC inhibitors on tissue DA levels in 3-NPM-treated rats 178
1 3 2 . 2 Effects of L-DOPA in the presence and absence o f central and peripheral
AADC inhibitors on tissue L-DOPA levels in 3-NPM-treated rats 179
7.3.2.3 Effects of L-DOPA in the presence and absence of central and peripheral
AADC inhibitors on tissue 5-HT levels in 3-NPM-treated rats 180
7.3.2.4 Effects of L-DOPA in the presence and absence o f central and peripheral
AADC inhibitors on DA formation in 3-NPM-treated rats 180
7.3.2.5 Effects of L-DOPA in the presence and absence o f central and peripheral
AADC inhibitors on 5-HT formation in 3-NPM-treated rats 181
7.3.2.6 Effects of L-DOPA in the presence and absence o f central and peripheral
AADC inhibitors on tissue levels o f excitatory amino acids in 3-NPM-treated rats 181
7.4 Discussion 184
CHAPTER EIGHT - FINAL COMMENTS 188
8.1 The 3-NPM model and the aetiology of Parkinson's disease 189
8.2 L-DOPA-induced locomotion: a myth or a reality? 190
List of figures
Fig. 1.1 A schematic presentation o f the basal ganglia in normal and parkinsonian brains 29
Fig. 1.2 Mechanisms of nigral cell death 58
Fig. 3.1 Tissue DA levels in the NAcc, PFC, SN and ST of rats seven days after treatment
with four two-hourly doses of 4, 8 and 12.5 mg/kg METH. 74
Fig. 3.2 The effects of 3-NP and METH combinations on DA levels in the NAcc. 75 Fig. 3.3 The effects of 3-NP and METH combinations on DA levels in the PFC. 76
Fig. 3.4 The effects of 3-NP and METH combinations on DA levels in the SN. 76
Fig. 3.5 The effects of various combinations of 3-NP and METH on tissue DA levels
in the ST. 77
Fig. 3.6 The effects o f different combinations of 3-NP and METH on tissue 5-HT
levels in the NAcc. 78
Fig. 3.7 The effects of 3-NP and METH combinations on the tissue levels o f 5-HT
in the PFC. 78
Fig. 3.8 The effects of 3-NP and METH combinations on 5-HT levels in the SN. 79
Fig. 3.9 The effects of 3-NP and METH treatment on the tissue levels of 5-HT in the ST. 79
Fig. 3.10a Responses o f 3-NP and METH-treated rats to apomorphine. 80
Fig. 3.10b Responses o f 3-NP and METH-treated rats to apomorphine. 80
Fig. 3.11 The effects of 3-NP and METH treatments on tissue DA levels in the
NAcc and PFC. 83
Fig. 3.12 The effects of 3-NP and METH treatments on tissue DA levels in the
SN and ST. 84
Fig. 3.13 The effects of 3-NP and METH on tissue5-HT levels in the NAcc and PFC. 85 Fig. 3.14 The effects o f treatment with 3-NP and METH on tissue 5-HT levels in the
SN and ST. 86
Fig. 3.15 The effects of 3-NP and METH treatment on DDC activity in the
NAcc and PFC. 87
Fig. 3.16 The effects of 3-NP and METH on DDC activity in the SN and ST. 87
Fig. 3.18 The effects of 3-NP and METH on 5-HTPDC activity in the SN and ST. 88
Fig. 3.19 The effects of 3-NP and METH treatment on tissue levels o f aspartate in
the NAcc and PFC. 89
Fig. 3.20 The effects of 3-NP and METH treatments on tissue levels of aspartate in
the SN and ST. 90
Fig. 3.21 The effects of 3-NP and METH on glutamate levels in the NAcc and PFC. 90
Fig. 3.22 The effects of 3-NP and METH on glutamate levels in the SN and ST. 91
Fig. 3.23 Toxic effects induced by 3-nitropropionic acid. 92
Fig. 3.24 Toxic effects induced by METH. 93
Fig. 3.25 Toxic effects of 3-NP and METH with the 3-NPM dosing schedule. 93
Fig. 3.26 Average weight change from weights at the start of dosing on day one. 94
Fig. 4.1 The effects of time on 3-NPM-induced changes in tissue DA levels in
the NAcc and PFC. 101
Fig. 4.2 The effects of time on 3-NPM-induced changes in tissue DA levels in
the SN and ST. 102
Fig. 4.3 The effects of time on 3-NPM-induced changes in tissue 5-HT levels in
the NAcc and PFC. 103
Fig. 4.4 The effects of time on 3-NPM-induced changes in tissue 5-HT levels in
the SN and ST. 103
Fig. 4.5 The effects of time on 3-NPM-induced changes in DDC activity in the
NAcc and PFC. 104
Fig. 4.6 The effects of time on 3-NPM-induced changes in DDC activity in the
SN and ST. 105
Fig. 4.7 The effects of time on 3-NPM-induced changes in 5-HTPDC activity in
the NAcc and PFC. 105
Fig. 4.8 The effects of time on 3-NPM-induced changes in 5-HTPDC activity in
the SN and ST. 106
Fig. 4.9 The effects of time on 3-NPM-induced changes in tissue aspartate levels
Fig. 4.10 The efifects of time on 3-NPM-induced changes in tissue aspartate levels
in the SN and ST. 107
Fig. 4.11 The effects of time on 3-NPM-induced changes in tissue glutamate levels
in the NAcc and PFC. 108
Fig. 4.12 The effects of time on 3-NPM-induced changes in tissue glutamate levels
in the SN and ST. 109
Fig. 4.13 Differential effects of 3-NPM and 3-NPMsd. on tissue DA levels in the
NAcc and PFC. 110
Fig. 4.14 Differential effects of 3-NPM and 3-NPMsd. on tissue DA levels in the
SN and ST. 110
Fig. 4.15 Differential effects of 3-NPM and 3-NPMsd. on tissue 5-HT levels in the
NAcc and PFC. 111
Fig. 4.16 Comparative effects of 3-NPM and 3-NPMsd. on tissue 5-HT levels in the
SN and ST. 112
Fig. 4.17 Comparative effects of 3-NPM and 3-NPMsd. on DDC activity in the
NAcc and PFC. 113
Fig. 4.18 Differential effects of 3-NPM and 3-NPMsd. on DDC activity in the
SN and ST. 113
Fig. 4.19 Differential effects of 3-NPM and 3-NPMsd. on 5-HTPDC activity in
the NAcc and PFC. 114
Fig. 4.20 Differential effects of 3-NPM and 3-NPMsd. on 5-HTPDC activity in
the SN and ST. 115
Fig. 4.21 Differential effects o f 3-NPM and 3-NPMsd. on tissue aspartate levels in
the NAcc and PFC. 115
Fig. 4.22 Differential effects of 3-NPM and 3-NPMsd. on tissue aspartate levels in
the SN and ST. 116
Fig. 4.23 Differential effects of 3-NPM and 3-NPMsd. on tissue glutamate levels in
the NAcc and PFC 117
Fig. 4.24 Differential effects of 3-NPM and 3-NPMsd. on tissue glutamate levels in
Fig. 5.1a Development of dopamine receptor supersensitivity to apomorphine in
3-NPM-treated rats. 123
Fig. 5.1b Response to apomorphine one and four days after 3-NP3M. 123
Fig. 5.2 Group locomotor responses to apomorphine five days after treatment. 124
Fig. 5.3 The effects of sulpiride and SCH 23390 on the locomotor response to
apomorphine, five days after 3-NPM treatment. 125
Fig. 5.4 A comparison of the locomotor responses to apomorphine in rats treated
with 3-NPM or 3-NPMsd. 126
Fig. 5.5 Locomotor effects of MK 801 in intact and 3-NPM-treated rats. 127
Fig. 5.6 The effects of sulpiride and SCH 23390 on the locomotor properties o f
MK 801 in 3-NPM-treated rats. 128
Fig. 5.7 The locomotor effects o f SKF 38393 in intact and 3-NPM-treated rats. 129
Fig. 5.8 The effects of sulpiride on the locomotor activity o f SKF 38393 in
3 -NPM-treated rats. 130
Fig. 5.9 Locomotor effects of RU 24213 in intact and 3-NPM-treated rats. 131
Fig. 5.10 The effects of sulpiride and SCH 23390 on the locomotor properties of
RU 24213 in 3-NPM-treated rats. 132
Fig. 6.1 Locomotor effects of L-DOPA (25, 50, 100 and 200 mg/kg) administered
30 min after benserazide, in reserpine-treated rats. 142
Fig. 6.2a The effects of budipine on the locomotor properties o f low-dose (25 mg/kg)
L-DOPA in reserpine-treated rats. 143
Fig. 6.2b The effects of budipine on L-DOPA- (50 mg/kg) induced locomotion in
reserpine-treated rats. 143
Fig. 6.2c The effects o f budipine on the locomotion induced by high dose (100 mg/kg)
L-DOPA in reserpine-treated rats. 144
Fig. 6.3 The effects of NMDA and AADC antagonists on L-DOPA (100 mg/kg)-
induced locomotion in reserpine-treated rats. 145
Fig. 6.4 The effects of NMDA and AADC antagonists on L-DOPA (50 mg/kg)-
Fig. 6.5 The effects of NMDA and AADC antagonists on L-DOPA (25
mg/kg)-induced locomotion in reserpine-treated rats. 147
Fig. 6.6 Differential involvement o fD l and D2 receptors in L-DOPA-induced
locomotion in reserpine-treated rats. 148
Fig. 6.7 Dopamine receptor selectivity in the potentiation of L-DOPA-induced
locomotion by budipine in reserpine-treated rats. 149
Fig. 6.8 Differential involvement o fD l and D2 receptors in the potentiation of
L-DOPA by budipine in reserpine-treated rats. 149
Fig. 6.9 The effects o fD l and D2 antagonists on the activity o f L-DOPA (200 mg/kg). 150 Fig. 6.10 The effects o f tyrosine hydroxylase and central DOPA decarboxylase
inhibition on the locomotor activity o f d-amphetamine in reserpine-treated rats. 152 Fig. 6.11 Reversal of L-DOPA- and d-amphetamine-induced stereotypy by central
DOPA decarboxylase inhibition in reserpine-treated rats. 153
Fig. 6.12 DOPA decarboxylase inhibition and L-DOPA methyl ester-induced
locomotion in reserpine-treated rats. 155
Fig. 6.13 Differential involvement o f D l and D2 receptors in L-DOPA methyl
ester-induced locomotion in reserpine-treated rats. 155
Fig. 6.14 Budipine and L-DOPA methyl ester-induced locomotion in
reserpine-treated rats. 156
Fig. 6.15 Effects o f L-DOPA in intact rats 157
Fig. 6.16 Effects of budipine on the locomotor activity of low-dose L-DOPA
(25 mg/kg) in intact rats. 158
Fig. 6.17 Effects of budipine on the locomotor activity o f high-dose L-DOPA
(100 mg/kg) in intact rats. 158
Fig. 6.18 The effects of DOPA decarboxylase inhibitors on L-DOPA-induced
locomotion in intact rats. 159
Fig. 6.19 The effects of central and peripheral DOPA decarboxylase inhibitors
on the locomotor activity of L-DOPA in 3-NPM-treated rats. 160
Fig. 6.20 The effects o f budipine on L-DOPA-induced locomotion in
Fig. 7.1 Tissue DA levels in the NAcc and PFC o f reserpinized rats treated with saline
or L-DOPA, NSD 1015 and benserazide. 170
Fig. 7.2 Tissue DA levels in the SN and ST of reserpinized rats after treatment with
saline or a combination of L-DOPA, NSD 1015 and benserazide. 170
Fig. 7.3 Tissue levels of L-DOPA in the NAcc and PFC of reserpinized rats after
treatment with saline or a combination of L-DOPA, NSD 1015 and benserazide. 171
Fig. 7.4 Tissue levels of L-DOPA in the SN and ST of reserpinized rats following
treatment with saline or a combination of L-DOPA, NSD 1015 and benserazide. 171
Fig. 7.5 DOPA decarboxylase activity in the NAcc and PFC of reserpinized rats
treated with saline or a combination of L-DOPA, NSD 1015 and benserazide. 172
Fig. 7.6 DOPA decarboxylase activity in the SN and ST o f reserpinized rats after
treatment with saline or a combination of L-DOPA, NSD 1015 and benserazide. 173
Fig. 7.7 5-HTP decarboxylase activity in the NAcc and PFC of reserpinized rats
treated with saline or a combination of L-DOPA, NSD 1015 and benserazide. 174
Fig. 7.8 5-HTP decarboxylase activity in the SN and ST o f reserpinized rats
treated with saline or a combination of L-DOPA, NSD 1015 and benserazide. 174
Fig. 7.9 Formation of 5-HT in the NAcc and PFC of reserpinized rats treated with
saline or a combination of L-DOPA, NSD 1015 and benserazide. 175
Fig. 7.10 Formation of 5-HT in the SN and ST of reserpinized rats treated with saline
or a combination of L-DOPA, NSD 1015 and benserazide. 175
Fig. 7.11 Tissue aspartate levels in the NAcc and PFC o f reserpinized rats after
treatment with saline or a combination of L-DOPA, NSD 1015 and benserazide. 176
Fig. 7.12 Tissue aspartate levels in the SN and ST o f reserpinized rats after treatment
with saline or a combination of L-DOPA, NSD 1015 and benserazide. 176
Fig. 7.13 Tissue glutamate levels in the NAcc and PFC o f reserpinized rats after
treatment with saline or a combination of L-DOPA, NSD 1015 and benserazide. 177
Fig. 7.14 Tissue glutamate levels in the SN and ST of reserpinized rats after treatment
with saline or a combination of L-DOPA, NSD 1015 and benserazide. 177
Fig. 7.15 Tissue DA levels in the NAcc and PFC of 3-NPM rats treated with saline or
Fig. 7.16 Tissue DA levels in the SN and ST of 3-NPM rats treated with saline or a
combination of L-DOPA, benserazide and/or NSD 1015. 178
Fig. 7.17 Tissue L-DOPA levels in the NAcc and PFC of 3-NPM rats after treatment
with saline or L-DOPA, benserazide and/or NSD 1015. 179
Fig. 7.18 Tissue L-DOPA levels in the SN and ST of 3-NPM rats after treatment with
saline or L-DOPA, benserazide and/or NSD 1015. 179
Fig. 7.19 DA formation by DDC in the NAcc and PFC of 3-NPM rats following
treatment with saline or L-DOPA, benserazide and/or NSD 1015. 180
Fig. 7.20 DA formation by DDC in the SN and ST of 3-NPM rats following
treatment with saline or L-DOPA, benserazide and/or NSD 1015. 181
Fig. 7.21 Tissue aspartate levels in the NAcc and PFC o f 3-NPM rats after treatment
with saline or L-DOPA, benserazide and/or NSD 1015. 182
Fig. 7.22 Tissue aspartate levels in the SN and ST of 3-NPM rats following
treatment with saline or L-DOPA, benserazide and/or NSD 1015. 182
Fig. 7.23 Tissue glutamate levels in the NAcc and PFC o f 3-NPM rats following
treatment with saline or L-DOPA, benserazide and/or NSD 1015. 183
Fig. 7.24 Tissue glutamate levels in the SN and ST of 3-NPM rats following treatment
with saline or L-DOPA, benserazide and/or NSD 1015. 183
List of tables
Table 2.1 Index of treatment modes for 3-NP and METH. 61
Table 2.2 Neurotoxin injection schedule. 62
Table 6.1 Dosing schedule for L-DOPA and LDME combinations with AADC
inhibitors, DA receptor antagonists and budipine. 140
Table 6.2 Dosing schedule for L-DOPA and d-amphetamine combinations. 141
Table 6.3 Counts for rearing and jumping with L-DOPA treatment schedules in
reserpine-treated rats. 147
Table 6.4 Counts for rearing and jumping with L-DOPA treatment schedules and DA
Table 6.5 Counts for rearing and jumping with d-amphetamine treatment schedules
in reserpine-treated rats. 153
Table 6.6 Counts for rearing and jumping with L-DOPA methyl ester treatment
schedules in reserpine-treated rats. 154
Table 6.7 Counts for rearing and jumping with L-DOPA treatment schedules in
monoamine intact rats. 159
Table 6.8 Counts for rearing and jumping with L-DOPA treatment schedules in
Abbreviations
AADC Aromatic l-amino acid decarboxylase
Ach Acetylcholine
oKGH Alpha ketoglutate dehydrogenase
AMPA a-amino-3 -hydroxy-5-methyl-4-isoxazolepropionate
AMPT a-methyl-p-tyrosine
ANOVA Analysis of variance
ATP Adenosine triphosphate
cAMP Cyclic adenosine monophosphate
CCK-8 Cholecystokinin-8
CNS Central nervous system
COMT Catechol-O-methyl transferase
DA Dopamine
DDC DOPA decarboxylase
DOPAC 3,4-Dihydroxyphenylacetic acid
DSP-4 N-(2-chloroethyl)-N-ethyl-2-bromobenzylamine
EAA Excitatory amino acid
GAB A y-aminobutyric acid
GTP Guanosine triphosphate
5-HT 5-Hydroxytryptamine
5-HTP 5 -Hydroxytryptophan
5-HTPDC 5-Hydroxytryptophan decarboxylase
i.p. Intraperitoneal
L-DOPA L-3,4-dihydroxyphenylalanine
LDME L-DOPA methyl ester
MAO Monoamine oxidase
METH Methamphetamine
MK 801 (+)-5-methyl-10,11 -dihydro-5H-dibenzo(a,d)-cyclohepten-5,10-imine maleate
MPDP 1 -methyl-4-phenyldihydropyridine
MPTP 1 -methyl-4-phenyl-1,2,3,6-tetrahydropyridine
mRNA Messenger ribonucleic acid
NA Noradrenaline
NAcc Nucleus accumbens
NADH Nicotinamide adenine dinucleotide
NMDA N-methyl-D-aspartate
3-NP 3-nitropropionic acid
3-NPM 3-nitropropionic acid/ methaphetamine
3-NPMsd. 3-nitropropionic acid/ methamphetamine single-dose schedule 3-NP3M 3-nitropropionic acid (30 mg/kg)/ methamphetamine
N SD 1015 m-hydroxybenzylhydrazine dihydrochloride
6-OHDA 6-hydroxydopamine
PCP Phencyclidine
PD Parkinson’s disease
PFC Prefrontal cortex
RU 24213 N-n-propyl-N-phenylethyl-p-[3-hydroxyphenyl] ethylamine hydrochloride
s.c. Subcutaneous
SCH 23390 [R]-[+]-8-chloro-2,3,4,5-tetrahydro-3-methyl-5-phenyl-lH-3-benzazepine-7-ol hemimaleate
SDH Succinate dehydrogenase
SKF 38393 (±)-1 -Phenyl-2,3,4,5-tetrahydro-( 1 H)-3-benzazepine-7,8-diol hydrochloride
SN Substantia nigra
SNpc Substantia nigra pars compacta
SNr Substantia nigra pars reticulata
ST Corpus striatum
STN Subthalamic nucleus
TCA Tricarboxylic acid cycle
CHAPTER ONE
Chapter One General Introduction 1.1 The aetiology of Parkinson’s disease
Parkinson’s disease (PD) is a neurodegenerative disorder characterized by akinesia, resting tremor and muscle rigidity. It is primarily a disease of the basal ganglia in which cell bodies of dopaminergic neurones in the zona compacta of the substantia nigra undergo progressive degeneration, although other neuronal systems in the brain are also affected. Cell death is followed by the appearance of eosinophilic inclusions (Lewy bodies) which are the characteristic pathological feature of PD (Jenner, 1992). The disease affects one in four hundred of the population, occurring at about fifty to sixty-five years of age (Burnham, 1989). At the moment, there is no cure for the disorder, although replacement therapy with L-DOPA and other dopamine agonists has given some relief to patients. However, prognosis after five years is poor, with the condition returning to pre-treatment status (Burnham, 1989). This stems from the fact that there is still no means of preventing the progression of the pathology. Studies are still on to identify the cause(s) of neuronal death.
The cause of idiopathic Parkinson’s disease is still unknown, despite the avalanche of theories. However, two broad schools of thought exist. These are the Genetic Theories and the
Environmental Theories. The proposition of a genetic or familial trend in the occurrence gained ground with the evidence that 10% of patients have an affected relative (Duvoisin,
Chapter One General Introduction
1997). All these findings have generated various concepts for the cause of the disorder. Of these, the one currently growing in popularity is that which suggests that the number of dopamine neurones in the substantia nigra is slowly eroded by some continuous toxic process involving the excessive formation of free radical species that induce a state of oxidative stress. This oxidative stress is thought to be caused by either a neurotoxin or through the altered metabolism of dopamine itself (Jenner, 1992; Sonsalla et al, 1989). On the whole, the emerging
view is that of a multifactorial etiology with environmental factors acting on genetically susceptible individuals with normal aging (Takakubo et al, 1996).
1.2 The neurochemistry of PD
Chapter One General Introduction
NORMAL PARKINSONIAN
GLU Cortex
GLU
Striatum
G A B A
External Globus Pallidus
G A BA
G A B A
Subthalamic Nucleus Substantia
Niera GLU
G A B A GLU
Thalamus Internal
Globus Pallidus
G A B A G A B A
Cortex Striatum External Globus Pallidus Substantia Niera Subthalamic Nucleus Internal Globus Pallidus Thalamus
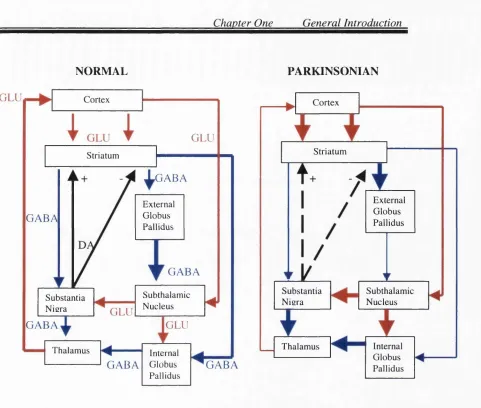
Fig. I.I - A schematic presentation o f the basal ganglia in normal and parkinsonian brains. The width o f the lines
indicates the extent o f neuronal firing, with the wider lines denoting an increase in activity, and the thinner lines
representing a decrease in activity. The hatched lines indicate a reduction in nigrostriatal dopaminergic activity common
in PD. DA, dopamine; GABA, y-amnobutyric acid; GLU, glutamate.
Glutamatergic im pulses from the cortex are processed in the basal gan glia via tw o major neuronal circuits. T hese are: the Direct and the Indirect striatonigral output pathways. T hese circuits differ in terms o f synaptic connectivity, the type o f neuropeptide they co-exp ress with G A B A , and in the D A receptors they express (Albin et al., 1989). The direct striatonigral pathway carries inhibitory im pulses from the ST to the internal globus pallidus (entopenduncular n u cleu s) and substantia nigra pars reticulata (SN r), via G A B A neurones co -exp ressin g dynorphin and substance P. T hese
neurones facilitate glutam ate-m ediated excitation via D | receptors. In the Indirect pathway, D A released from the nigrostriatal tract exerts an inhibitory influence on striatonigral activity via D2
Chapter One General Introduction
firing in the subthalamic nucleus, allowing thalamocortical impulses to flow unhindered. The overall effect of DA is to facilitate smooth control of motor impulses sent to the basal ganglia from centres in the cerebral cortex.
Following degeneration o f dopaminergic neurones in the zona compacta o f the SN, there is a marked reduction in the amount of DA available from the nigrostriatal pathway. The removal of this DA “brake” in the ST leads to heightened stimulation of cholinergic and glutamatergic pathways in the basal ganglia, leading to the rigidity and akinesia observed in PD (Starr,
1995b). As shown in the figure, loss of DA in the ST disinhibits the internal globus pallidus and the subthalamic nucleus (STN), ultimately inhibiting thalamocortical feedback necessary for fluid movement (Albin et al., 1989). A heightened glutamatergic input to the SN from the subthalamic nucleus is supported by the fact that MPTP-induced parkinsonism can be reversed when this nucleus is lesioned, and decreased NMDA radioligand binding in the internal globus pallidus (Lange et al., 1997). The STN appears to be a crucial site for neurotransmission in parkinsonian brain, as lesions in this nucleus have also been reported to reverse the cardinal signs of PD, and induce wild and erratic movements in primates (Crossman et al., 1984). The excitotoxic consequences of STN hyperactivity on the DA neurones in the SN and internal globus pallidus holds potential for antiparkinsonian intervention with glutamate antagonists (Starr, 1995b).
1.2.1 Dopamine in PD
Dopamine is formed when L-DOPA is decarboxylated by the enzyme AADC. The amino acid L-DOPA can be administered exogenously, or formed by the activity of tyrosine hydoxylase (TH) on endogenous stores of tyrosine. It is then stored in vesiclce of dopaminergic neurones, and is subject to release by reversal of the dopamine transporter (Fleckenstein et al., 1997). Central stores o f DA are known to be depleted by the alkaloid reserpine (Carlsson et al.,
Chapter One General Introduction
The implication of DA in the reversal of rigidity in reserpinised rodents led to studies in postmortem brains that revealed massive reductions in the concentration of DA and
homovanillic acid (HVA) in the caudate, putamen, nucleus accumbens and substantia nigra (Kish et al., 1988; Price et al, 1978). The tissue DA content was found to drop to as low as 3 % of control values in the putamen, 5 % in the caudate nucleus, 15 % in the SN and 40 % in the NAcc. Other studies have found nearly complete depletion of DA in all segments of the putamen, with the greatest reductions (more than 99 %) occurring in the caudal portions of the putamen (Kish et a l, 1988). In all these studies, there was a greater degree o f resistance to depletions in HVA, suggesting a compensatory increase in the activity o f the surviving neurones. This could be through a reduced capacity for reuptake and storage of released DA (Zigmond and Strieker, 1984).
1.2.2 5-H T inP D
Tissue levels of 5-HT are markedly reduced in the ST, SN and hippocampus, but not in the raphe nucleus of PD patients (Scatton et al, 1983). The neurochemical significance of this is not clear, but this finding may explain the depression commonly observed in patients suffering from PD. In idiopathic PD, 5-HT efferents from the raphe nucleus do not degenerate to the same extent as nigrostriatal dopaminergic neurones (Zhou et a l, 1991). This is important because the surviving 5-HT neurones in the ST become an additional source o f DA, as 5-HT neurones are known to decarboxylate L-DOPA (Arai et a l, 1994; 1995a; 1996a,b).
Furthermore, 5-HT neurones impinging on DA neurones have a facilitatory effect on DA release in the ST and NAcc (Benloucif et al, 1993; Nomikos et al, 1996). This facilitation remains to be exploited in the treatment of PD.
1.2.3 Noradrenaline in PD
Noradrenaline (NA) is formed from DA by the sequential action o f dopamine-P-hydroxylase and phenylethanolamine-N-methyltransferase. The locus cerulus, the principal source of NA in the brain, is known to show depigmentation and loss of o f neurones, with Lewy bodies in the brains of parkinsonian patients (Farley and Hornykiewicz, 1976; Scatton et a l, 1983).
Chapter One General Introduction
catecholaminergic neurones to the effects of toxins such as methamphetamine (Fornai et al., 1995). The fact that NA is involved in motor and cognitive functions (Moore and Bloom, 1979) suggests a role for this compound in the clinical presentations of PD. The ability of L-DOPA to replace central stores of both DA and NA may explain its additional clinical benefit in the treatment of patients with the disease.
1.2.4 Acetylcholine in PD
Tissue levels of acetylcholine (Ach), and the activity of its synthesizing enzyme, choline acetyl transferase (ChAT), are markedly reduced in the caudate, putamen, globus pallidus, SN, cerebral cortex and hippocampus o f parkinsonian patients (Lloyd et al., 1975b; Ruberg et al., 1982). These effects may be a regulatory consequence, rather than a primary factor in PD. The loss o f Ach in the cerbral cortex is thought to be responsible for the dementia observed in PD sufferers (Ruberg et al., 1982). Despite the reduction in ChAT activity, Ach tone is heightened in PD, as a result of a decrease in the D2-mediated opposition to the cholinergic drive (Starr,
1995b). This effect, coupled with the direct stimulation of cholinergic interneurones by the hyperactive corticostriatal glutamate projection, results in excessive cholinergic transmission that is thought to be responsible for the rigidity and tremor observed in PD patients (Starr,
1995a).
1.2.5 Gamma-aminobutyric acid in PD
Gamma-aminobutyric acid (GABA) is the major inhibitory neurotransmitter in the CNS. There are no indications for a primary involvement of this neurotransmitter in the pathology o f PD, but it is reasonable to speculate that its acivity can be up- or down-regulated as a result o f DA depletion in the ST. Tissue levels of GABA are significantly elevated in the putamen (Perry et al., 1983), while the activity of glutamic acid decarboxylase (GAD, the enzyme that converts glutamic acid to GABA) is reduced by -5 0 % in the ST, globus pallidus and SN of PD patients (Lloyd and Hornykiewicz, 1973). Gabaergic inhibitory tone is heightened in the striatopallidal (external globus pallidus) and nigrothalamic pathways, giving rise to a paucity of
Chapter One General Introduction 1.2.6 Glutamate in PD
Glutamate is the principal excitatory neurotransmitter in the CNS. Glutamate receptors are located on virtually all neurones in the CNS, giving glutamate the capacity to excite almost all cells o f the central nervous system (Ciliax et al., 1997). There exists a delicate balance between glutamate and DA in the basal ganglia. Following the loss o f the inhibitory influence of
nigrostriatal DA in parkinsonian brains, striatopallidal GABAergic tone is increased, disinhibiting the subthalamic nucleus. Disinhibition of the STN results in heightened
glutamatergic impulses to the SNr and internal globus pallidus, and decreased thalamocortical and thalamostriatal feedback (Parent and Hazrati, 1995a,b). The consequence o f this is a further increase in corticostriatal glutamate activity (Albin et al., 1989). The overall picture is one of excessive glutamatergic tone in the basal ganglia, that offers various sites for
antiparkinsonian intervention with glutamate antagonists (Starr, 1995a,b).
1.2.7 Neuropeptides in PD
The changes observed in the concentrations of various neuropeptides in the basal ganglia of PD patients appears to be secondary to the incidence of degeneration of dopaminergic neurones in the zona compacta of the SN. Using radioimunoassay techniques, the levels of substance P in the the SN, putamen and external globus pallidus were found to be reduced (Mauborgne et al., 1983), while methionine-enkephalin levels in the SN, putamen, pallidum and ventral tegmented area of parkinsonian patients (Taquet et al., 1983). Furthermore, the levels o f cholecystokinin-8 (CCK-8) were found to be reduced in the SN, but not in the striatal and corticolimbic areas innervated by dopamineric neurones (Studler et al., 1982). In addition, somatostatin levels in the basal ganglia of nondemented patients with PD did not differ from controls, but were markedly reduced in the frontal cortex, hippocampus and entorhinal cortex (Epelbaum et al., 1983).
1.3 Dopamine receptors and PD
Five different dopamine receptors have been cloned and sequenced. These have been classified into two major families - Dl-like and D2-like - based on pharmacologic, anatomic and
Chapter One General Introduction
subfamily (D1 and D5) are positively coupled to adenylate cyclase, those in the D2 subfamily (D2, D3 and D4) are negatively coupled to this enzyme (Stoof and Kebabian, 1984). Whereas
the D1 and D2 subtypes are expressed predominantly in the basal ganglia, D3, D4 and D5 have low expressions among these nuclei.
1.3.1 Dl-like dopamine receptors
All dopamine receptors are members of the family o f G protein-coupled receptors and have seven transmembrane regions. The D1 subfamily have long carboxy termini, while the D2
subfamily have long intracellular loops (see Sibley et al., 1993 for review). The D1 subclass consists o f D l, D ig and D5 gene products which bind D1-selective ligands with high affinity, and activate adenylyl cyclase (Sunahara et al., 1990; 1991). These receptors are highly conserved, with approximately 80 % homology in the transmembrane region (Sunahara et al, 1991; Tiberi et al., 1991). The Dig receptor, cloned from rats (Tiberi et al., 1991), and the D5 receptor, cloned from humans (Sunahara et al., 1991), may be differential expressions of the same gene.
D1 and D2 receptors are immunolocalized in the striatum (Levey et al., 1993), with the D1 receptors predominantly regulating the striatonigral output pathway, and the D2 receptors regulating the striatopallidal output pathway (Gerfen et al., 1990; Wilson, 1990). The striatonigral output pathway (predominantly D1 receptors) is more susceptible than the striatopallidal output pathway (predominantly D2 receptors) to energy impairments, as would normally occur with aging (Araujo and Hilt, 1998). In addition, D1 populations in rodents can be reduced by treatment with methamphetamine (Cadet et al., 1998) or 3-nitropropionic acid (Koutouzis et al., 1994).
1.3.2 D2-like dopamine receptors
Chapter One General Introduction
(autoreceptors), cholinergic intemeurones in the ST, and striatopallidal neurones to the lateral globus pallidus (Wooten, 1997). Furthermore, D2 receptors are negatively coupled to adenylyl cyclase, and are tonically inhibited by the action of dopamine (Stoof and Kebabian, 1984). Striatal D2 receptors are upregulated when dopaminergic neurones are damaged by lesions with 6-OHDA in rats (Gagnon et al., 1991), or MPTP in primates (Elsworth et al., 1998) and mice (Tanji et al., 1999). In addition, D2 receptors work interdependently with D1 receptors to produce locomotion in the basal ganglia (see Clarke and white, 1987 for review).
1.4 Glutamate receptors and PD
Glutamate is the most abundant free amino acid in the CNS. It is often referred to as a “mixed
agonist”, as it has the ability to stimulate several classes of receptors. Glutamate receptors are broadly classified as metabotropic or ionotropic. The ionotropic glutamate receptors are further divided into AMP A, Kainate and NMDA, named after the specific agonist compound eliciting a given physiological response.
1.4.1 Metabotropic glutamate receptors
Metabotropic glutamate receptors (mGluRs) are coupled to cellular effectors via GTP-binding proteins. At least eight mGluRs have been cloned (termed mGluRl-8), six of which (mGluRl- 5 and mGluR7) are expressed in the brain (see Pin and Duvoisin, 1995 for review).
Metabotropic glutamate receptors mediate inositol phosphate metabolism, release of
arachidonic acid, and changes in cAMP levels, depending on the type of cell and the receptor
subtype (Schoepp and Conn, 1993).
Metabotropic glutamate receptors have distinct localizations in the basal ganglia (Testa et al., 1994). Almost all striatal neurones express low levels of mRNA for mGluRl and mGluR4, and
moderate levels for mGluR3. The signal for mGluRS is intense in 75 % o f striatal neurrones, while the mRNA for mGluR2 is present in only 2 % of striatal neurones. Activation of mGluRs
Chapter One General Introduction 1.4.2 Ionotropic glutamate receptors
Unlike mGluRs, ionotropic glutamate receptors (iGluR) are not coupled to G-proteins, but are associated with ligand-gated ion channels. Activation of these receptors leads to a rapid
opening o f the channels to which they are associated (Greenamyre and Porter, 1994). Subtypes of this receptor include AMP A, Kainate and NMDA receptors.
1.4.2.1 AMPA receptors
Glutamate or AMPA bind to this receptor, and gives rise to NA^ ( but not Ca^^) influx from the extracellular to the intracellular compartments, mediating fast excitatory neurotransmission in the CNS (Greenamyre and Porter, 1994). AMPA receptor subunits were the first of the glutamate receptors to be cloned (Hollmann et al., 1989). Four o f these units exist, GluRl- GluR4, having an ability to assemble in various combinations to form functional receptors whose characteristics depend on the constituent subunits (Ciliax et al., 1997). For instance, combinations involving GluR2 prevent, while GluRl and GluR3 permit Ca^"’ permeability (Hollmann et al., 1991). An additional complication in the study of the characteristics of particular AMPA receptors is the occurrence o f splice variants (termed “flip” and “flop”) for each of the four subunits (Sommer et al., 1990). GluRl is found colocalized with DA D1 receptor patches in the human ST (Ciliax et al., 1997). It is also found in the globus pallidus (internal and external segments), the STN and in the SN (pars reticulata and pars compacta). Neurones rich in GluR2/3 have been found in the globus pallidus (internal segment), and SN (pars copacta and pars reticulata), whereas GluR4 containing neurones have been found in the substantia nigra pars reticulata.
1.4.2.2 NMDA receptors
Chapter One General Introduction
NMDA receptors are found throughout the basal ganglia. They are most abundant in the ST, but also occur in the globus pallidus, STN and SN (Albin et al., 1992). Activation of NMDA receptors, unlike AMPA receptors, is associated with increased Ca^^ permeability (alongside increased Na"" permeability) in the neurones. This increased Ca^^ permeability has been implicated for the toxic effects of the NMDA receptor (Beal et al., 1993).
The NMDA receptor has five distinct recognition sites, for glutamate, glycine, polyamines, Mg^^ and Zn^^. There is also a recognition site in the ion channel for drugs like phencyclidine
(PCP) and MK 801. The simultaneous occupation o f the glycine and glutamate sites is a prerequisite for NMDA receptor activation (Kleckner and Dingledine, 1988). Agonists at the polyamine site potentiate NMDA receptor function by reducing the tonic inhibition by protons under physiological pH (Traynelis et al., 1995). Polyamine site antagonists like ifenprodil and eliprodil are useful antiparkinsonian drugs (Starr et al., 1997). Ambient levels o f Mg^^ voltage- dependently block the flow of current through the receptor, even when the glycine and
glutamate sites are occupied (Nowak et al., 1984). This voltage-dependent bolckade of the receptor ion channel by Mg^^ is a unique feature of the NMDA receptor. The PCP site is the locus for the effects of the ion channel antagonists, with the prototype being MK 801 (Kemp et al., 1987). Drugs binding to this site prevent the opening o f the ion channel, and the influx o f calcium. The parkinsonian drug budipine is weak antagonist at this site (Klockgether et al., 1993).
1.5 Dopamine/Glutamate interactions in the treatment of PD
Chapter One General Introduction
In 1957, Carlsson et al. observed that the parkinsonian rigidity and akinesia induced by the depletion o f central DA stores with reserpine was reversed when these rats were treated with L-DOPA, but not 5-HTP. Papavasiliou et al. (1972) showed that this antiparkinsonian effect of L-DOPA could be potentiated by concomitant administration of peripheral DOPA
decarboxylase inhibitors. At present, DA replacement with L-DOPA remains the mainstay for treatment o f PD, despite the introduction of direct-acting DA agonists, MAO-B inhibitors, L-DOPA slow-release formulations, glutamate antagonists, cholinergic antagonists, and the experimental use of COMT inhibitors (see Poewe and Granata, 1997 for review).
Exogenously administered L-DOPA is rapidly taken up into the brain, following peripheral DDC inhibition, and is rapidly converted to DA by AADC in dopaminergic and 5-HT neurones (Arai et al., 1996; Hadjiconstantinou et al., 1993). The DA so formed is then released into the
extracellular space, under glutamatergic control (Biggs and Starr, 1997). DA also modulates its synthesis and release via presynaptic D2 autoreceptors (Sokoloff et al., 1990). The released
DA then restores locomotion by the simultaneous activation o f postsynaptic DA D^ and D2
receptors (see Clarke and White, 1987 for review). This DA-dependent mechanism by which exogenous L-DOPA reverses the parkinsonian conditions in experimental animals, has come under intense scrutiny in recent times for a variety o f reasons. A major reason for this is the
observation that doses of L-DOPA which induce a large efflux of DA into the extracellular space (25-50 mg/kg), do not correspond to doses which activate locomotion in DA-depleted animals (Biggs et al., 1999b). Furthermore, L-DOPA can increase DA synthesis, as indicated by increased DOPAC output, without a corresponding increase in DA levels in dialysates from microdialysis experiments (Fisher et al., 2000; Wachtel and Abercrombie, 1994). In addition, L-DOPA inhibits AADC, the enzyme necessary for its conversion to DA, an effect that can be overcome by the use of glutamate antagonists (Fisher et al., 1998). The growing body of
evidence suggests that L-DOPA can reverse drug-induced parkinsonism by mechanisms independent of dopamine (Fisher et al., 2000; present study).
Chapter One General Introduction
the synthesis of DA via AADC (Fisher et al, 1998b; Hadjiconstantinou et al, 1995), both compounds regulate each other’s release in the SN and entopeduncular nucleus (Biggs and Starr, 1997). NMDA antagonists have been shown to potentiate the antiakinetic properties of L-DOPA in monoamine-depleted rodents (Klockgether and Turski, 1990), suggesting the use of these compounds as adjuncts to L-DOPA in the treatment o f PD (see Starr, 1995a,b for reviews).
Until recently, the exact mechanism by which glutamate antagonists facilitated L-DOPA- induced reversal o f parkinsonism was not known. Biggs et al. (1998) showed an increase in the amount (by approximately 300 %) and duration of DA released from a bolus dose o f L-DOPA, when the NMDA ion channel antagonist, budipine, was administered an hour before, but not after, L-DOPA. This priming of AADC by glutamate antagonists was confirmed in further experiments, where even the L-DOPA-induced inhibition of AADC was reversed by prior exposure to glutamate antagonists (Fisher et a l, 1998a,b). Thus, the glutamate antagonists will
not only depress the heightened glutamatergic tone in PD (see Fig. 1.1; Albin et al, 1989), but have the added benefit of stimulating the enzyme involved in maintaining endogenous DA
levels.
1.6 Regulation of AADC by DA and glutamate
Aromatic 1-amino acid decarboxylase is often associated with its traditional role o f catalyzing the second step in the synthesis of indoleamines and catecholamines in which 5-HTP, formed from tryptophan by tryptophan hydroxylase, and L-DOPA, formed from tyrosine by tyrosine hydroxylase, are decarboxylated by AADC to yield 5-HT and DA respectively. AADC is well distributed in the CNS as well as in the periphery. Immunoreactivity for the enzyme overlaps with sites which use catecholamines or indoleamines as neurotransmitters. High levels of AADC activity have been detected in the ST, SN and locus coerulus (Hadjiconstantinou et al,
Chapter One General Introduction
When nigrostriatal DA is reduced by 95-98 % with 6-OHDA lesions, approximately 15 % of AADC activity remained (Opacka-Juffry and Brooks, 1995). This is similar to PD patients, where AADC activity has been found to be between 5 and 15 % in the basal ganglia (Lloyd et al., 1975). These effects can be adduced to the loss of dopaminergic neurones, which are the principal carriers of AADC. Alternatively, when DA levels are depleted by reserpine
(Hadjiconstantinou et al., 1993; present study), or dopaminergic tone removed by DA receptor antagonists (Zhu et al., 1992; 1993), AADC activity is known to increase. This suggests an inhibitory role for endogenous DA, that is mediated by presynaptic D2 receptors (Sokoloff et
al., 1990; Zhu et al., 1992). DA receptor agonists and L-DOPA, on the other hand, have been shown to reduce AADC activity (Rosetti et al., 1990; Biggs et al., 1998; present study).
The glutamatergic control of AADC activity was demonstrated by Hadjiconstantinou et al. (1995), when they showed an increase in AADC activity after treatment with the glutamate antagonist, MK 801. Research in our laboratory has confirmed these findings (Biggs et al.,
1998; Fisher et al., 1998a,b). Our results also show that the inhibitory effect o f L-DOPA on AADC activity, can be reversed by the use of NMDA and non-NMDA antagonists. The effect of glutamate antagonists on AADC activity provides a mechanism for the actions for the adjunctive use of the glutamate antagonists, amantadine and budipine, in antiparkinsonian therapy.
5-HTergic neurones can form DA from exogenous L-DOPA (Arai et al., 1994; 1995a), and 5-HTP can be decarboxylated on dopaminergic neurones (Arai et al., 1995b). These findings, and the occurrence o f unique protein isoforms of the AADC protein tend to suggest that more than one AADC enzyme exists (O’Malley et al., 1995; Zhong et al., 1995). Further grounds for the proposed two-enzyme structure for the decarboxylation of L-DOPA to DA and 5-HTP to 5-HT are covered by the differential mechanisms of phosphorylation o f AADC by dopamine
Chapter One General Introduction
this study will be presented as differential effects on 5-HTP decarboxylase and DOPA decarboxylase.
1.7 Models of PD
A variety of animal models have been developed over the years to facilitate the study of
Parkinson’s disease. The object of such models has been to (1) enable the reliable screening for potential new drugs; (2) elucidate the mechanism of action of these agents and (3) to clarify the pathophysiology o f the corresponding human disease. The existing models have made remarkable success on the first two counts as they were instrumental to the development of anti-parkinsonian drugs and are beneficial in predicting possible anti-parkinsonian activity of new agents. In addition, they have proved useful in identifying the mechanism o f action of dopaminergic agonists (Kaakkola and Teravarinen, 1990). Apart from the discovery o f the profound DA depletion in the basal ganglia of PD patients, not much progress has been made on the third count. It will be the thrust of an accomplished model to incorporate the virtues of the existing models, provide satisfactory explanation for the cause of neuronal cell death, and present mechanisms for the progression of the disease. It is hoped that when this is achieved, the now elusive cure for the disease will be in sight.
In the last half o f the twentieth century, giant leaps were made in the understanding and therapy o f PD. The ability of L-DOPA to reverse the akinesia following DA depletion with reserpine (Carlsson et al., 1957), was a major step in this process. A survey of the older
models reveals three broad classes; the cholinergic agonists, the neuronal lesion models and the brain monoamine depleters. While some of these models have undergone significant and
positive metamorphosis over the years, others have become either limited in use or completely
obsolete.
1.7.1 Cholinergic agonists
Chapter One General Introduction
tremor as one of the classical clinical features o f the disease. However, it was found that the tremor induced by cholinergics resembled more a condition of cholinergic intoxication than parkinsonian tremor (Duvoisin, 1976). It was also found that large doses o f cholinergic drugs given to rodents induced catalepsy, including akinesia, an ability to maintain an abnormal posture, and often, rigidity. The intensity of catalepsy was quantified, and its inhibition by muscarinic antagonists (e.g. atropine) was used as an indication of their central activity (Zetler,
1968). The benefits offered by this group of models in current research in PD are grossly limited.
1.7.2 Neuronal lesions
The neuronal lesion model was advocated by Poire et al (1966), when they caused resting tremor and hypokinesia in the monkey by electrocoagulative lesion o f the ventromedial tegmentum (as a lesion limited to the substantia nigra of the monkey caused hypokinesia, but not tremor). The method was limited by the fact that it destroyed dopaminergic cells along with other nerve cells and tracts located in the lesioned area. A similar lesion o f the rat
striatum produced an ipsilateral turning tendency in the animal and allowed evaluation of drug effect on the intact contralateral nigrostriatal dopaminergic system (Ungerstedt, 1973).
Nonetheless, it remained non-selective and did not produce the specific neuronal changes observed in the human condition.
1.7.2.1 6-hydroxydopamine lesions
Further progress was made with the neuronal lesion models when 6-OHDA was injected intracerebrally or intraventricularly to produce a degeneration o f brain dopaminergic or noradrenergic neurones (Ungerstedt, 1968). Injecting 6-OHDA intothe SN produced a selective, stable and permanent destruction of dopaminergic neurones, leading to hypokinesia (Ungerstedt, 1971a). Because the animals died of aphagia and adipsia when the toxin was bilaterally administered to both substantia nigra (SN), the procedure was modified to the use o f a unilateral administration (Ungerstedt, 1971b). Following the administration o f
Chapter One General Introduction
(BngeSSSt^^nc^W^xpIânânSîHoSRs^^BâRîHmBâlânc^îulî^ctîvît^êtwêêrHIî?
dopaminergic systems of the left and right sides results in circling: the animal circles away from the side of higher dopaminergic activity. Consequently, the Ungerstedt model has become the appropriate method for assessing the anti-parkinsonian activity of new compounds, as well as for predicting the potential dopaminergic feature of a new agent; as a compound acting directly (postsynaptically) causes contralateral circling behaviour whereas a compound acting indirectly causes ipsilateral rotations (Kaakkola and Teravainen, 1990). In addition, the
significant pitfall of a lack of selectivity in the original model of Ungerstedt was overcome by a recent modification in which only the nigrostriatal dopaminergic neurones are destroyed by 6-OHDA, using an accurate stereotactic technique (Perese et al, 1989). However, the lesions produced by the 6-OHDA models do not mimick the widespread pathology and biochemistry of idiopathic PD and the animals do not exhibit the spectrum of motor disorders associated with the disease (Jenner and Marsden, 1988).
Quite recently, a novel genetic animal model based on the circling behaviour observed in the Ungerstedt rat has been developed (Loscher et al, 1996). While this ci mutant rat presents a useful tool for the study of endogenous processes that lead to motor dysfunctions (i.e. without induction by exogenously administered neurotoxins), the observed locomotor hyperactivity raises question as to whether it represents a model of hyperkinetic or hypokinetic movement disorder, such as PD.
1.7.2.2 MPTP lesions
So far, the most significant contribution to the search for the ideal animal model for
parkinsonism over the last two decades was the discovery o f the selective nigral toxicity o f 1-
Methyl-4-phenyl-1,2,3,6-tetrahydropyridine (MPTP) (Langston et al, 1983). Until recently, the MPTP-induced parkinsonian monkey was thought to be the best available model o f PD
(Kaakkola and Teravainen, 1990). When administered peripherally, the lipophilic MPTP molecule enters the brain, where it is selectively metabolized by MAO-B located in