ISSN (e): 2250-3021, ISSN (p): 2278-8719
Vol. 08, Issue 12 (December. 2018), ||V (III) || PP 01-09
A machine learning Approach for Maximizing Ride Shared Route
Using IABFM Framework
Dr. R Priya
1, Dinu Mol Philip
2Associate professor Department of computer science Sree Narayana Guru College Coimbatore, Tamil nadu, India1
M.Phil Scholar, Department of Computer Science, Sree Narayana Guru College, Coimbatore, Tamil Nadu, India2
Corresponding Author:Dr. R Priya
Abstract:
Over the concept of Ride-Sharing (RS) is very important valuables of environment because it saving energy and destroy the traffic pressure or traffic congestion. In this paper, we propose a new model for maximizing the shared route. In this model, where each driver or rider requests, that driver shares a ride with a rider, and shared route percentage increased expectation rate of the driver. Shared route percentage is nothing but the radio of the shared route‟s distance to the driver‟s total distance. It proposes the best-first algorithm that it selected the drivers with high probability to be in the top-k results. Then, the drivers are already pruned, but that cannot be in the top-k results. The system introduces a new novel Active_seg model to gathering, defining and representing the uncertainty of trajectory. The best-first method implementefficiently compute the top-k drivers for a rider. The existing Ride-Sharing Framework is difficult in handling problem of Join-based and Search based RS large Spatial Network datasets. It is very important challenged to achieve Maximizing Shared Route efficiency, to address this problem the system introduces an IABFM Ride-Sharing Framework.Keywords:
Ride sharing, Combine BV Edges, IABFM, Active_seg.--- --- Date of Submission: 29-11-2018 Date of acceptance: 13-12-2018 ---
---I.
INTRODUCTION
Ride-sharing means, generally sharing economy. Its aim is to improve the resource utilization by sharing resources for multiple users (riders, drivers). These shared resources include place facilities, city or urban trip, etc. In this paper is mainly focus on the problem of ride-sharing that is RS oriented problems. So, it is a new service called, namely “hitch”. The hitch service describes, there are more number of part-time drivers are to share vehicles, but that‟s theme is, to share the vehicle with rider, that is share the vehicle between source to destination. If first the driver shares the vehicle with rider in source, then the rider from rider‟s source shares with drivers, which is called the shared route between the driver and rider. Finally, drive to destination of drivers from rider‟s destination with vehicle sharing. The SRP is calculated, and it takes the distance values from the radio of shared-route distance to total route distance, that is sum of distances of three parts. The driver must drives on the road networks, so if we take the road-network distance and temporary assigns, the driver will select the shortest route between two locations that are values of distances. The driver requests the SRP value exceeds on expected value to supports a high sharing utility. There are two types of the RS problem are, (i). Join-based RS: To computes the driver-rider pairs that maximizes the overall SRP values, it based on group of drivers and riders. In this type, is suitable for peak-time traffic, so this time numbers of riders and drivers are join-based matching (traffic jam), it is a one reason of this problem. (ii). Search-based RS: To computes top-k drivers for rider with large SRP values based on group of drivers and riders. In this type, use one-by-one serving mode, so each rider expects instant response. In this RS type of problem is use for various, which means the Search-based RS optimize the global matching for all riders. In this problem angled with another way is, (a) the drivers and riders did not have the travel requirements. (b) To maximize the number of served riders, then to maximize the overall resource sharing by both driver and rider. So it is problem reason for drivers same resource owners demands for higher resource sharing rate, that is vehicle sharing.
II.
PROBLEM DEFINITION
various constraints and these constraints is maximize the overall profit. The main aim of this system is satisfy the user‟s request that is driver needed routes. It is reducing the both driver-rider travelling distances. In this concept is to reduce the cost that is it based on low cost motive. This system is simultaneously satisfies the driver-rider requirements and use the correct formula for correct solution. It introduces the distributed auction-based framework and this framework is makes the drivers mobile application. In this application is automatically finds out the drivers-riders profiles, travelling distances, travelling cost and currently available number of riders in the vehicle. Then, the server describes the highest bidder and that server assigns the rider to driver. It is an important because it which includes the scalable and efficient and it processing is very fast. Finally the system is simultaneously assigns and matching the riders to drivers and gets better results. So, this framework is increase the overall cost that is profit.
In [2] Ece kamar, Eric Horvitz presents the concept namely, “Collaboration and shared plans in the Open World: Studies of Ridesharing”. This concept is develops the ridesharing, but it based on the collaborative and shared plans. This system is gives or sharing the route planning. In this system is minimizing the transportation cost. In this system is includes the planning, optimization and payment mechanisms and it provides the efficient and accurate solutions. It evaluates the different VCG-based payment schemes and its related terms (i) computational efficiency, (ii) budget balance, (iii) incentive compatibility, (iv) strategy proofness. In this system presents the behavior and analyzes provided by the ABC ridesharing prototype system. This system finds out the destinations and preferences are got from GPS traces and the calendars and it consider the time, fuel, environmental and cognitive costs. The ABC generates the ridesharing plan. The ride-sharing plans are gets from hundreds of real-time collected GPS traces. The ABC method is to reducing the number of vehicles on the road and CO2 emissions.
In [3] leyla et al. presents the concept namely, “GeoCrowd: Enabling Query Answering with Spatial Crowdsourcing”. In this concept is enables the spatial tasks. In these types of task is assigned and performed in this tasks related working area. The crowdsourcing is supports the taxonomy and it maximizing the overall number of assigned tasks. This type of assigning is called Maximum Task Assignment (MTA). The crowdsourcing is identifies the MTAs problem and its challenges. Finally it verifies the applicable methods and it measures the both the number of assigned tasks and calculates the travel cost.
In [4] Pedro M. d‟Orey, Ricardo Fernands and Michel Ferrreira presents the concept namely, “Empirical Evaluation of a Dynamic and Distributed Taxi-Sharing System”. In this concept is gives the opportunity for the efficient transportation systems, these system is used for the standard mobility. It supports and performs the large-scale and experienced evaluation of the dynamic and distributed taxi-sharing system. Then the novel system is gives the advantages like communication availability, computation, cost-efficient, door-to-door that is peer-to-peer and the flexibility system. It offers the service quality based on traditional taxis. The shared taxi is accessed the real city by using the highly simulation platform area. In this system is to provide the merits like passengers and taxi driver requests satisfaction and adjustments the routes communication. It gives the 48% of occupancy travelled kilometers in taxi-sharing system. This system uses some distributed methods and algorithms and it mainly follows the simulation methodologies.
In [5] shiyou et al. presents the concept namely, “Smart Recommendation by Mining Large-scale GPS Traces”. This system is main goal is satisfies the user requirements. It uses some methods for trace out the locations using GPS system. The GPS trace out the location from the given datasets. These datasets are got from the large number of urban taxis. The system is extracts the vehicle mobility pattern. The optimal driving process is using Markov Decision Process (MDP). Finally this system is solves the MDP problem and that gives the smart recommendation for the taxi drivers. It follows the LCP and RS methods about the 25% and 50%. But the LCP method is does not globally optimal.
In [6] shuo et al. presents the ride sharing concept, “T-Share: A Large-Scale Dynamic Taxi Ridesharing Service”. The taxi ridesharing is the important and beneficial term of social and environmental side. In this system proposes the large-scale taxi ridesharing service and this concept based advantages is given. It reduces the total travel distances and improves the lowest travel cost that is it refers the shortest path routing method. In this system is proposes the taxi ridesharing algorithm and it uses the spatio-temporal index for fast retrieval. It retrieves the candidate taxis and the user-query is satisfied. It additionally used and it apply the scheduling algorithm and it checks the candidate taxi and then, inserts the query trips. The taxi schedule is satisfies the user queries and includes the minimum travel distance. The shortest path routing method is speedups the scheduling algorithm. In this system concept evaluating process is generates the dataset by using the GPS. The spatio-temporal distribution is gives the required data by using the user query that is satisfies the user query. Finally it gives the (i) efficiency, (ii) effectiveness, (iii) scalability.
In this processing is based on ridesharing, subject to time, capacity and some constraints basis. The constraints is provides the offers for both passengers and the drivers. The riders and drivers use the taxi-sharing services. These services are provided by the system through smart phone application. Then, the cloud is first finds out the candidate taxis fastly. The taxi ride request is using the taxi searching algorithm supported the spatio-temporal index. Scheduling process is performed in the area of cloud and it is to selects a taxi requests then satisfies the ride requests. But it minimum level increases the travel distances. The ride generator is retrieves the ride requests from the dataset.
In [8] yongxin et al. presents the spatial data oriented concept namely, “Online Minimum Matching in Real-time Spatial Data: Experiments and Analysis”. In this concept is recently presented concepts and this concept is developed in the mobile internet and the smart phones. The OMBM is the problem in real time spatial data the OMBM is Online Minimum Bipartite Matching. It using a set of service providers with the specific locations basis and then using a set of users. The OMBM problem means un-matching service provider problem. In this system is to finds out the maximum-cardinality matching with the minimum total distance. So this system is easily matched the unmatched service provider but it cannot recovered, before time the user schedule is formed. It mainly uses the greedy methods, it is very effective. Finally, this system is solves the OMBM problem.
In [9] yaxiao et al. presents the concept namely, “ELAN: An efficient Location-Aware Analytics System”. This system aim is provides the users with the location-aware data analytics services. In this system performs step by step. The user selects the spatial region that is particular spatial area. In this system is identifies the important functionality and important features and then, it analyzing the User-Generated Content (UGC) inside the region. It calculates the spatial region or boundary it is called the functional region. This systems basic concept is based on many real-world applications. It contains the large amount of location-based spatial data. So this system easily zoom in, zoom out and then panning the map in the region. It proposes the spatio-textual indexes and it is an incremental algorithm and uses the spatial data so apply the algorithm, it is to supports the location-aware data analytics.
III.
PROPOSED SYSTEM
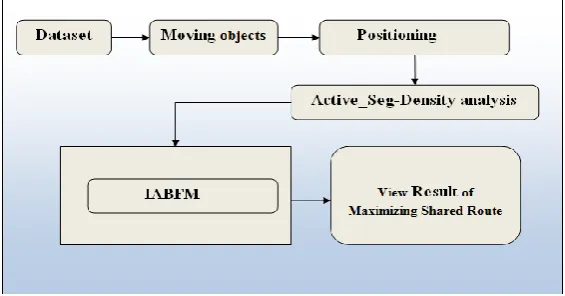
The chapter discusses about the proposed methodology and the steps involved in this proposed system. The system proposes a new effective Framework called as Improved Approximate along with Best-First Model (IABFM). This chapter discuss about the algorithms and methodologies. The system implements a new Improved Approximate algorithm for efficiently compute the driver-rider pairs with any given approximate rate. The system introduces a new novel Active_seg model to capturing, summarizing and representing the uncertainty of trajectory. The best-first method implementefficiently compute the top-k drivers for a rider.
Figure 3.1 Proposed system architecture
Contribution of the Proposed Work
The followings are the contributions of the proposed system.
The existing Ride-Sharing Framework is difficult in handling problem of Join-based and Search based RS large Spatial Network datasets. It is very important challenged to achieve Maximizing Shared Route efficiency, to address this problem the system introduces an IABFM Ride-Sharing Framework.
Best-first unit has been applied efficiently compute the top-k drivers for a rider.
Pearson distribution Model has been used for object‟s location prediction using Pearson distributions.
IV. METHODOLOGIES
Through an experimental evaluation on a large spatial data set, that shows the effectiveness of proposed system, the results also show that the proposed algorithm provides a very good ride-sharing efficiency. The chapter discusses about the methodologies included in the Proposed System. Here with list of following methodology explains in this chapter.
1. Active_seg model
2. Positioning process 3. Pearson distribution
4. Improved Approximate algorithm
5. Best-first unit
1. Active_seg model.
The first contribution of our proposal is to introduce a new uncertain trajectory management model that represents a trajectory as time-dependent Pearson distributions. In each such distribution, skewness and kurtosis values are acquired with the mean value to represent an actual location, while the standard deviation reflects the degree of an uncertainty range. This model can effectively capture the dynamicity of location uncertainty without any unrealistic assumption, while facilitating efficient query processing. This also provides a flexible framework that allows various approaches including domain-specific models to precisely infer such evolving normal distributions. In the consequence, this introduces a set of key principles that establish the new uncertainty model, and then describe the system framework that supports the model.
2. Positioning process
In order to reduce the noisy data there are several filtering schemes are applied in for GPS data, for network constrained object locations. These approaches provide means that can infer more reliable positions where an object was actually located by eliminating the noisy and redundant data‟s. The Active_seg model supports such an inferred location as an actual location of the object and helps to predict the future move based on the vector, which serves as the center point of an uncertainty range. This computes the probability distribution of an object‟s position at each time by taking the current position. Specifically, this component takes a certain number of recent positions in a trajectory, and infers a Pearson distribution at a current time.
After finding the missing position of each object, the Active-seg performs the search process. Finally the approach performs the spatial query on uncertain moving object databases the following algorithm represents the steps involved in the query processing.
Algorithm: Active_seg- Query Processing Steps
1: 𝜖𝜌← 𝐿𝑜𝑐𝑎𝑡𝑖𝑜𝑛𝑃𝑜𝑖𝑛𝑡 𝜌
2: 𝜖𝑡 ← 𝑇𝑖𝑚𝑒 𝑡
3: 𝜖𝑞 ← 𝑞𝑢𝑒𝑟𝑦 𝑞
4: 𝜖𝜌
𝑡 𝑠𝑒𝑟𝑣𝑖𝑐𝑒𝑠 𝑠 − 𝑒𝑥𝑡𝑟𝑎𝑐𝑡 𝑠𝑒𝑟𝑣𝑖𝑐𝑒𝑠 𝑏𝑎𝑠𝑒𝑑 𝑜𝑛 𝑡ℎ𝑒 𝑠𝑝𝑎𝑡𝑖𝑜
𝑡𝑒𝑚𝑝𝑜𝑟𝑎𝑙 𝑑𝑒𝑡𝑎𝑖𝑙𝑠
5: 𝐟𝐨𝐫 each service s in SI_Tree ∈ node 𝐝𝐨 6: 𝑖𝑓 𝑇𝑖 𝑖𝑠 𝑛𝑜𝑛 𝑙𝑒𝑎𝑓 𝑖𝑛 𝑇
7: 𝐜𝐡𝐞𝐜𝐤 𝐓𝐢 ∈ 𝜖𝑡− temporal verification
8: 𝑠𝑝𝑎𝑡𝑖𝑎𝑙𝑄𝑢𝑒𝑟𝑦 𝑞, 𝑟𝑞,𝑡𝑞,𝑇𝑖 – spatial query passing based on the
parameters 9: 𝒇𝒐𝒓 𝑒𝑎𝑐ℎ 𝑛𝑜𝑑𝑒 𝑒𝑛𝑡𝑟𝑦 𝑇 ∈ 𝑇𝑖 𝒅𝒐
10: 𝒊𝒇 𝐴𝑞𝑡 ≤ 1 𝐭𝐡𝐞𝐧 − get a single record
11: 𝑟𝑒𝑠𝑢𝑙𝑡 ← 𝑇𝑟𝑎𝑗𝐻𝑎𝑠ℎ[𝐴𝑞𝑡]– store in the hash table
12: 𝑒𝑙𝑠𝑒 𝑐𝑎𝑙𝑐𝑢𝑙𝑎𝑡𝑒 𝑏𝑠𝑐𝑜𝑟𝑒 ()
𝟏𝟑: do the step 4 and store the result ← 𝑇𝑟𝑎𝑗𝐻𝑎𝑠ℎ 𝐴𝑞𝑡 − get a multiple record
𝟏𝟒: Result ← 𝑇𝑟𝑎𝑗𝐻𝑎𝑠ℎ_𝑅[𝐴𝑞𝑡]
3. Pearson distribution
1. This is used to describe the distribution of the sample mean, which is a collection of samples from normal populations. To Describes the distribution of the sample mean, it which is the collection of samples from a population that is not normal.
The normal distribution of a statistic is a probability distribution for all possible values of the statistic computed from a sample of size n. Here the sampling distribution of the sample mean is the probability distribution of all possible values of the random variable, which are computed from a sample of size n from a population with mean and standard deviation.
The followings are the steps involved in the density calculation function to handle uncertainty.
Steps:
Step 1: Obtain a random sample of size n.
Step 2: Compute the mean.
Step 3: Assuming that the sample from a finite population, repeat Steps 1 and 2 until all simple random samples of size n have been obtained.
An estimated the sampling distribution of the sample mean by obtaining 200 simple random samples of size n = 20 from the population of weights of pennies minted after 1982 (=2.46 grams and =0.02 grams)
Fig:3.2 probability distribution using Pearson
The value of mean is give 200 sample means for n=20 is still 2.46, but the standard deviation is now 0.0045 (0.0086 for n=5). The expectation of the values, there is less variability in the distribution of the sample mean with n=20 than with n=5. Suppose that a simple random sample of size n is drawn from a large population with mean and standard deviation.
4. Improved Approximate algorithm
This algorithm performs and efficiently computes the driver-rider pairs with any given approximate rate. These steps are list out step by step.
Input: R: The riders set details, D: The driver set details G: The road network information
tro: minimum SRP of all drivers r: bigraph bound threshold
Output: LB(P): the approximate answer of P* Step 1: Begin
Step 2: Create the partition-based road network index; Step 3: Build upper/lower bound bigraphs: g^U, g^L; Step 4: Compute UB (P) and LB (P);
Step 5: while LBM > r and g^L has not-updated edges do Update h crucial edges in g^U and g^L;
Compute UB (P) and LB (P); Step 6: if UB (P)/ LB (P) < r then Step 7: return LB (P);
Return Exact Jo in(R, D, G (V, E)); Step 8: end
5. Best-First Method
A best first method which effectively utilizes boundaries to recognize the best drivers that have much high probabilities in the top-k results.
Input: ri: a rider, D: the drivers set, G (V, E): the road network
Output: CI: the top-k matching drivers Step 1 Begin
Step 2 Cj = CANDIDATESETGEN (D. G (V. E) Step 3: Vdi E di, compute UB (di) and LB (di); Step 4: Prune all drivers de having LB (di/) > UBk; Step 5 for each unpruned di by LB (di) ascending order do Step 6 if LB (di) >total distance by driver Qk then Step7 L breaks;
Step 8 else
Step 9 if r (di, r j) > Qk and r (di, RI) > RI then Return Cjk";
End
V.
RESULT AND ANALYSIS
Data Sets
The experiment uses the synthetic data sets for experiments. The proposed experiment result exactly shows the difference between the existing systems such as ride-sharing model and our proposed IABFM Framework. The system can have n number of tuples for experiments and SQL Database server 2008 has been used for the effective data storage.After the synthetic data set is generated, and given the number of m local sites, each tuple from the synthetic uncertain database D is assigned to site Si chosen uniformly. Clearly, all local sites have the same data distribution. In particular, a local site server keeps a random sample set of the underlying data set, and the sample sets are mutually disjoint. In the experiments, every local server possesses an equal number of points, named the local cardinality.
Figure 5.1: GPS dataset
The system has used Visual Studio.Net framework. And C#.Net has been used for developing the front end and SQL Server for the back end. The reason for using C#.Net is its flexibility. This can add or remove any features without editing the whole code. This separated the standalone functions like port matching and IP address matching in separate functions which are reused again and again. For the back end this needed a freely distributed and powerful database so SQL Server was a good choice.
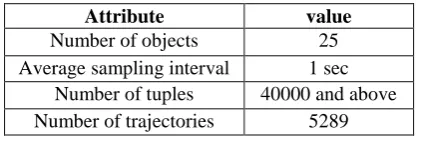
Attribute value
Number of objects 25
Average sampling interval 1 sec
Number of tuples 40000 and above
Number of trajectories 5289
Table 5.1: summary of the datasets
Results and discussion
Active_seg on sample road networks, namely, dynamic Maximizing Shared Route map and the final set of experiments.
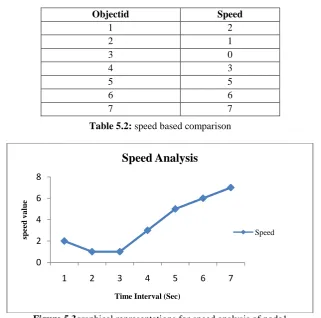
The above figure represents the object mobility at every transaction. The above figure calculates the speed of every object and finds the Maximizing Route.
Speed Analysis:
This section evaluates the proposed route network with dynamic trajectory data framework in terms of both indexing overhead and storage performance. We applied Route Net on sample road networks, namely, dynamic route map and the final set of experiments.
Table 5.2: speed based comparison
Figure 5.3graphical representations for speed analysis of node1
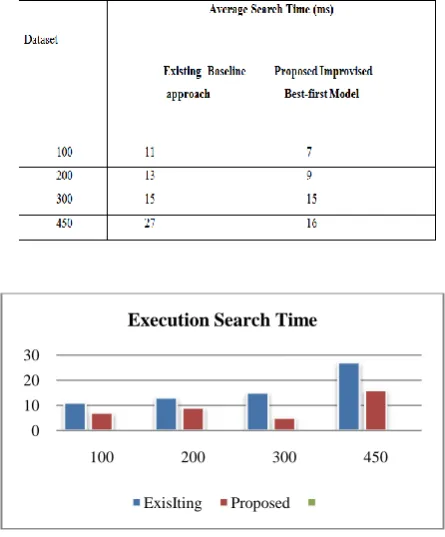
Performance Evaluation
For the experiment, An Intel I3 2.2 GHz processor with 4 Gb RAM was used to measure the execution time and detection speed. Table 1.1 tables set the execution time for varying dataset values and Table1.2 gives the speed for varying dataset value.
Table 5.3 Tabulation for Execution Time 0
2 4 6 8
1 2 3 4 5 6 7
sp
ee
d
v
a
lu
e
Time Interval (Sec)
Speed Analysis
Speed
Objectid Speed
1 2
2 1
3 0
4 3
5 5
6 6
Table 5.4 Tabulation for Search-basedRS efficiency
Measurement of Execution Time to search Base Rs Shared route Accuracy
Figure 5.4: Accuracy Comparison between IABFM and existing techniques
VI. CONCLUSION
Our proposed work re-modulates the existing trajectory models to handle the uncertainty management. The system successfully proposed a new and effective approach IABFM to achieve Maximizing Shared Route efficiency. This proposed the Active_seg trajectory model that represents a trajectory as time-dependent Pearson distributions, and it performs the segmentation for non-uniform distributed trajectories. Then Improved
0 200 400 600 800 1000
1000 3000 5000
Execution Time
ExisIting Proposed
0 10 20 30
100 200 300 450
Execution Search Time
ExisIting Proposed
75 80 85 90 95
Accuracy
Accuracy Comparison Chart
Approximate algorithm has been applied for the effectively compute the driver-rider pairs with any given approximate rate.Best-first search unit has been applied efficiently compute the top-k drivers for a rider. Finally we evaluate our proposed framework with different metrics it gives best result in terms of different dataset. Experimental study on real-world datasets demonstrates the effectiveness and efficiency of our algorithms. In order to check the effectiveness of the proposed model can be extended with some other dynamic data set in future. Every research application has its own merits and demerits. This research work has exposed almost all the necessities. Further improvements can easily be done since the coding is mainly structured or modular in nature. Changing the existing modules along with new technique or adding new research modules can append improvements. Further enhancements can be made to the application, by expanding the existing modules in detail. In this future extend our method to effectively hold up dynamic settings where drivers and riders are dynamically coming.
REFERENCES
[1]. Asghari, Dingxiong Deng, Cyrus Shahabi, Ugur Demiryurek, Yaguang Li. “Price-aware real-time rides-sharing at scale an auction-based approach”. Proceedings of the 24th ACM SIGSPATIAL International Conference on Advances in Geographic Information Systems. ACM, 2016.
[2]. Ece kamar, Eric Horvitz. “Collaboration and shared plans in the Open World: Studies of Ridesharing”. IJCAI. Vol. 9. 2009.
[3]. Leyla Kazemi, Cyrus Shahabi. “GeoCrowd: Enabling Query Answering with Spatial Crowdsourcing”. Proceedings of the 20th international conference on advances in geographic information systems. ACM, 2012.
[4]. Pedro M. d‟Orey, Ricardo Fernands, Michel Ferrreira. “Empirical Evaluation of a Dynamic and Distributed Taxi-Sharing System”. Intelligent Transportation Systems (ITSC), 2012 15th International IEEE Conference on. IEEE, 2012.
[5]. Shiyou Qian, Yanmin Zhu, Minglu Li. “Smart Recommendation by Mining Large-scale GPS Traces”. Wireless Communications and Networking Conference (WCNC), 2012 IEEE. IEEE, 2012.
[6]. Shuo Ma, Yu Zheng, Ouri Wolfson. “T-Share: A Large-Scale Dynamic Taxi Ridesharing Service”. Data Engineering (ICDE), 2013 IEEE 29th International Conference on. IEEE, 2013.
[7]. Shuo Ma, Yu Zheng. “Real-Time City-Scale Taxi Ridesharing”. IEEE Trans. Knowl. Data Eng. 27.7: 1782-1795. (2015).
[8]. Yongxin Tong, Jieying She, Bolin Ding, Lei Chen, Tianyu Wo, Ke Xu. “Online Minimum Matching in Real-time Spatial Data: Experiments and Analysis”. Proceedings of the VLDB Endowment 9.12: 1053-1064.(2016).
[9]. Yaxiao Liu, Henan Wang, Guoliang Li, Junyang Gao, Huiqi Hu, Wen-Syan Li. “ELAN: An efficient Location-Aware Analytics System”. Big Data Research 5: 16-21. (2016).