ISSN (e): 2250-3021, ISSN (p): 2278-8719
Vol. 08, Issue 8 (August. 2018), ||V (IV) || 88-96
A Novel Approach for Voice Activity Detection Using Noise
Energy from Spectrum
K. Hari Surya Kumari
1, S. Suresh Kumar
2 1M.Tech Scholar (Systems And Signal Processing), Department Of ECE,
2Assistant Professor, Department Of ECE, DADI Institute Of Engineering &Technology, Anakapalle,
Visakhapatnam, A.P, India.
Corresponding Author: K. Hari Surya Kumari1
Abstract:
In this paper, unified framework for voice activity detection (VAD) and speech enhancement is proposed. In the proposed framework, there is common import of data amongst VAD and speech enhancement blocks. Another and robust VAD algorithm is actualized for the VAD block of the brought together framework. The recently proposed VAD algorithm utilizes a periodicity measure and a vitality measure got from phantom vitality circulation and otherworldly vitality distinction of the info speech information. For the speech enhancement block, the changed Kalman filtering (MWF) approach is used. It has been demonstrated that the usage of data trade between the VAD and MWF algorithms in the brought together framework builds the execution of the two algorithms and the proposed bound together framework enhances the robustness of a speech acknowledgment framework essentially. Both of the improved algorithms are no iterative. Consequently, the proposed brought together framework is computationally appealing for continuous applications.Keywords
: Speech enhancement, voice activity detection, noise suppression, Kalman filter--- Date of Submission: 06-08-2018 Date of acceptance: 23-08-2018
---I.
INTRODUCTION
VOICE activity detection is an imperative advance in speech processing applications, for example, range vitality, speech coding and speaker acknowledgment. Voice activity detection approaches comprise of highlight extraction and segregation models. Early voice activity indicators (VADs) focused on robust highlights of a flag, for example, vitality, periodicity, flow and zero-intersection rates, and construct their separation strategies with respect to heuristic models. Later VADs, while using a considerable lot of similar highlights, construct their separation in light of measurable models. Normal factual model based
VAD is tried one next to the other with a VAD portrayed by ITU G.729 Appendix II [8]. The execution testing is partitioned into two sections. The initial segment will assess the execution of the VAD algorithm under low SNR, and the second part will center around transient clamor detection in mix with the GMM VAD.
II.
RELATED WORK
Prior, a few algorithms have been proposed for following the commotion under loud conditions. Most conventional commotion estimators depend on the base insights (Martin 2001, Cohen 2002, Cohen 2003, Rangachari et al 2006, Erkelens et al 2008, Gerkmann et al 2011). Martin (2001) figured an algorithm for following the commotion in view of Minimum Statistics (MS). In this technique, the clamor flag is evaluated over a limited window by acquiring the base periodogram estimations of the loud speech. So as to repay the predisposition, the clamor range is increased by inclination factor. It is exceptionally delicate and the assessed commotion difference is twice bigger than the regular clamor estimator. In the event that the window length is too short, this technique lessens low vitality parts of the speech flag. This strategy comes up short when the commotion flag level is higher than clean speech flag. Cohen (2002) researched Minima Controlled Recursive Averaging (MCRA) strategy in which the commotion is assessed by averaging the past power range in view of smoothing parameter. For this situation, there is no hard choice about the speech nearness likelihood. Notwithstanding amid frail speech flag period, the clamor estimation is constantly refreshed. Smoothing is completed in time and recurrence spaces which make a solid relationship between's the speech nearness in neighboring recurrence receptacles of back to back edges. Thusly, this commotion estimator is computationally effective and robust regarding SNR. This has a capacity to rapidly take after the sudden changes in the commotion level. Cohen (2003) additionally enhances the MCRA strategy in view of speech nearness likelihood estimation for least following amid speech activity and induction of a predisposition pay factor. In this Improved MCRA (IMCRA) technique, smoothing and least following includes two cycles. The primary emphasis generally gives the voice activity detection in every recurrence container. In the second emphasis, smoothing and least following are done in view of the speech activity. Keeping in mind the end goal to decrease the speech spillage, it requires quite a while window for least following which restrains the capacity to track the sudden ascent in the clamor level (Cohen 2004, Cohen 2005). Rangachari et al (2006) depicted an algorithm which evaluates the clamor utilizing time-recurrence smoothing factors figured in view of Speech Presence Probability (SPP). The speech nearness likelihood is processed as the proportion of the loud speech control range to its neighborhood least. The processed neighborhood least is free of window length, which enhances the following rate when fast varieties happen in the commotion flag (Rangachari et al 2004). Erkelens et al (2008) gave the Minimum Mean Square Error (MMSE) based clamor estimation technique which lessens the speech spillage and takes into consideration speedier following when contrasted with MS based algorithms. In this, the clamor flag is evaluated by duplicating loud power by pick up capacities. This requires a hard choice on speech nearness likelihood in light of contingent gauge of the clamor periodogram by VAD. Also, it requires an inclination pay to enhance the greatest probability (Martin 2005). Gerkmann et al (2011) presented a clamor estimator which replaces the VAD by delicate speech nearness likelihood in view of the Gaussian dispersion. Because of this, it doesn't require inclination remuneration and security net. The execution of this clamor following algorithm somewhat gets enhanced than MMSE technique. This is computationally and memory savvy more effective. In this, the speech and commotion ghastly coefficients are Gaussian conveyed in which it is symmetric as for the mean esteem. This presents speech spillage due to non-stationary commotion conditions.
III.
METHODOLOGY
VAD algorithms operate by taking in a digitized audio signal, processing this signal, extracting particular features from the processed signal, passing the extracted features of the signal as parameters to a model that describes that feature in noise and in speech, and finally outputting the decision based on thresholds defined in the model. There are many different features that different VAD algorithms model, commonly used among them being Fourier coefficients, periodicity and zero- crossing rates. Similarly there are various models that VAD algorithms use to describe these features, some based on heuristics while others based on statistical models. Popular statistical models include Gaussian distributions and Laplacian distributions. Based on the decision rule defined in the model, the VAD outputs a flag to indicate the presence or absence of speech.
Block Diagram
Transient Noise Detection
It is hard to find a good definition for transient noise. In this work, a transient noise is defined as a non-stationary, relatively short (100 - 1500 ms), non-periodic and energy intensive sound pulse. A transient noise is assumed to have a steep amplitude envelope, yielding wide band frequency content [3].
A transient noise is difficult to detect, because of the random occurrence and the vast variation in characteristics of a transient noise. It is therefore difficult to model a transient noise with GMMs or other statistical methods. Using hidden Markov models (HMMs) [9, pp. 377–413] to model transient noise, would require a large amount of diverse training data. Even with such a training set, it is almost certain that there are transient noises not covered in the training set.
Trying to predict a transient noise is also difficult due to the random occurrence of a transient noise. But this could actually be used as a cue to detect transient noise. Assuming the use of linear prediction coefficients as feature, a high prediction error (residual signal) could indicate that a transient noise is present [4]. The method proposed in this work is not trying to model transient noise, in any way. But rather try to model the opposite of a transient noise, that is speech and speech. Assuming the models for speech and non-speech are accurate. A transient noise with high energy intensity and a wideband frequency content,
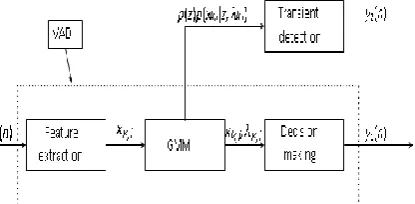
Figure 2: VAD with transient noise detection should not fit any of the statistical models very well, hence indicating transient noise.
Transient Noise Features
The GMM VAD provides a model for speech and non-speech, with estimates of mean values and variances of the energy in speech and non-speech. As a transient noise is defined in this work, a transient noise would not have any similar properties with the speech and the non-speech models.
As depicted in Figure 2 the TND algorithm extracts the likelihood of the current frame being speech and non-speech. Where k denotes the frame and i denotes the subband. The feature extraction happens in online mode. The transient noise detection is done in parallel with the VAD and the user decides how the outputs from the VAD and the TND are combined.
The likelihood ratio between speech and non-speech, should give an indication when a transient noise is present, where l is the number of GMMs. The denominator in equation (2), representing the total likelihood of non-speech, will become small when an energy intensive frame is present. This causes the ratio to become large and give an indication that a transient noise is present.
The probability distribution for speech is restricted in the algorithm to always have larger variance than non-speech. Making the probability density function (pdf) for speech wider than non-speech. Due to this, and the fact that the pdf for speech always have a higher mean than non-speech, the numerator will be larger than the denominator when an energy intensive frame occurs. Preliminary testing of the feature showed good results, but the feature did no manage to separate energy intensive voiced speech from transient noise. This happens because the variance of the non-speech model is small. When an energy intensive speech frame occur the denominator will become small and the feature indicates a transient noise.
Instead of using the likelihood ratio of the current frame, the inverse of the total likelihood
By summing the likelihood of both speech and non-speech should give a better indication of the presence of a transient noise. The likelihood of speech gives the same contribution to the feature as the likelihood of non-speech gives. In order to have a clear indication of a transient noise, both likelihoods have to be small.
where the right hand side is the probability that a random variable X takes a value less than or equal to x. The threshold, x, is put to a value where X has
high probability of taking a value less than or equal to x. Meaning there is a low probability that X takes values above the threshold.
Assuming a transient noise occurs relatively seldom, and that a transient noise induce a high value in the feature, the threshold is put where FX(x) is high, close to 1, to only find the feature values that have low
The length of the transient is hard coded into the algorithm. The transient noise detector is only able to indicate the start of a transient noise. In order to compare the output with the transcription, a fixed number of frames are marked as transient noise when a transient noise is detected.
Preliminary testing of thresholds based on the mean value of the transient feature turned out to be less consistent than a threshold based on the CDF. The mean value of the transient feature varies to much depending on the signal-to-transient ratio (STR) in the speech file.
KALMAN FILTER
Rudolf Kalman invented Kalman filter and he published his work through his famous 1960 paper, “A new approach to linear filtering and prediction problems”. One big advantage of using Kalman filter over using Wiener filter is that, Kalman filter works on non-stationary speech models. The state and observation equations of Kalman filter models that dynamics of the speech signal generation and the noise and observed signal respectively. Complete explanation of conventional Kalman filter implementation is available in the next section.
There are other spectrum energy techniques available which has their own advantages and disadvantages. Spectral subtraction is one of the commonly used technique in which frequency property of noise samples are subtracted from the contaminated signal in frequency domain. This is one of the simplest methods for spectrum energy but noise must be stationary throughout the signal and noise samples are required before starting the process to learn its frequency behavior.
IV.
SIMULATION RESULTS
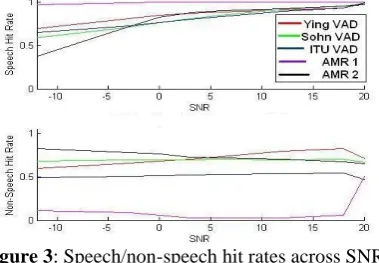
Based on the test set up, the Ying VAD emerged as being the most accurate and most consistent algorithm against the utterances in the different noise types and different SNRs. It was consistently among the best performers at all SNRs. The second best performer was the AMR 2 VAD, followed by the Sohn VAD, ITU VAD and the AMR1 VAD.
Table. VAD average speech/non-speech hit rates
Ying AMR 2 Sohn ITU AMR 1
-12 dB 0.4768 0.2687 0.4139 0.3133 0.5174
-3 dB 0.6351 0.5986 0.5484 0.3974 0.5260
0 dB 0.6795 0.694 0.6006 0.5133 0.5141
3 dB 0.7148 0.7411 0.6496 0.5570 0.5039
6 dB 0.7524 0.7637 0.6956 0.5962 0.5009
12 dB 0.8057 0.7790 0.7606 0.6575 0.5031
18 dB 0.8454 0.7890 0.8029 0.7055 0.5164
Average Hit Rate
0.7014 0.6620 0.6388 0.5343 0.5117
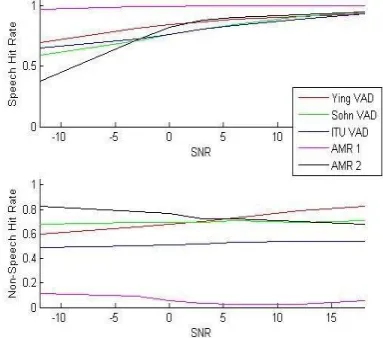
The accuracy of the VADs improved as the SNR progressed from the very low level of -12dB to 18dB and clean signals as shown in Figure 7.
Figure 3: Speech/non-speech hit rates across SNRs
recorded in a periodic noise. The best performances were in a variety of noises, however the VADs achieved the overall best results in the fire60nosiren noise type. (See Figure 4 (Note different scales for presentation clarity)).
Figure 4: Speech/non-speech hit rate in aperiodic noise
Figure 5: Speech/non-speech hit rate in periodic noise
The performance over different noise types also varied with VADs, with some experiencing more variation over different noise types at a particular SNR than others. Table shows the variance of the speech/non-speech hit rates caused by different noise types at a particular SNR.
Table.Speech/non-speech hit rate variance (x 10-3)
Ying Sohn AMR 2 ITU AMR 1
-12 dB 14.1 36.9 51.1 7.8 0.5
-3 dB 5.2 23.0 13.8 3.5 0.9
0 dB 4.0 16.4 5.4 1.7 0.3
3 dB 3.8 9.9 2.4 0.85 0.08
6 dB 2.6 5.9 0.9 0.82 0.0083
12 dB 1.7 3.4 0.1 1.9 0.099
18 dB 0.6 2.5 0.04 3.0 1.6
Average (from 0 – 18db)
2.54 7.62 1.77 1.65 0.42
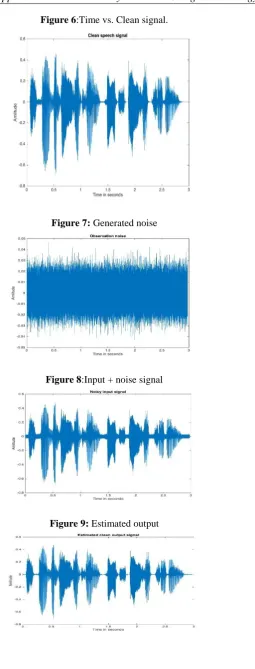
Figure 6:Time vs. Clean signal.
Figure 7: Generated noise
Figure 8:Input + noise signal
Figure 10:Hamming windowed process. (Only output is shown as input, input+noise plots are the same)
Figure 11: Input + Noise signal
While reconstructing the hamming windowed signal output, the intelligibility was poor when compared
to the rectangular window signal output. This is evident from the plot as well.
Now let’s add more noise and see how well the Kalman filter estimates the clean signal…
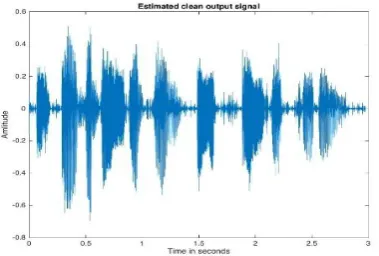
Figure 12: and, this is the output estimated clean speech
Figure 14: single sided amplitude spectrum
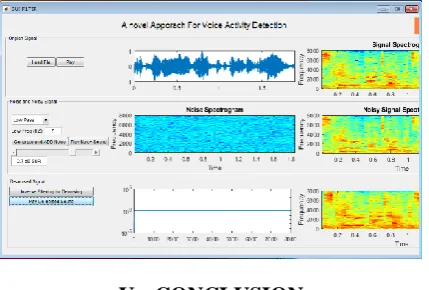
Figure 15: spectrum detection tool using kalman filter
V.
CONCLUSION
The approach outlined by D. Ying et al. achieved the best and most consistent performance at all SNRs and different noise types with a comparatively low variance in performance in different noise types. The unsupervised learning of the models proved to be a robust approach to modeling parameter distributions, while the sub- band level decision-making process lead to greater accuracy. The overhang scheme implemented was also very robust as there were very few errors associated with it.
There are however some concerns about the Ying algorithm. The first concerns the startup time of the algorithm, which is greater than 0.5s due primarily to the unsupervised model training which, in the default setting, requires 60 10ms frames in order to converge to an accurate model. This time lag may be inappropriate for some applications of the VAD. Another concern is the computational load of the algorithm. Although the decision making process in each sub-band of the signal is very efficient, as a whole, carrying out the same process for several bands becomes a high computational cost, which similarly may be undesirable in certain VAD applications. Despite these shortcomings, the Ying VAD was shown to perform exceptionally well against other VADs in a standard testing framework, and the potential of the unsupervised learning framework in voice activity detection has been demonstrated as being a high performing and robust approach. This project demonstrates how a Kalman filter can be used for purposes like spectrum energy analysis. The above-mentioned idea has some big matrices (P and A for instance), whose sizes are determined by choosing appropriate autoregressive filter order. The process is slow and it is not surprising given the number of matrix multiplications it has to do for every samples. In the search for improved algorithms, both in results as well as in reducing computational overhead, I have gone through some papers, which uses Kalman filters in modulation domain[5] and another paper[3] focuses on fastening the matrix operations. But the fundamental idea behind this technique has hardly gone through improvisation and that shows the robustness of the Kalman filter algorithm in spectrum energy techniques. Kalman filter is used to estimate clean speech from a noisy version speech and also achieve high recognition rate.
REFERENCES
[1]. Dongwen Ying, Yonghong Yan, Jianwu Dang, and F.K. Soong. Voice activity detection based on an unsupervised learning framework. Audio, Speech, and Language Processing, IEEE Transactions on,
19(8):2624 –2633, November 2011. ISSN 1558-7916.doi: 10.1109/TASL.2011.2125953.URL
http://ieeexplore.ieee.org/xpls/abs_all.jsp?arnumber=5728850&tag=1.
P. Petit. A silence compression scheme for g.729 optimized for terminals conforming to recommendation
v.70. Communications Magazine, IEEE, 35: 64–73, September 1997.
[3]. Math Works. Matlab http://www.mathworks.com.
[4]. John S. Garofolo, Lori F. Lamel, William M. Fisher, Jonathan G. Fiscus, David S. Pallett, Nancy L.
Dahlgren, and Victor Zue. Timit acoustic- phonetic continuous speech corpus.
http://www.ldc.upenn.edu/Catalog/ CatalogEntry.jsp?catalogId=LDC93S1.
[5]. European Telecommunication Standard (ETS) has been produced by the Spe- cial Mobile Group (SMG)
Technical Committee of the European Telecommu- nications Standards Institute (ETSI). Ets 300 972: ”digital cellular telecom- munications system; half rate speech; discontinuous transmission (dtx) for half rate speech traffic channels”. (gsm 06.41 version 5.0.1). European Telecom- munication Standards Institute, ETSI, May 1997.
[6]. European Telecommunication Standard (ETS) has been produced by the Spe- cial Mobile Group (SMG)
Technical Committee of the European Telecommu- nications Standards Institute (ETSI). Ets 300 973: ”digital cellular telecom- munications system; half rate speech; voice activity detector (vad) for half rate speech traffic channels”. (gsm 06.42 version 5.0.1). European Telecom- munication Standards Institute, ETSI, May 1997.
[7]. L. R. Rabiner and M. R. Sambur. An algorithm for determining the endpoints of isolated utterances. Bell
System Tech. Jour., 54(2):297–315, February 1975. URL http://link.aip.org/link/?RSI/69/1236/1.
[8]. A. Benyassine, E. Shlomot, H.-Y. Su, D. Massaloux, C. Lamblin, and J.-P. Petit. G.729 annex b enhancements in voice-over-ip applications - option1. Communications Magazine, IEEE, 35:64–73, August 2005.
[9]. Hsiao-Wuen Hon Xuedong Huang, Alejandro Acero. Spoken Language Pro- cessing: A Guide to Theory,
Algorithm, and System Development. Prentice Hall PTR, 2001.
[10]. Jonathan (Y) Stein. Correlation, pages 349–392. John Wiley and Sons, Inc., 2001. URL
http://dx.doi.org/10.1002/047120059X.ch9.