ISSN (e): 2250-3021, ISSN (p): 2278-8719
Vol. 08, Issue 7 (July. 2018), ||V (II) || PP 80-86
Application of Ann to Ensure Software Reliability and Quality
T. Ravi Kumar
1, Dr. T. Srinivasa Rao
2, Dr.Ch.V.M.K.Hari
31Sr.Asst professor, Department of CSE, AITAM Engineering College, Tekkali, (AP), India, 2Associate professor, Department of CSE, GIT, GITAM University, Visakhapatnam, (AP), India,
3Sr.Asstprofessor, Dr.V.S.KrishnaGovtCollege, Visakhapatnam,(AP),India.
Corresponding Author: T. Ravi Kumar
Abstract:
To ensure Software life and reliability software Quality analysis is one of the significant criteria. Software quality is been characterized under various parameters. Software risk analysis is one such basis required to distinguish the software reliability. At the point when software is arranged or being created by the sort of software and in addition the endeavors required to build up the software by and large characterizes the software hazard. For example, the accessibility of the required software, equipment, man power all are the prescient hazard factors.There can be errors introduced knowingly or unknowingly at different levels of the software design cycle (SDLC). Irrespective of this we can predict the software defects before the product makes into market it will be a value add on the businesses In this work, these all hazard factors are characterized under the fuzzy outing the demonstration. However conventional metrics approaches, numerouspredictable methodologies are inadequate in this regard as well as on a very basic level conflicting. Other than this the paper additionally legitimizes Neural Networks as a superior contrasting option to formal techniques in initiating times of software improvement lifecycle. A fuzzy logic reputable paradigm is proposed for predicting software defect density on individual phases of the SDLC.Theperceptive precision of the proposed model is applicable utilizing fivereal software projectdata,BMRE and MMRE are the industrial accepted models to ensure software quality. Widely accepted results observed for BMRE, MMRE by using ANN method of Software defect density.Keywords:
ANN, Software quality, Design Metrics, Software fault prediction, SDLC, ANN, Fuzzy logic. --- --- Date of Submission: 28-06-2018 Date of acceptance: 13-07-2018 ------I.
INTRODUCTION
software [6]. Software Reliability Engineering works by quantitatively portraying and applying two things about the Product: i) the anticipated relative utilization of its capacities and ii) its required significant quality attributes. In applying software reliability designing, one can shift the relative accentuation on these elements. [7]
II.
RELATED WORK
The developing complexities of software and expanding interest of dependable software have prompted the advance of persistent research in the territories of viable software reliability evaluation. In this segment, some imperative commitments around there are displayed.
There are so many industrial model to identify the software defect density. Old classic techniques include software defect density using the prediction based classification techinques. Karunanithi et.al [8] exhibited the neural system display for software reliability prediction and found that neural system models are preferable at endpoint prediction over investigative models. They utilized distinctive systems like bolster forward NN Jordan, intermittent neural systems. Later in utilization of the neural system as a tool for defining software quality of a substantial media transmission system, characterizing modules into blame or non-blame inclined by Khoshgaftaar et.al [9]. These two models are contrasted the Artificial Neural Network show and a non-parametric discriminant model, and found that Neural Network demonstrate has better prescient precision. Blame prediction models utilizing object arranged metrics and contrasted the outcomes and two measurable models utilizing five quality traits and inferred that neural systems improve.
Need of software reliability driven different techniques to evaluate the software defects. In this process clustering techniques were more popular. This technique enhanced the chances of finding defects from 32.8% to 97.5% comparing with review based models and also with comparison to prediction based models % of the accuracy increased from 72.9 to 94.3. In the paper [11], creators proposed a novel software defect prediction technique in view of useful groups of projects to enhance the execution. Until at that point, most techniques proposed toward this path anticipate absconds by class or record. In the paper [12], k-implies based bunching approach has been utilized for finding the blame inclination of the Object arranged systems and found that k-implies based grouping techniques indicates 62.4% exactness. It likewise demonstrated high estimation of likelihood of location and low estimation of likelihood of false cautions. This investigation affirms the achievability and value of k implies based software blame prediction models.
Association control mining is another area where the lot of work went in, as in current generation most of the process are data intensive. In [13], analysts proposed prediction of imperfection affiliation and defect adjustment technique in light of affiliation control mining strategies. The proposed strategies were connected to abscond data comprising of more than 200 undertakings more than 15 years. It was finished up from trial comes about that exactness accomplished is high for both defect affiliation prediction and imperfection adjustment prediction. The outcomes got were likewise contrasted and PART, C4.5 and Naive Bayes technique and demonstrated the precision change by 23 percent.
This proposed demonstrate was assessed on open source datasets and contrasted with comparable existing methodologies and found that this model over performed for the majority of the current machine learning based techniques for imperfection prediction.
One sole techniques is not enough to predict software defects where projects are becoming more complex. To solve complex projects defects issue industry moved towards hybrid models.
In the paper[14], a cross breed approach in light of K-Means Clustering and bolster forward neural system has been proposed and it was discovered that execution is better if there should be an occurrence of this half and half approach as contrasted and the current methodologies as far as exactness , mean total blunder and root mean square mistake esteems. Mixture blame inclined module prediction technique was presented that consolidates affiliation control mining with calculated relapse investigation [15], [16]. On the off chance that a module fulfills the preface of one of the chose rules, the module is arranged by run as either blame inclined or not. Something else, the module is characterized by the strategic relapse. The three other blame inclined modules in view of strategic relapse demonstrate, straight discriminant model and characterization tree. The trial comes about indicated change in execution when contrasted with regular strategies. [17, 18]
III.
SOFTWARE RELIABILITY
Software Reliability Measurement Techniques
Measuring the software reliability is a troublesome issue. It is hard to locate a reasonable approach to gauge software reliability, and the vast majority of the perspectives identified with software reliability.Some reliability metrics which can be utilized to measure the reliability of the software Product are:-
Product Metrics
Product metrics are those which are utilized to construct the ancient rarities i.e. prerequisite detail archives, framework configuration reports and so forth. These metrics help in evaluation if the Productis sufficient through reports on characteristics like ease of use, reliability, practicality and convenience.
▪Software Size:
Software estimate is believed to be intelligent of multifaceted nature, improvement exertion and reliability. Lines of Code (LOC), or LOC in thousands (KLOC), is an instinctive starting way to deal with measuring software estimate. The premise of LOC is that program length can be utilized as an indicator of program qualities, for example, exertion &ease of upkeep.
▪Review & Records:
Function point metric is a strategy to quantify the usefulness of a proposed software improvement in view of the tally of data sources, yields, ace records, asks, and interfaces.
▪Test scope:
Test scope metric gauge Fault and reliability by performing tests on software Products, expecting that software reliability is a component of the bit of software that is effectively checked or tried.
▪Software complexity:
Complexity is straightforwardly identified with software reliability, so speaking to multifaceted nature is critical. Many-sided quality arranged metrics is a technique for deciding the multifaceted nature of a program's control structure, by disentangling the code into a graphical portrayal. Agent metric is McCabe's Complexity Metric.
▪Quality metrics measures the quality at different phases of software Product advancement. DRE gives a measure of quality due to different quality confirmation and control exercises connected all through the advancement procedure. [21, 22]
Project Management Metrics
Project metrics portray the project attributes and execution. In the event that there is great administration of project by the software engineer then this assistance us to accomplish better Products. Relationship exists between the advancement procedure and the capacity to finish extends on time and inside the coveted quality destinations. Cost increment when engineers utilize deficient procedures. Higher reliability can be accomplished by utilizing better advancement process, chance administration process, arrangement administration process. These metrics tells about:-
▪Number of software designers
▪Staffing design over the life-cycle of the software ▪ Cost and timetable
▪ Productivity
Process Metrics
Process metrics evaluate helpful traits of the software improvement process and its condition. They tell if the procedure is working ideally as they provide details regarding qualities like process duration and revise time. The objective of process metric is to do the correct employment on first time through the procedure. Process metrics portray the adequacy and quality of the procedures that deliver the software Product. Illustrations are:
▪Effort required simultaneously ▪Time to deliver the Product
▪Effectiveness of deformity evacuation amid improvement ▪Number of deformities found amid testing
Fault and Failure Metrics
A Fault is a deformity in a program which emerges when software engineer makes a mistake and causes disappointment when executed under specific conditions. These metrics are utilized to decide the disappointment free execution software.
To accomplish this objective, number of shortcomings found amid testing and the disappointments or different issues which are accounted for by the client after conveyance are gathered, condensed and dissected. Disappointment metrics depend on client data in regards to disappointments found after arrival of the software. The disappointment information gathered is in this manner used to compute disappointment thickness, Mean Time between Failures (MTBF) or different parameters to quantify or anticipate software reliability. [23, 24] The Metrics are utilized to enhance the reliability of the framework by distinguishing the ranges of prerequisites. The diverse sorts of software metrics that are utilized are:-
Prerequisite Reliability Metric
Prerequisites demonstrate what highlights the software must contain. It determine the usefulness that must be incorporated into the software. The necessities must be composed with the end goal that is no misconception between the designer and the customer. The necessities must contain legitimate structure to stay away from the loss of important data. The prerequisites ought to be careful and in a nitty gritty way so it is simple for the plan stage. Necessity Reliability metrics assesses the above said quality elements of the required record.
Design and Code Reliability Metric The quality calculates that exists Design and coding design are intricacy,
size and seclusion. happen. The reliability will diminish if modules have a blend of high multifaceted nature and expansive size or high many-sided quality and little size. These metrics are likewise relevant to question arranged code, however in this, extra metrics are required to assess the quality.
Testing Reliability Metric
These metrics utilize two ways to deal with assess the reliability. In the first place it guarantees that the framework is outfitted with the capacities that are determined in the prerequisites. Along these lines, the mistakes because of the absence of usefulness diminishes. Second approach is assessing the code, finding the errors and settling them. To guarantee that the framework contains the usefulness determined, test designs are composed that contain different experiments.
Testing stage software metrics
i. Staff Experience (SE): Testing staff having a sound specialized foundation and experience greatly affects the test quality. Staffs engaged with software testing are damaging in nature and attempt their best to discover software deformity.
ii. Quality of Documented Test Cases (QDT): Software testing is exorbitant and tedious, in this manner powerful experiments are should have been produced. Software test cases are particulars of the contributions to the test and the normal yield from the framework in addition to an announcement of what is being tried. The experiments are intended to uncover deserts. A decent experiment is one that has a high likelihood to uncover software abandons. [23,24]
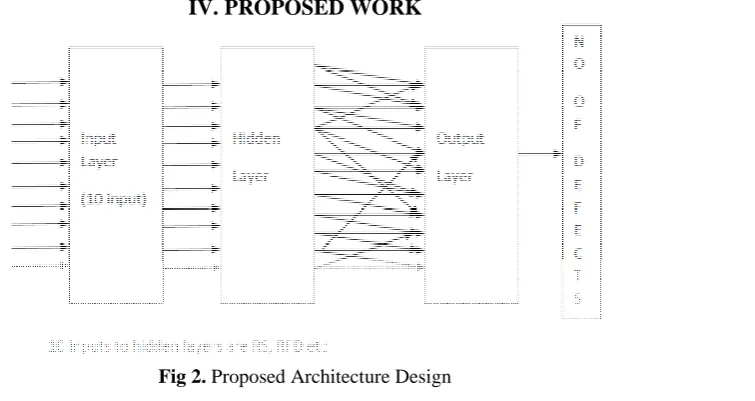
Neural network is a layer based approached where each layer drives the consecutive layer behavior. SDLC and ANN are more similar in operation as one stage output is more closely driving the next stage outputs. In the proposed work, ANN is divided into three layers naming Input layer, Hidden layer and output layer. Input layer is given all software meters data which will be processed and generated required data for the Hidden layer. Hidden layer processing will take care of the different stages interoperability and produces a normalized output to the output stage. Output stage deformalizes the output to get the exact defect density.
Guaranteeing the reliability of a software extend is imperative to all gatherings included including Managers, Marketing, Programmers, and Customers. Untrustworthy frameworks can affect software designers and customers by basically being an inconvenience, by costing time and cash, or most dire outcome imaginable, by costing single or numerous lives
Utilization of ANN enhanced affiliation mining to anticipate software reliability has been proposed. Software reliability appraisal has been a crucial factor to portray the quality of any software item quantitatively amid testing stage. The work depends on the software disappointments or the imperfections and on which the diagnostic choice will be drawn utilizing ANN. It just takes disappointment history as information and Predicts future disappointments. The contribution to the proposed technique is software execution time, while yield of the framework is anticipated as number of disappointments. The disappointments or the errors will be characterized with various weights. In this way, here we investigate the materialness of ANN for better expectation of reliability in a practical situation and present an evaluation strategy for software reliability development utilizing connectionist demonstrate.
V.
ANALYSIS AND RESULTS
Results:
Real time data sets are extracted from promise database and processed through weka tool to generate the exact data corresponds to each metric of the SDLC. Results are produces for 20 real time data sets to ensure the model reliability. As listed in the table, these same inputs are applied to the fuzzy based approach to compare the model efficiency.
To approve the prediction exactness of the proposed display regularly utilized
Evaluation measures
To approve the prediction exactness of the proposed display regularly utilized and recommendedassessment measures have been taken which are as per the following.[23,24]
i. Mean Magnitude of Relative Error (MMRE): MMRE is the meanofcomplete calculation errors and a measure of the spread ofthe variable Z, where Z = estimate/actual
Case
study RPDDI DPDDI CPDDI TPDDI Actual Defects
Defects prediction using fuzzy
Defects prediction using ANN
18 0.0126 0.0122 0.1059 0.0993 1357 1343 1355 19 0.189 0.0157 0.0131 0.0564 194 187 188 20 0.00971 0.0067 0.0356 0.0149 893 878 881
MMRE= 1
𝑚
𝑥𝑖−𝑥 𝑖
𝑥𝑖 𝑚 𝑗 =1
Where xi is the actual value and ^xi is the estimated value of avariable of interest
ii. Balanced Mean Magnitude of Relative Error (BMMRE): MMRE isunbalanced and assessesoverratesin excess ofunderrates.
For this reason, a balancedmeanmagnitude of relativeerror measure is also considered which is as follows: BMMRE= 1
𝑚
𝑥𝑖−𝑥 𝑖
min (𝑥𝑖𝑥 )𝑖 𝑚
𝑗 =1
The minor value of MMRE and BMMRE specifies improved precisionof prediction. ERROR Rate Fuzzy Method ANN Method BMRE 0.6862 0.1047 MMRE 0.5268 0.3921
VI.
CONCLUSION
In this paper, ANN based approach to find software defect density and compared with the previous fuzzy model. A detailed explanation of the software metrics has been covered. The proposed model considers only reliability relevant software metrics of each phase of SDLC. The error values are calculate and the prediction of defects is been obtain using fuzzy technique. In order to increase the rate of prediction of defects we further implement our work using artificial neural networks. The experimental results using fuzzy and ANN are been compared using matlab tool. By the obtained results it is shown that thepredicted defect density indicators are very helpful to analyze the defects severity in different artifacts of SDLC of a software project. prediction rate is more accurate by using ANN method. The error rate such as MMRE and BMMRE calculated using fuzzy and ANN for which ANN proved to be best with low error rate.
Future Work:
Further we can extend our work using convolution neural networks. By which we can try to reduce the functioning time and reduce the cost of implementation. The no of actual defects identification may also further increase.
REFERENCES
[1]. M.R. Lyu, Handbook of Software Reliability Engineering, vol. 222,IEEEComputer Society Press, CA, 1996.
[2]. IEEE Guide for the use of IEEE Standard Dictionary of Measures to Produce Reliable Software. IEEE, New York, IEEE Std. 982.2-1988, 1988.
[3]. [3] IEEE Standard Glossary of Software Engineering Terminology. IEEE, New York, IEEE Std. 610.12–1990, pp. 1–84, 1990.
[4]. K.Y. Cai, C.Y. Wem, M.L. Zhang, A critical review on software reliabilitymodeling, Reliab. Eng. Syst. safety 32 (3) (1991) 357–371.
[5]. C. Kaner, Software engineering metrics: what do they measure and how do we know?, in: 10th International Software Metrics Symposium, vol. 6, 2004.
[6]. J.D. Musa, A. Iannino, K. Okumoto, Software Reliability: Measurement,Prediction, Application,McGraw-Hill Publishers, New York, 1987.
[7]. H. Pham, System Software Reliability, Reliability Engineering Series,Springer-Verlag Publisher, London, 2006.
[8]. Methodology for Software Reliability Prediction and Assessment. TechRep RL- TR-92-95, Rome Laboratory, vol. 1–2, 1992.
[9]. W.W. Agresti, W.M. Evanco, Projecting software defects form analyzing adadesign, IEEE Trans. Softw. Eng. 18 (11) (1992) 988–997.
[10]. C. Wholin, P. Runeson, Defect content estimations from review data, in: Proceedings of 20th International Conference on software Engineering, 1998, pp. 400–409.
International organization of Scientific
Research
86 | P a g e
[12]. V. Cortellesa, H. Singh, B. Cukic, Early reliability assessment of UML based software models, in: Proceedings of the 3rd International Workshop on Software and Performance, 2002, pp. 302–309. [13]. J.E. Gaffney Jr., C.F. Davis, An approach to estimating software errors and availability, in: Proceedings
of 11th Minnowbrook Workshop on Software Reliability, SPC-TR-88-007, version 1.0, July 26–29, 1988, Blue Mountain Lake, NY, 1988.
[14]. J.E. Gaffney Jr., J. Pietrolewiez, An automated model for software early error prediction (SWEEP), in:Proceedings of 13th Minnowbrook Workshop on Software Reliability, Blue Mountain Lake, NY, 1990.
[15]. J.E. Gaffney Jr., Estimating the number of faults in code, IEEE Trans. Softw. Eng.10 (4) (1984) 141–152. [16]. M. Lipow, Number of faults per line of code, IEEE Trans. Softw. Eng. Se-8 (4)(1982) 437–439. [17]. T.M. Khoshgoftaar, J.C. Musson, Predicting software development errors usingsoftware complexity
metrics,IEEE J. Sel. Areas Commun. 8 (2) (1990) 253–261.
[18]. N.E. Fenton, M. Neil, A critique of software defect prediction models, IEEETrans. Softw. Eng. 25 (5) (1999)675–689.
[19]. N.E. Fenton, M. Neil, et al., Predicting software defects in varying developmentlifecycles using Bayesian nets,Inf. Softw. Technol. 49 (1) (2007) 32–43.
[20]. N.E. Fenton, M. Neil, et al., On the effectiveness of early life cycle defectprediction with Bayesian Nets,EmpiricalSoftw. Eng. 13 (5) (2008) 499–537.
[21]. S. Mohanta, G. Vinod, A.K. Ghosh, R. Mall, An approach for early prediction ofsoftware reliability, ACM SIGSOFT Softw. Eng. Notes 35 (6) (2010) 1–9.
[22]. S. Mohanta, G. Vinod, R. Mall, A technique for early prediction of softwarereliability based on design metrics,Int. J. Syst. Assurance Eng. Manage. 2 (4)(2011) 261–281.
[23]. D.K. Yadav, S.K. Charurvedi, R.B. Mishra, Early software defects predictionusing fuzzy logic, Int. J. Performability Eng. 8 (4) (2012) 399–408.
[24]. HarikeshBahadurYadav, Dilip Kumar Yadav, A fuzzy logic based approach for phase-wise software defects prediction using software metrics –http://dx.doi.org/10.1016/j.infsof.2015.03.001.
[25]. PromiseRepository<http://promise.site.uottawa.ca/SERepository/datasets-page.html>.
Authors
T. Ravi Kumar received M.Tech degree in Computer Science and Engineering from Jawaharlal Nehru technological University Hyderabad, A.P., India. And B.tech in computer Science and Information Technology from Jawaharlal Nehru Technological University Hyderabad, A.P., India. He is having 10 years of experience in teaching and presently working as Sr Assistant Professor in the Department of Computer Science and Engineering at Aditya Institute of Technology and Management, Tekkali [AITAM], A.P., India. His area of research includes Software Engineering, Fuzzy logic and Software Testing Methodologies.
Dr T. Srinivas Rao received B.Tech degree from GITAM, Andhra University, Visakhapatnam A.P., India. Received M.Tech degree from Andhra University, Visakhapatnam, A.P., India. Received Ph.D. degree from Andhra University, Visakhapatnam, A.P., India. Presently he is working as Associate professor, department of CSE, Gitam Institute of Technology, GITAM University, Visakhapatnam. He is having 17 years of Teaching Experience. His research interest includes wireless communication (WiFi, WiMax), Mobile Ad hoc Networks, Sensor Networks, Neural Networks and fuzzy logic, Communication networks, Data mining, software engineering, Machine Learning.