Adaptive Parameter Selection for Strategy
Adaptation in Differential Evolution for
Continuous Optimization
Wenyin Gong1,2, Zhihua Cai1 1
School of Computer Science,
China University of Geosciences, Wuhan 430074, P.R. China, Email: [email protected]; [email protected]
2State Key Laboratory of Software Engineering, Wuhan University, 430072, P.R. China
Abstract— In order to automatically select the most suitable
strategy for a specific problem without any prior knowledge, in this paper, we present an adaptive parameter selection technique for strategy adaptation in differential evolution (DE). First, a simple strategy adaptation mechanism is employed to implement the adaptive strategy selection in DE. Then, the probability- matching-based adaptive parameter selection method is proposed to select the best parameter of the strategy adaptation mechanism; in this way, it can accelerate the strategy adaptation mechanism to choose the most suitable strategy while solving a problem. To evaluate the performance of our approach, thirteen widely used benchmark functions are chosen as the test suite. The performance of our approach is compared with other DE variants, including two recently proposed DE with strategy adaptation. The results indicate that our approach is highly competitive to the compared algorithms. In addition, com-pared with the classical DE algorithms with single strategy, our method obtains better results in terms of the quality of the final solutions and the convergence speed.
Index Terms— Differential evolution; adaptive parameter
selection; strategy adaptation; global optimization.
I. INTRODUCTION
Differential evolution (DE), proposed by Storn and Price in 1995 [1], is an efficient and effective population-based evolutionary algorithm for the global optimization. Among its advantages are its simple structure, ease of use, speed, and robustness, which allows it on many real-world applications, such as data mining, IIR design, neural network training, pattern recognition, digitalfilter design, engineering design, etc. [2]. More details of DE applications can be found at a recent survey of DE in [3]. In the seminal DE algorithm [1], a single mutation strategy was used for the generation of new solutions;
This work was partly supported by the Fundamental Research Funds for the Central Universities at China University of Geosciences (Wuhan) under Grant No. CUG100316, the Foundation of State Key Lab of Software Engineering under Grant No. SKLSE2010-08-13, the National Natural Science Foundation of China under Grant No. 61075063, and the Research Fund for the Doctoral Program of Higher Education under Grant No. 20090145110007.
This work was presented in part at the Genetic and Evolutionary Computation Conference (Companion). Dublin, Ireland, July 2011.
Corresponding author.
later on, Price and Storn suggested ten other different strategies [2], [4]. Although augmenting the robustness of the underlying algorithm, these many available strategies led the user to the problem of defining which of them would be most suitable for the problem at hand – a difficult and crucial task for the performance of DE [5], [6].
In [7], we proposed several simple strategy adapta-tion mechanisms (SaMs) for strategy adaptaadapta-tion in DE. However, thefinal performance of SaJADE with thefirst SaM may be influenced by the order of the strategies in the strategy pool [7]. To remedy this drawback, in this paper, the probability- matching-based adaptive parameter selection (APS) method is proposed to select the best parameter of the strategy adaptation mechanism; in this way, it can accelerate the strategy adaptation mechanism to choose the most suitable strategy while solving a problem. To verify the performance of our approach,
13 benchmark functions are selected as the test suit; and the performance of our approach is compared with the classical DE algorithm and some state-of-the-art DE variants.
The rest of this paper is organized as follows. Section II briefly introduces the related work of this paper. In Section III, we describe our proposed method in detail, followed by the experimental results and discussions in Section IV. Finally, Section V is devoted to conclusions and future work.
II. RELATEDWORK
Without loss of generality, in this work, we consider the following numerical optimization problem:
Minimize f(x), x∈S, (1)
whereS⊆RD is a compact set,x= [x
1, x2,· · ·, xD]T,
and D is the dimension, i.e., the number of decision variables. Generally, for each variable xj, it satisfies a
boundary constraint, such that:
where Lj and Uj are respectively the lower bound and
upper bound ofxj.
A. Differential Evolution
DE [1] is a simple evolutionary algorithm (EA) for global numerical optimization. It creates new candidate solutions by combining the parent individual and several other individuals of the same population. A candidate replaces the parent only if it has an equal or betterfitness value. The pseudo-code of the original DE algorithm is shown in Algorithm 1, where D is the number of decision variables; N P is the population size; F is the mutation scaling factor; CR is the crossover rate; xi,j is the j-th variable of the solution xi; ui is the
offspring. The functionrndint(1, D)returns a uniformly distributed random integer number between 1 and D, whilerndrealj[0,1)gives a uniformly distributed random
real number in [0,1), generated anew for each value of j. Many mutation strategies to create a candidate are available; in Algorithm 1, the use of the classic “ DE/rand/1/bin” strategy is illustrated (see line 9).
Algorithm 1The DE algorithm with DE/rand/1/bin
1:Generate the initial population 2:Evaluate thefitness for each individual 3:whilethe halting criterion is not satisfieddo
4: fori= 1toN Pdo
5: Select uniform randomlyr1=r2=r3=i 6: jrand= rndint(1, D)
7: forj= 1toDdo
8: ifrndrealj[0,1)< CRorjis equal tojrandthen 9: ui,j=xr1,j+F·
xr2,j−xr3,j
10: else
11: ui,j=xi,j
12: end if
13: end for
14: end for
15: fori= 1toN Pdo
16: Evaluate the offspringui
17: iff(ui)is better thanorequal tof(xi)then 18: Replacexiwithui
19: end if
20: end for
21:end while
From Algorithm 1, we can see that there are only three control parameters in DE. These are N P, F and CR. As for the terminal conditions, we can either fix the maximum number of fitness function evaluations (Max NFFEs) or define a desired solution value to be reached (VTR).
B. DE with Strategy Adaptation
As mentioned above, there are many mutation strategies in DE; however, the choice of the best strategy for a problem is difficult. In order to alleviate this pitfall, some approaches have already been proposed to do so, being very briefly reminded in the following. Xie and Zhang [8] presented a swarm algorithm framework, where a neural network is adopted to update the weights of the DE strategies adaptively. Qinet al.[5], [6] proposed a variant of DE, named SaDE, that updates the weights of each strategy in the search based on their previous success rate. In [9], [10], strategy adaptation techniques similar to
SaDE are used to enhance DE’s performance. In [11], we proposed the use of a strategy adaptation method for DE, based on the Probability Matching technique being fed by relativefitness improvements; while in Gonget al.[7] a different family of strategy adaptation techniques was presented. Mallipeddiet al.[12] presented a DE variant with ensemble of parameters and mutation strategies, called EPSDE, in which the strategy of each target vector is initialized randomly and, during the evolution process, if the generated offspring is better than its target vector, the strategy of the target vector is stored in the next generation; otherwise, the strategy of the target vector is selected randomly from the pool or from the previous successful strategies stored with equal probability. In [13], Pan et al. presented an improved DE, referred to as SspDE, in which a strategy list, a scaling factor list, and a crossover rate list are encoded into the individual, being constantly updated during the evolution in a self-adaptive manner. Wanget al.[14] proposed a composite DE (CoDE). In CoDE, each strategy generated its trial vector with a parameter setting randomly selected from the parameter candidate pool.
III. OURAPPROACH
From the literature review in Section II-B, we can see that although there are some DE variants with strategy adaptation, the study on adaptive strategy selection in DE is still scarce. In addition, in [7], we proposed several simple strategy adaptation mechanisms (SaMs) for strategy adaptation in DE. However, thefinal performance of SaJADE with thefirst SaM may be influenced by the order of the strategies in the strategy pool [7]. Based on these considerations, in this work, we propose an adaptive parameter selection (APS) method to choose the most suitable parameter for thefirst method proposed in [7]. In this way, the improved technique is able to accelerate the strategy adaptation mechanism to choose the most suitable strategy while solving a problem and alleviate the order-influence in the original method. Our proposed approach is referred to as APS-SADE, i.e., APS for the Strategy Adaptation in DE.
A. Strategy Adaptation Mechanism
In this work, the strategy adaptation mechanism pro-posed in [7] is employed. For the i-th individual Xi,
a strategy parameter, ηi ∈ [0,1), is used to control
the selection of the strategy. Suppose that we have K strategies in the strategy pool, for the i-th target vector its mutation strategy (Si={1,2,· · ·, K}) is obtained as:
Si=ηi×K+ 1 (3)
At each generationg, for thei-th solution the strategy parameterηi is independently generated in the following
manner:
ηi=
rndni(μs,1/6), ifg= 1
where rndni(μs,0.1) indicates a normal distribution of
meanμs and standard deviation0.1. If ηi ∈/ [0,1), then
it is truncated to[0,1).
DenoteHs as the set of all successful strategy
param-etersηi’s at generationg. The mean μs is initialized to
be0.5and then updated at the end of each generation as follows:
μs= (1−c)×μs+c×meanA(Hs) (5)
wherec is a positive constant in [0,1] and meanA(·)is
the usual arithmetic mean operation. c= 0.1 is used in this work as originally used in [7].
B. Adaptive Parameter Selection
As mentioned above, the performance of the SaM described in Section III-A may be influenced by the strategy order in the pool. That is, its performance could be influenced by the initial value of μs. To remedy this
drawback, in this section, we propose an probability-matching (PM) based APS method to adaptively choose the most suitable μs for a specific problem. The
PM-based APS method is inspired by our previous work for the strategy adaptation in DE [11].
Let Aμs be a parameter pool to store the initial μs values. Suppose we have K > 1 values in the pool Aμs = {a1,· · ·, aK} and a probability vector P(t) =
{p1(t),· · ·, pK(t)} (∀t : 0 ≤ pi(t) ≤ 1;
K
i=1pi(t) = 1). In this work, the PM technique is used to adaptively update the probability pa(t) of each value a based on
its reward. Denote ra(t) as the reward1 that a value a
receives after its application at timet.qa(t)is the known
quality of a valuea, that is updated as follows [15]:
qa(t+ 1) =qa(t) +α[ra(t)−qa(t)], (6)
whereα∈(0,1] is the adaptation rate. The PM method updates the probabilitypa(t)as follows [15], [16]:
pa(t+ 1) =pmin+ (1−K·pmin)
qa(t+ 1)
K
i=1qi(t+ 1)
. (7)
wherepmin ∈(0,1)is the minimal probability value of
each value, used to ensure that no operator gets lost [15]. In this work, Aμs = {0.1,0.5,0.9}, andK = 3. Note that at each generation, each μs value in the parameter
poolAμs is updated by Eqn. (5).
The idea behind the APS for μs is that for different
problems the PM-based APS method adaptively updates the probability of each value in the evolution process; and the most suitable value will get the highest probability, and hence, it will be selected with higher probability in the following generation. Then, combined with the SaM, the most suitable strategy for the problem at hand will be selected. Therefore, the APS method is able to accelerate the SaM to choose the most suitable strategy while solving a problem, andfinally, enhances the performance of the SaM in DE.
1The rewardra(t) is calculated as the normalized average reward proposed in [11]. Due to the tight space limitation, we omit to describe it. More details can be found in [11].
C. Strategy Pool
In order to select different mutation strategies to form the strategy pool, in this work, we have chosen four strate-gies that were also used in SaDE [6]. The four stratestrate-gies are described as follows. All of them are controlled by the DE crossover rateCR unless a change is mentioned.
1) “ DE/rand/1”:
vi=xr1+F·
xr2−xr3
(8)
2) “ DE/rand-to-best/2”:
vi=xr1+F·
xbest−xr1
+F·xr2−xr3
+F·xr4−xr5
(9) 3) “ DE/rand/2”:
vi=xr1+F·
xr2−xr3
+F·xr4−xr5
(10)
4) “ DE/current-to-rand/1”:
vi=xi+F·
xr1−xi
+F·xr2−xr3
(11)
where xbest is the best individual in the current
gener-ation,r1, r2, r3, r4, r5 ∈ {1,· · ·, N P}, andr1 = r2 =
r3=r4=r5=i.
IV. EXPERIMENTALRESULTS ANDANALYSIS In order to evaluate the performance of our approach,
13benchmark functions are chosen from the literature as the test suite. These functions (f01−f13) are selected from [17]. Due to the tight space limitation, we omit to describe them here. More details can be found in [17].
A. Parameter Settings
For all experiments, we use the following parameters unless a change is mentioned.
• Dimension of each function:D= 30; • Population size:N P= 100;
• CR= 0.9, F = 0.5, K= 3, pmin= 0.05, andα= 0.3;
• Initially for each probability pi = 1/K, i = 1,· · ·, K;
• VTR: For functionsf01−f06 and f08−f13, VTR =10−8; for functions
f07, VTR =10−2;
• For all functions: Max NFFEs=300,000.
Moreover, in our experiments, each function is opti-mized over 50 independent runs. To avoid any initial-ization bias, we also use the same set of initial random populations to evaluate the different algorithms, as done in [18].
B. Performance Criteria
Four performance criteria are selected from the litera-ture [19] to evaluate the performance of the algorithms. These criteria are described as follows.
• Error: The error of a solution x is defined as
f(x)−f(x∗), wherex∗is the global minimum of the
TABLE I.
COMPARISON ON THEERRORVALUESBETWEEN THECLASSICALDEWITHSINGLESTRATEGY ANDAPS-SADEFORALLFUNCTIONS AT
D= 30.
F strategy1 strategy2 strategy3 strategy4 APS-SADE
f01 6.41E-32±8.33E-32† 1.15E-54±1.59E-54† 8.21E-01±2.41E-01† 3.08E+00±3.98E+00† 3.74E-99±4.76E-99
f02 6.50E-16±4.67E-16† 2.48E-25±1.20E-25† 3.13E+00±7.29E-01† 2.62E-02±3.01E-02† 1.46E-47±1.02E-47
f03 2.49E-05±2.07E-05† 3.11E-10±2.58E-10† 5.09E+03±1.15E+03† 2.84E+01±1.91E+01† 1.74E-21±3.41E-21
f04 8.82E-02±2.19E-01† 1.06E-11±6.33E-12‡ 1.57E+01±2.06E+00† 2.94E+00±1.09E+00† 2.04E-08±6.64E-08
f05 1.43E+00±1.01E+00† 2.39E-01±9.56E-01† 3.82E+02±1.23E+02† 9.97E+01±6.72E+01† 7.97E-02±5.64E-01
f06 0.00E+00±0.00E+00 0.00E+00±0.00E+00 2.74E+00±1.10E+00† 3.04E+00±2.94E+00† 0.00E+00±0.00E+00
f07 4.71E-03±1.21E-03† 3.02E-03±8.79E-04† 7.45E-02±1.85E-02† 1.01E-03±4.53E-04 9.78E-04±2.90E-04
f08 6.59E+03±7.04E+02‡ 7.44E+03±3.18E+02† 7.42E+03±2.48E+02† 7.88E+03±2.60E+02† 7.22E+03±3.11E+02
f09 1.41E+02±2.06E+01 1.69E+02±9.16E+00† 2.19E+02±1.22E+01† 1.31E+02±8.18E+00‡ 1.40E+02±1.03E+01
f10 4.14E-15±0.00E+00 4.57E-15±1.17E-15 1.05E+00±2.61E-01† 2.79E-01±3.01E-01† 4.07E-15±5.02E-16
f11 0.00E+00±0.00E+00 1.92E-03±4.54E-03† 8.95E-01±4.46E-02† 5.98E-01±3.83E-01† 3.45E-04±1.73E-03
f12 1.93E-32±6.70E-33† 1.57E-32±0.00E+00 3.33E+00±9.20E-01† 4.34E-03±1.29E-02† 1.57E-32±0.00E+00
f13 1.44E-30±1.80E-30† 1.35E-32±0.00E+00 2.20E+01±6.89E+00† 1.63E-02±4.14E-02† 1.35E-32±0.00E+00
w/t/l 8/4/1 8/4/1 13/0/0 11/1/1 −
†indicates APS-SADE is significantly better than its competitor by the Wilcoxon signed-rank test atα= 0.05.
‡means that APS-SADE is significantly worse than its competitor by the Wilcoxon signed-rank test atα= 0.05.
TABLE II.
COMPARISON ON THENFFESVALUESBETWEEN THECLASSICALDEWITHSINGLESTRATEGY ANDAPS-SADEFOR THESUCCESSFUL FUNCTIONS ATD= 30.
F strategy1 strategy2 strategy3 strategy4 APS-SADE
f01 1.05E+05±1.98E+03 (1.00) 6.40E+04±1.04E+03(1.00) NA±NA (0.00) NA±NA (0.00) 3.68E+04±5.94E+02(1.00)
f02 1.76E+05±3.45E+03 (1.00) 1.15E+05±1.90E+03(1.00) NA±NA (0.00) NA±NA (0.00) 6.24E+04±8.72E+02(1.00)
f03 NA±NA (0.00) 2.66E+05±6.51E+03(1.00) NA±NA (0.00) NA±NA (0.00) 1.43E+05±6.21E+03(1.00)
f04 NA±NA (0.00) 2.29E+05±5.33E+03(1.00) NA±NA (0.00) NA±NA (0.00) 2.59E+05±2.66E+04(0.80)
f05 NA±NA (0.00) 1.95E+05±5.55E+03(0.94) NA±NA (0.00) NA±NA (0.00) 1.77E+05±7.16E+03(0.98)
f06 3.83E+04±1.55E+03 (1.00) 2.48E+04±9.64E+02 (1.00) NA±NA (0.00) 1.01E+04±8.34E+02(0.20) 1.36E+04±5.34E+02(1.00)
f07 1.45E+05±3.45E+04 (1.00) 8.53E+04±2.30E+04 (1.00) NA±NA (0.00) 1.91E+04±5.50E+03(1.00) 2.93E+04±6.66E+03(1.00)
f10 1.63E+05±3.04E+03 (1.00) 1.01E+05±1.29E+03(1.00) NA±NA (0.00) NA±NA (0.00) 5.70E+04±7.45E+02(1.00)
f11 1.09E+05±3.20E+03 (1.00) 6.73E+04±2.35E+03(0.84) NA±NA (0.00) NA±NA (0.00) 3.81E+04±8.11E+02(0.96)
f12 9.62E+04±2.78E+03 (1.00) 6.16E+04±1.73E+03(1.00) NA±NA (0.00) NA±NA (0.00) 3.24E+04±8.25E+02(1.00)
f13 1.14E+05±3.32E+03 (1.00) 7.61E+04±2.27E+03(1.00) NA±NA (0.00) NA±NA (0.00) 3.88E+04±1.28E+03(1.00)
Sr 8.00 10.78 0.00 1.20 10.74
standard deviation of the error values are calculated as well.
• NFFEs: The NFFEs is also recorded when the VTR
is reached. The average and standard deviation of the NFFEs values are calculated.
• Success rate (Sr): The successful run of an
al-gorithm indicates that the alal-gorithm can result in a function value no worse than the VTR before the Max NFFEs condition terminates the trial. The successful rate Sr is calculated as the number of
successful runs divided by the total number of runs.
• Convergence graphs: The convergence graphs show
the median error performance of the best solution over the total runs, in the respective experiments.
C. On the Adaptation of APS-SADE
In order to analyze the adaptation of our proposed APS-SADE, in this section, the performance of APS-SADE is compared with the original DE algorithm with single strategy in the strategy pool as mentioned in Section III-C. The results are shown in Tables I and II. All results are averaged over50independent runs. The best and the second best results are highlighted in grey boldface and
boldface, respectively. In Table I, the paired Wilcoxon
signed-rank test at α = 0.05 is adopted to compare the significance between two algorithms. The Wilcoxon signed-rank test is a non-parametric statistical hypothesis
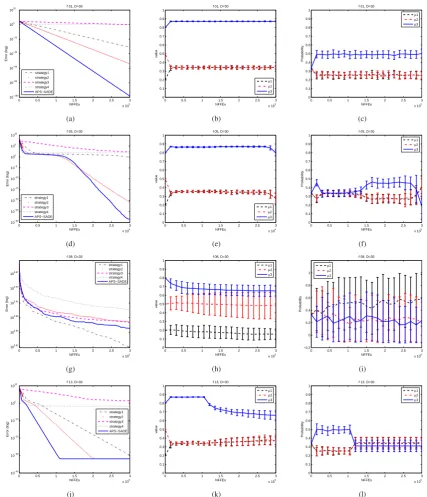
test, which can be used as an alternative to the pairedt -test when the results cannot be assumed to be normally distributed [20]. In the last row of Table I, according to the Wilcoxon’s test, the results are summarized as “w/t/l”, which means that APS-SADE wins in w functions, ties in t functions, and loses in l functions, compared with its competitors. The evolution trend of some selected functions2 is plotted in Figure 1.
According to results shown in Table I, w.r.t. the error values, it can be seen that APS-SADE obtains the best overall results compared with the original DE algorithm with single strategy. APS-SADE significantly outperforms DE with “ DE/rand/1”, “ DE/rand-to-best/2”, “ DE/rand/2”, and “ DE/current-to-rand/1” on 8,8,13, and 11 func-tions, respectively. On 9 functions, APS-SADE is able to provide the best error values. On the rest 4 functions (f04, f08, f09, andf11), our approach is the second best one.
In terms of the NFFEs values on the successful func-tions shown in Table II, we can see that on 8 out of
11functions, APS-SADE obtains the best NFFEs values. Additionally, on the rest3functions, APS-SADE gets the second best results. DE with “ DE/rand-to-best/2” strategy obtains the highest overall Sr = 10.78values, followed
0 0.5 1 1.5 2 2.5 3 x 10⁵ 10−100 10−80 10−60 10−40 10−20 100 1020 NFFEs Error (log)
f 01, D=30
strategy1 strategy2 strategy3 strategy4 APS−SADE (a)
0 0.5 1 1.5 2 2.5 3 x 10⁵ 0 0.1 0.2 0.3 0.4 0.5 0.6 0.7 0.8 0.9 1 NFFEs value
f 01, D=30
μ1
μ2
μ3
(b)
0 0.5 1 1.5 2 2.5 3 x 10⁵ 0 0.1 0.2 0.3 0.4 0.5 0.6 0.7 0.8 0.9 1 NFFEs Probability
f 01, D=30
μ1
μ2
μ3
(c)
0 0.5 1 1.5 2 2.5 3 x 10⁵ 10−30 10−25 10−20 10−15 10−10 10−5 100 105 1010 NFFEs Error (log)
f 05, D=30
strategy1 strategy2 strategy3 strategy4 APS−SADE (d)
0 0.5 1 1.5 2 2.5 3 x 10⁵ 0 0.1 0.2 0.3 0.4 0.5 0.6 0.7 0.8 0.9 1 NFFEs value
f 05, D=30
μ1
μ2
μ3
(e)
0 0.5 1 1.5 2 2.5 3 x 10⁵ 0 0.1 0.2 0.3 0.4 0.5 0.6 0.7 0.8 0.9 1 NFFEs Probability
f 05, D=30
μ1
μ2
μ3
(f)
0 0.5 1 1.5 2 2.5 3 x 10⁵ 103.82 103.85 103.88 103.91 103.94 103.97 NFFEs Error (log)
f 08, D=30
strategy1 strategy2 strategy3 strategy4 APS−SADE (g)
0 0.5 1 1.5 2 2.5 3 x 10⁵ 0 0.1 0.2 0.3 0.4 0.5 0.6 0.7 0.8 0.9 1 NFFEs value
f 08, D=30
μ1
μ2
μ3
(h)
0 0.5 1 1.5 2 2.5 3 x 10⁵ −0.2 0 0.2 0.4 0.6 0.8 1 NFFEs Probability
f 08, D=30
μ1
μ2
μ3
(i)
0 0.5 1 1.5 2 2.5 3 x 10⁵ 10−40 10−30 10−20 10−10 100 1010 NFFEs Error (log)
f 13, D=30
strategy1 strategy2 strategy3 strategy4 APS−SADE (j)
0 0.5 1 1.5 2 2.5 3 x 10⁵ 0 0.1 0.2 0.3 0.4 0.5 0.6 0.7 0.8 0.9 1 NFFEs value
f 13, D=30
μ1
μ2
μ3
(k)
0 0.5 1 1.5 2 2.5 3 x 10⁵ 0 0.1 0.2 0.3 0.4 0.5 0.6 0.7 0.8 0.9 1 NFFEs Probability
f 13, D=30
μ1
μ2
μ3
(l)
Figure 1. Adaptation analysis of APS-SADE on the selected functions. (a, b, c)f01; (d, e, f)f05; (g, h, i)f08; (j, k, l)f13. For each function, the leftfigure is the convergence graph of each algorithm; the middle one is the evolution trend of theμsvalues in the pool; and the right one is the evolution trend of the probability of eachμsvalue.
by our approachSr = 10.74.
On analyzing the adaptation of APS-SADE, thefigures of the convergence graph, the evolution trend of eachμs
in the pool, and the evolution trend of eachμsprobability
for the selected function are plotted in Figure 1. When showing the evolution trend ofμsvalues and probabilities
in the pool, the mean curves and error bars are plotted in Figure 1. The error bars are the standard deviations of the values over50independent runs. They can clearly show the evolution trend ofμsvalues and probabilities. For the
clarity, there are only20error bars plotted for eachfigure. This is a sample average standard deviation over all runs. According to Figure 1 we can see that:
• With respect to the convergence speed, on the
of the evolution process DE with “ DE/current-to-rand/1” obtains the fastest convergence speed. How-ever, it stagnates after some generations. The reason is that in “ DE/current-to-rand/1” the current solution xi is the base vector, the solution generated by
this strategy performs the local search around xi.
Therefore, it converges fastest at the beginning of the evolution process, but stagnates after generations.
• Since DE with “ DE/current-to-rand/1” strategy has
the local search ability, it can obtain the highest reward at a certain stage. Thus, “ DE/current-to-rand/1”, i.e.the 4-th strategy, needs to be selected with the highest probability compared with other three strategies in APS-SADE. This phenomenon can be observed on the majority of the test functions (f01 − f04, f06, and f09− f13) in our approach. For example, as shown in Figure 1, on functions f01, f11, f13 we can see that the third parameter
μ3 in Aμs converges around 0.9, and it gets the highest probability. This means that μs = 0.9 will
be selected with the highest probability to generated the mutant vector in the following generation in Eqn. (4). Based on the normal distribution, ηi is in (0.6,1.2) with 95%. After truncating in (0.6,1.0), based on Eqn. (3) it can be seen that the fourth strat-egy will be selected more frequently. Furthermore, this phenomenon indicates that when the minimal probability pmin > 0, the strategies in the strategy
pool are able to implement thecooperationin APS-SADE. For example, “ DE/rand/2” strategy is able to provide higher perturbation for the population, and hence, it can prevent the stagnation caused by “ DE/current-to-rand/1”. On the other hand, the local search ability of “ DE/current-to-rand/1” can accelerate the convergence rate. This is why on the most of functions APS-SADE is able to obtain the best results compared to DE with single strategy as shown in Tables I and II.
• For function f05, the Rosenbrock’s function, from Figure 1 (d - f) we can see thatμ3in the parameter pool still converges around0.9. However, only at the early stage and the late stageμ3 obtains the highest probability. At the middle stage, all the threeμs get
the similar probability around0.33. The reason might be that each strategy in the strategy pool is able to provide the similar reward at the middle stage in APS-SADE.
• For function f08, it is a multimodal function with many local optima. According to Figure 1 (g - i) we can see that the first strategy “ DE/rand/1” obtains the best results. Therefore, μ1 converges around
0.2, and it obtains the highest average probability. The standard deviations of the probability are large caused by the fluctuated reward obtained by each strategy.
Based on the above analysis, we can conclude that the PM-based APS for strategy adaptation in DE is able to adaptively choose the most suitable strategy for a problem
at hand.
D. Comparison on Different Strategy Adaptation Methods In order to show the enhanced performance of our proposed ASP-SADE method, in this section, APS-SADE is compared with some DE variants with different strat-egy adaptation techniques proposed recently. Three DE variants are selected: SaDE proposed in [6], AdapSS-DE proposed in [11], and SADE using the SaM described in Section III-A with initial μs = 0.5. In addition, the
Uniform-SADE, SADE with uniformly selected initialμs
value in Aμs = {0.1,0.5,0.9}, is also compared with APS-SADE. Note that all above-mentioned5DE variants withCR = 0.9 and F = 0.5. The results are shown in Table III. All results are averaged over 50 independent runs. The best and the second best results are highlighted
in grey boldface andboldface, respectively. Similar to
the methods used in [7], [21], theintermediateresults are also reported for the functions where several algorithms can obtain the global optimum of these functions. In these cases, the Wilcoxon signed-rank test is only compared with the intermediate results.
From Table III we can see that APS-SADE signifi -cantly outperforms SaDE, SADE, and Uniform-SADE on
12,10, and 9 functions, respectively. Both APS-SADE and AdapSS-DE obtain similar results, and APS-SADE is slightly better than AdapSS-DE. APS-SADE is sig-nificantly better than AdapSS-DE on 4 functions, while it loses on 2 functions. Compared between SADE and Uniform-SADE, we can obtain that Uniform-SADE is better than SADE on the majority of the functions. It means that the fixed initial μs value is affected by the
order of the strategies in the strategy pool. In addition, from Table III we can also conclude that the proposed ASP-SADE method is able to alleviate the drawback of the original SADE method and accelerate the the original SaM to choose the most suitable strategy while solving a problem.
E. Effect of Control Parameter Adaptation
TABLE III.
COMPARISON ON THEERRORVALUES OFDE VARIANTS WITHDIFFERENTSTRATEGYADAPTATIONMETHODS FORALLFUNCTIONS AT
D= 30.
F NFFEs SaDE AdapSS-DE SADE Uniform-SADE APS-SADE
f01 300,000 3.02E-80±3.26E-80† 3.76E-99±1.66E-98 4.09E-47±4.50E-47† 3.95E-85±3.45E-85† 3.74E-99±4.76E-99
f02 300,000 5.41E-38±3.45E-38† 2.57E-48±1.87E-48‡ 8.82E-22±3.54E-22† 3.27E-40±1.90E-40† 1.46E-47±1.02E-47
f03 300,000 2.78E-17±3.98E-17† 2.70E-20±7.94E-20† 2.28E-08±1.76E-08† 2.01E-19±4.21E-19† 1.74E-21±3.41E-21
f04 300,000 6.62E-06±1.43E-05† 1.10E-05±2.40E-05† 8.32E-10±4.50E-10‡ 1.10E-09±2.65E-09‡ 2.04E-08±6.64E-08
f05 300,000 7.97E-02±5.64E-01† 7.97E-02±5.64E-01† 4.57E-16±6.21E-16† 7.97E-02±5.64E-01 7.97E-02±5.64E-01
f06 10,000 9.37E+01±2.12E+01† 1.19E+01±3.00E+00‡ 8.99E+02±1.51E+02† 5.75E+01±1.32E+01† 1.75E+01±4.27E+00 300,000 0.00E+00±0.00E+00 0.00E+00±0.00E+00 0.00E+00±0.00E+00 0.00E+00±0.00E+00 0.00E+00±0.00E+00
f07 300,000 1.53E-03±4.68E-04† 1.01E-03±2.96E-04 3.34E-03±8.32E-04† 1.30E-03±3.51E-04† 9.78E-04±2.90E-04
f08 300,000 7.35E+03±2.74E+02† 7.09E+03±3.68E+02 7.27E+03±3.52E+02 7.25E+03±3.54E+02 7.22E+03±3.11E+02
f09 300,000 1.50E+02±8.60E+00† 1.41E+02±1.03E+01 1.66E+02±1.02E+01† 1.49E+02±7.80E+00† 1.40E+02±1.03E+01
f10 50,000 7.47E-06±1.91E-06† 1.84E-07±4.94E-08 4.92E-03±1.01E-03† 2.80E-06±5.80E-07† 1.62E-07±4.77E-08 300,000 4.07E-15±5.02E-16 4.14E-15±0.00E+00 4.14E-15±0.00E+00 4.14E-15±0.00E+00 4.07E-15±5.02E-16 f11 300,000 1.48E-04±1.05E-03 1.48E-04±1.05E-03 3.45E-04±1.73E-03 0.00E+00±0.00E+00 3.45E-04±1.73E-03
f12 50,000 3.33E-11±1.79E-11† 6.44E-15±6.34E-15 6.27E-05±5.16E-05† 4.82E-12±2.95E-12† 9.80E-15±6.78E-15 300,000 1.57E-32±0.00E+00 1.57E-32±0.00E+00 1.57E-32±0.00E+00 1.57E-32±0.00E+00 1.57E-32±0.00E+00
f13 50,000 5.19E-09±4.65E-09† 7.55E-10±5.27E-09† 5.67E-02±4.44E-02† 8.43E-10±6.48E-10† 3.10E-12±8.51E-12 300,000 1.35E-32±0.00E+00 1.35E-32±0.00E+00 1.35E-32±0.00E+00 1.35E-32±0.00E+00 1.35E-32±0.00E+00
w/t/l 12/1/0 4/7/2 10/2/1 9/3/1 −
†indicates APS-SADE is significantly better than its competitor by the Wilcoxon signed-rank test atα= 0.05. ‡means that APS-SADE is significantly worse than its competitor by the Wilcoxon signed-rank test atα= 0.05.
TABLE IV.
THEINFLUENCE OFPARAMETERADAPTATION ONAPS-SADE. THEERRORVALUESAREONLYREPORTEDHEREIN.
F NFFEs jDE APS-SADE1 SaDE APS-SADE2
f01 300,000 1.64E-61±2.28E-61† 9.87E-103±3.04E-102 2.77E-78±7.11E-78† 1.57E-92±2.46E-92
f02 300,000 1.96E-36±1.60E-36† 3.38E-53±4.73E-53 7.18E-39±5.19E-39† 4.16E-46±3.16E-46
f03 300,000 2.14E-06±2.09E-06† 4.31E-10±1.34E-09 1.22E-06±1.73E-06‡ 3.94E-03±1.10E-02
f04 300,000 5.38E-09±4.38E-09‡ 3.07E-08±1.34E-07 7.41E-17±4.99E-17‡ 4.21E-09±3.04E-09
f05 300,000 8.79E+00±1.84E+00† 2.99E+00±1.46E+00 1.05E+00±3.07E+00† 8.03E-01±3.26E+00
f06 10,000 5.96E+02±1.28E+02† 3.30E+01±1.18E+01 4.43E+01±9.37E+00† 1.44E+01±2.74E+00 300,000 0.00E+00±0.00E+00 0.00E+00±0.00E+00 0.00E+00±0.00E+00 0.00E+00±0.00E+00
f07 300,000 3.50E-03±7.54E-04† 1.02E-03±3.64E-04 1.67E-03±5.18E-04† 1.37E-03±3.47E-04
f08 100,000 1.27E-10±1.65E-10‡ 2.18E-10±5.80E-10 1.11E-05±1.93E-05 1.56E-05±1.73E-05 300,000 0.00E+00±0.00E+00 0.00E+00±0.00E+00 0.00E+00±0.00E+00 0.00E+00±0.00E+00
f09 100,000 4.58E-04±2.12E-03‡ 9.62E-02±2.56E-01 1.76E+01±2.29E+00† 4.40E+00±2.58E+00 300,000 0.00E+00±0.00E+00 0.00E+00±0.00E+00 0.00E+00±0.00E+00 0.00E+00±0.00E+00
f10 50,000 2.28E-04±6.50E-05† 1.17E-07±6.86E-08 2.34E-06±4.83E-07† 1.62E-07±4.02E-08 300,000 4.14E-15±0.00E+00 2.79E-15±1.74E-15 4.14E-15±0.00E+00 4.14E-15±0.00E+00
f11 50,000 8.57E-06±2.50E-05† 1.17E-07±6.86E-08 3.27E-10±2.44E-10† 1.08E-12±1.21E-12 300,000 0.00E+00±0.00E+00 0.00E+00±0.00E+00 0.00E+00±0.00E+00 0.00E+00±0.00E+00
f12 50,000 6.96E-08±5.00E-08† 7.65E-15±7.93E-15 3.17E-12±1.73E-12† 7.74E-15±4.40E-15 300,000 1.57E-32±0.00E+00 1.57E-32±0.00E+00 1.57E-32±0.00E+00 1.57E-32±0.00E+00
f13 50,000 2.14E-05±2.31E-05† 3.82E-12±7.14E-12 1.02E-09±9.87E-10† 1.61E-12±5.97E-13 300,000 1.35E-32±0.00E+00 1.35E-32±0.00E+00 1.35E-32±0.00E+00 1.35E-32±0.00E+00
w/t/l 10/0/3 − 10/1/2 −
†indicates APS-SADE is significantly better than its competitor by the Wilcoxon signed-rank test atα= 0.05.
‡means that APS-SADE is significantly worse than its competitor by the Wilcoxon signed-rank test atα= 0.05.
are highlighted in boldface. The intermediateresults are also reported for the functions where several algorithms can obtain the global optimum of these functions. In these cases, the Wilcoxon signed-rank test is only compared with the intermediate results.
Compared between APS-SADE1 and jDE, it can be seen that APS-SADE1 is significantly better than jDE on 10 out of 13 functions. On the rest 3 func-tions (f04, f08, f09), jDE significantly outperforms APS-SADE1.
Compared APS-SADE2 with SaDE, the similar re-sults can be observed like APS-SADE1 vs. jDE. On10
functions, APS-SADE2 is significantly better than SaDE, while only on2 functions (f03 andf04) APS-SADE2 is worse than SaDE. On functionf08, there is no significant difference between APS-SADE2 and SaDE with respect to the intermediate error values.
According to the analysis on the results shown in Table IV, we can conclude that the enhanced performance of APS-SADE is not influenced by the control parameter adaptation techniques proposed in jDE and SaDE. Thus, our proposed APS technique for strategy adaptation can be similarly useful for performance enhancement of other adaptive DE variants.
DE, APS-SADE is proposed to adaptively select the most suitable strategy for a specific problem. Based on the experimental results, we can conclude that:
• APS-SADE is able enhance the original DE
algo-rithm with single strategy. Moreover, the analysis of strategy adaptation indicates that our proposed method is able to adaptively select the most suitable strategy for a specific problem without any prior knowledge. In addition, in APS-SADE the cooper-ation of different strategies in the strategy pool is implemented.
• The proposed APS method for strategy adaptation
alleviates the order-influence of strategies in SaM proposed in [7] and accelerates the original SaM to select the most suitable strategy for the problem at hand. Therefore, APS-SADE obtains better results compared with SADE and Uniform-SADE.
• The enhanced performance of APS-SADE is not
influenced by the control parameter adaptation tech-niques.
Although the APS method is used for the strategy adap-tation in this work, it is a general method for parameter adaptation. This method could also be used for other parameter adaptation in evolutionary algorithms, such as the adaptation of CR and F in DE, the adaptation of μCR andμF in JADE [21], etc. In our future work, we
will verify this expectation. In addition, we will test our approach in more test problems, such as the CEC-2005 bechmark functions [19], and compare it with other DE variants reviewed in [3].
REFERENCES
[1] R. Storn and K. Price, “ Differential evolution– A simple and efficient heuristic for global optimization over con-tinuous spaces,”J. of Global Optim., vol. 11, no. 4, pp. 341– 359, Dec 1997.
[2] K. Price, R. Storn, and J. Lampinen,Differential Evolution: A Practical Approach to Global Optimization. Berlin: Springer-Verlag, 2005.
[3] S. Das and P. N. Suganthan, “ Differential evolution: A sur-vey of the state-of-the-art,”IEEE Trans. on Evol. Comput., vol. 15, no. 1, pp. 4– 31, 2011.
[4] R. Storn and K. Price, “ Home page of differential evolution,” 2010. [Online]. Available: http://www.ICSI.Berkeley.edu/˜storn/code.html
[5] A. K. Qin and P. N. Suganthan, “ Self-adaptive differential evolution algorithm for numerical optimization,” inIEEE Congr. on Evol. Comput., 2005, pp. 1785– 1791.
[6] A. K. Qin, V. L. Huang, and P. N. Suganthan, “ Differential evolution algorithm with strategy adaptation for global numerical optimization,”IEEE Trans. on Evol. Comput., vol. 13, no. 2, pp. 398– 417, Apr 2009.
[7] W. Gong, Z. Cai, C. X. Ling, and H. Li, “ Enhanced differential evolution with adaptive strategies for numerical optimization,”IEEE Transactions on Systems, Man, and Cybernetics: Part B – Cybernetics, vol. 41, no. 2, pp. 397– 413, 2011.
[8] X.-F. Xie and W.-J. Zhang, “ SWAF: Swarm algorithm framework for numerical optimization,” in Proc. Genetic Evol. Comput. Conf., Part I, ser. LNCS, vol. 3102, 2004, pp. 238– 250.
[9] J. Brest, B. Boskovi´c, S. Greiner, V.ˇ Zumer, and M. S.ˇ Mauˇcec, “ Performance comparison of self-adaptive and adaptive differential evolution algorithms,”Soft Comput., vol. 11, no. 7, pp. 617– 629, May 2007.
[10] Z. Yang, K. Tang, and X. Yao, “ Self-adaptive differen-tial evolution with neighborhood search,” inProc. IEEE Congress on Evol. Comput., 2008, pp. 1110– 1116. [11] W. Gong, A. Fialho, and Z. Cai, “ Adaptive strategy
selec-tion in differential evoluselec-tion,” inGenetic and Evolutionary Computation Conference (GECCO 2010), J. Branke, Ed. ACM Press, July 2010, pp. 409– 416.
[12] R. Mallipeddi, P. Suganthan, Q. Pan, and M. Tasgetiren, “ Differential evolution algorithm with ensemble of param-eters and mutation strategies,” Applied Soft Computing, vol. 11, no. 2, pp. 1679– 1696, 2011, in press.
[13] Q.-K. Pan, P. Suganthan, L. Wang, L. Gao, and R. Mallipeddi, “ A differential evolution algorithm with self-adapting strategy and control parameters,”Computers and Operations Research, vol. 38, no. 1, pp. 394 – 408, Jan. 2011.
[14] Y. Wang, Z. Cai, and Q. Zhang, “ Differential evolution with composite trial vector generation strategies and con-trol parameters,”IEEE Trans. on Evol. Comput., vol. 15, no. 1, pp. 55– 66, 2011.
[15] D. Thierens, “ An adaptive pursuit strategy for allocating operator probabilities,” in Proc. Genetic Evol. Comput. Conf., 2005, pp. 1539– 1546.
[16] D. E. Goldberg, “ Probability matching, the magnitude of reinforcement, and classifier system bidding,” Mach. Learn., vol. 5, no. 4, pp. 407– 425, 1990.
[17] X. Yao, Y. Liu, and G. Lin, “ Evolutionary programming made faster,”IEEE Trans. on Evol. Comput., vol. 3, no. 2, pp. 82– 102, Jul 1999.
[18] N. Noman and H. Iba, “ Accelerating differential evolution using an adaptive local search,” IEEE Trans. on Evol. Comput., vol. 12, no. 1, pp. 107– 125, Feb 2008. [19] P. N. Suganthan, N. Hansen, J. J. Liang, K. Deb, Y.-P.
Chen, A. Auger, and S. Tiwari, “ Problem definitions and evaluation criteria for the CEC2005 special session on real-parameter optimization,” 2005. [Online]. Available: http://www.ntu.edu.sg/home/EPNSugan
[20] C. Shaw, K. Williams, and R. Assassa, “ Patients’ views of a new nurse-led continence service,”Journal of Clinical Nursing, vol. 9, no. 4, pp. 574– 584, 2003.
[21] J. Zhang and A. C. Sanderson, “ JADE: Adaptive differen-tial evolution with optional external archive,”IEEE Trans. on Evol. Comput., vol. 13, no. 5, pp. 945– 958, Oct 2009. [22] J. Brest, S. Greiner, B. Boˇskovi´c, M. Mernik, and V.Zumer, “ Self-adapting control parameters in differentialˇ evolution: A comparative study on numerical benchmark problems,”IEEE Trans. on Evol. Comput., vol. 10, no. 6, pp. 646– 657, Dec 2006.
Wenyin Gongreceived the B.Eng., M.Eng., and PhD degrees in computer science from China University of Geosciences, Wuhan, China, in 2004, 2007, and 2010, respectively.
Dr. Gong is currently with School of Computer Science, China University of Geosciences, Wuhan, China. He has pub-lished over 20 research papers in journals and international conferences. He is interested in differential evolution, memetic algorithms, multiobjective optimization, and their applications.
Zhihua Cai received the Bsc degree from Wuhan University, China, in 1986, the Msc degree from Beijing University of Technology, China, in 1992, and the PhD degree from China University of Geosciences, in 2003.