A New Method to Analyze
Asynchronous P-CSMA
Lin Gao
School of Electrical and Information Tianjin University, Tianjin, China
School of Science and Technology Tianjin Economic and Financial University, Tianjin, China Email: [email protected]
Zhijun Wu
School of Electronics & Information Engnieering Civil Aviation University of China, Tianjin, China Email: [email protected]
Abstract—Different from synchronous mode, asynchronous p-CSMA has no timeslot. As a result, the propagation delay between nodes can not be ignored and will have heavy effect on the probability of packets collision. From the view of the packets collision, the paper for the first time establishes a preemptive asynchronous p-CSMA probability model with consideration of the propagation delay and reveals the essence of interaction within multi-nodes. The network performance can be evaluated through the targets of throughput and packets delay with the probability model. Based on a typical asynchronous p-CSMA network -- VDL2, simulations are also carried out to verify the correctness of this model in this paper. Finally, trends of key targets are given.
Index Terms—p-CSMA, propagation delay, sensitive areas, asynchronous mode, Poisson distribution, VDL2
I. INTRODUCTION
A. p-CSMA Protocol
In the early random media access modes, such as ALOHA, each user is independent to send packet. The conflict probability increases exponentially with the payload increasing, which leads to low channel efficiency and throughput. In contrast to ALOHA, CSMA can sense the channel and judge if it is busy or not before transmitting packet. By this means, the user only has the opportunity to transmit when channel is idle and the system performance is improved obviously. As a widely used channel-access method, p-CSMA is evolved by CSMA.
The basic principle of p-CSMA is as follows:
1) In the case of sensing channel busy, the transmitting station keeps monitoring until it senses the channel free. Then, it will send packet with probability p, or will not send with the probability 1-p.
2) In the state of channel being free, if there is packet waiting to send and the packet isn’t sent due to not in the coverage of p-value, the station will not to sense for a instant and will re-sense the channel after 2
τ
1. Then, it will continue to monitor, repeating the process 1).
1 Symbolτ represents the delay for radio propagation from one station to the other station in peer communication.
According to whether timeslot is applied, p-CSMA can be divided into synchronous mode and asynchronous mode. The former, a channel are divided into timeslots and all the nodes are synchronized by master clock. Message can only be sent at the starting moment of a slot. In contrast, the latter has no time-slot and no synchronization.
B. Related Work
The theoretical research into CSMA series generally can mainly be divided into two stages: in the first stage, the typical character is, one of the Internet founders, Kleinrock who has published his landmark papers on packet switching by radio from the mid 1970s. In paper [1], throughput-delay characteristics are given for ALOHA, CSMA and p-CSMA and the large advantage which CSMA provides is shown as compared to the random ALOHA. In paper [2], system stability problems are discussed. Around 2000, Bianchi published several important papers in analyzing the DCF performance in CDMA/CA [3], which marks the beginning of the second stage. In the premise of saturation, Bianchi model is established based on two-dimension Markov chain. Based on the Bianchi model, the probability relationship between packet-success and collision is revealed.
In recent years, Richard MacKenzie [4] expounds how the throughput and delay for the traffic flows are affected by the relative p-persistence. Taking the capture effect into account, Salim Abukharis discussed [5] the analysis method of throughput and packet delay in the Rayleigh fading channel. In [6], a view is pointed out: with the small transmitting probability, throughput has nothing to do with retransmission strategy, but it is only relevant to propagation delay. Paper [7] discusses the long-delay hidden terminal problem which is decided by propagation delays between finite nodes.
C. Research Purpose
value. Conclusion is arrived based on above precondition that the performance of synchronous mode is better than that of asynchronous mode. But nowadays, the advantage of later is paid more attention: it saves the time of waiting in timeslot and facilitates the realization. As a result, the asynchronous mode is applied in distributed network, especially in next generation of aeronautical data link-VDL 2 [8, 9]. In the asynchronous mode, the propagation delay can not be ignored and will have a heavy effect on the probability of the packet collision. The researches [7] take the different delays among nodes into consideration, but with the assumption that there is only one node as destination in the network while other N nodes are sending ones. Therefore, the conclusion gotten has great limitation.
From the view of packet collision, this paper establishes an asynchronous preemptive p-CSMA model, with full consideration of the propagation delay.
II. THEORY AND METHODOLOGY
A. Thinking
For the preemptive multiplexing, the probability of collision plays a vital role: in the ideal channel, no-collision means that a packet transmits successfully in a cycle; otherwise, all of the transmissions fail in the cycle. Although p-CSMA have the ability of channel detection and probability decision, packet collision is still inevitable. This is because:
1) When more than one station both has packets to send and have detected the channel to be free within the p-value, they will send messages at the same time, which will cause packets to collide.
2) Due to the existence of propagation between the stations, a sent packet should only be heard by a station after the propagation delay
τ
. Therefore, in the period ofτ
, the station will think the channel to be idle and may send message to lead to conflict.It is obvious that collision probability of 2) is far greater than that of 1). Therefore, in the following analysis, collision 1) is neglected and only collision 2) is taken into account.
The accumulated period of multi-collisions will be critical and sensitive to the success of packet- sending, forming so called “sensitive areas” in the paper.
B. Assumptions
To simplify the discussions and statements, we give some assumptions as follows:
1) With the same as Kleilirock model [1], we assume that the new-generated packets comply with Poisson distribution and a new-generated packet will be rescheduled to send in a future time if it can’t be sent immediately. If the interval to retransmit is long enough, according to [1], the two kinds of packets can combine into a Poisson flow with a new intensity. Here, the combined Poisson intensity of station i is marked as λi.
2) We assume that packet length (l) comply with uniform distribution, and we have l~U(la, lb), where la and
lb represent the lower and upper bound of the distribution
respectively.
It should be pointed out many networks can be abstracted into the two assumptions above. Furthermore, the changed distributions will not affect the analysis method fundamentally.
C. Modeling
We symbolize for the p-value of station i. We take
function as the distance between station i and j at
the moment of t. Accordingly, we take as the propagation delay between station i and j, and we have
= /C, where C is the light speed.
i
p
( ) ij
d t
( ) ij t
τ
( ) ij t
τ d tij( )
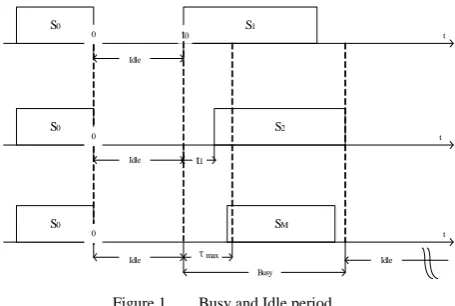
S0 S1
S2
SM
S0
S0
Idle
Idle
Idle
Busy
τmax
Idle
0 t
t
t
t1
t0
0
0
Figure 1. Busy and Idle period
As shown in figure 1, if station Sp1 has just sent a
packet out and all the other stations no packets to send at the moment, the channel goes into an idle period. In the following, we take the moment as the origin of time coordinates. We re-symbolize S0 for the station and Sp1
for the original S0. To be a message sender, a station has
to meet the three conditions as follows:
1) The station has sensed the channel to be idle. 2) There is at least one packet waiting to be sent. 3) The random probability locates in the coverage of p value.
If station Sp2 arrives at the packet-sent conditions
ahead of all the others (at the moment of t0), it will
become the first sender after the current S0. We call it S1
(replace the subscript with the original S1) and we have
0
t ≥ τ01. To be the next sender, a station need not only
satisfy the three conditions for the current S1, but also
meet the condition that the station does not hear the sending packet from S1 before it sends. If a station except
S1 arrives at the above three conditions ahead of all the
others (at the moment of t1), it will become the second
sender in the idle period. We call it S2, and we have
1
t ≥ τ02 andτ12 >t1−t0. So is S2,…, SM, and so on, where
SM is the last station to send packet in the idle period.
In the paper, idle period (T0) is defined as the duration
from the moment of channel being idle to t0. In contrast,
busy period (T1) is defined as the duration from t0 to the
sending. An idle period is followed by a busy period, vice versa. A cycle (T) is the summation of T0 and T1.
From the analysis above, we can see that the only condition of Si to be S1 (represented as Si=S1, S2 is similar,
and so on) is that xi is the shortest, where xi is the time
from the origin of time coordinates to the moment of station i having a packet to send within p-value. xi can be
divided into two sub-fractions: one is the interval from the moment of channel idle to station i find the channel idle, which is decided by the distance between Si and S0;
the other is the interval from the moment of finding channel idle to that of having a packet to send within p-value, which is decided by packet rate and p-value of Si.
We suppose there are L stations randomly within p-value of the total N stations. Taking the independency of stations into account, we calculate the conditional probability of Si=S1, as shown in (1):
0 0 1 (0) (0) ( ) L j i
i i i
j i
d d
P S S L p P
C τ C τ
≠
= = ⎡⎢⎛⎜ + ⎞⎟ ⎜<⎛ + ⎞⎟⎤⎥
⎝ ⎠ ⎝ ⎠
⎣ ⎦
∏
j (1)For S1, we have absolute probability:
1
( i )
P S =S =P S( i =S L P L1 ) ( )
1 0 0 0 (0) (0) ( ) L N j i i i
L j i
d d
p P L P
C τ C
−
= ≠
= ⎡⎢⎛⎜ + ⎞⎟ ⎜<⎛ ⎞⎤⎥
⎝ ⎠ ⎝ ⎠
⎣ ⎦
∑
∏
+τj⎟ (2)For all the stations, due to the assumption that the packet rate complies with Poisson distribution, the packet-arrived interval must comply with the exponential distribution which mean is the reciprocal of the strength of the Poisson distribution. We can calculate the packet-arrived joint probability density, as in (3):
f( ,τ τi j)= f( )τi f( )τj = i i ie
λ τ
λ − j j
je
λ τ
λ −
(3)
When supposing 0 0
(0) (0) j i ij d d a C −
= , there is the result
as shown in (4):
0 0i(0) j(0)
i d d
P
C +τ < C +
⎡⎛ ⎞ ⎛ ⎞⎤
⎜ ⎟ ⎜
⎢⎝ ⎠ ⎝ ⎥
⎠
⎣ τj⎟⎦
a
eλ τ e λ τ d
τ τ
j j i i
i j ij
i j id j
λ − λ − τ
− <
=
∫∫
τ i aij ji j e λ λ λ λ
=
+ (4)
From (2) and (4), we can get (5):
1 1
1 0
( ) ( ) ijj
L N
a i
i i
L j i i j
P S S p P L λ e λ
λ λ − − = ≠ = = + ⎛ ⎞ ⎜⎜ ⎝ ⎠
∑
∏
⎟⎟ 0 (5)Taking T0 =t into consideration, we have:
0 1 0 0
(0) (0) 1
[ ] i i
i i
i
d d
E t S S E
C τ C λ
= = ⎡⎢ + ⎤⎥= +
⎣ ⎦ (6)
From (5) and (6), we can get the idle period expectation, as in (7):
0 0 1
[ ] [ i ] ( i )
N
E T =
∑
E t S =S P S =S11 1
0
0 1
(0) 1
( ) ij j
L N
a
i i
i
i i N j i i
d
p P L
C λ λ λ λ λ − −
= − ≠ j
e ⎡ ⎤ ⎡ ⎤ = ⎢ + ⎥⎢ + ⎥ ⎢ ⎥ ⎣ ⎦ ⎣ ⎦
∑
∑
∏
(7)Similar to the analysis of S1, we have the follow
equations for S2 when
1i( )0 0i(0) i
d t d b =
C
−
is supposed.
2 2
( i ) ( i ) (
N
)
P S =S =
∑
P S =S L P L(
0)
0
0
2
1 1
( 0 )
( ) ( ) i i ijj i i L a i
N j i, j i j d
t
b +t C
i P L e
+
p e e λ
λ λ λ λ λ − − ≠ ≠ − − − =
⎡
⎢
−⎤
⎥
⎣
⎦
∑
∏
(8)From (8), we can get the expectation of t1, as in (9):
1 1 2
[ ] [ i ] ( i )
N
E t =
∑
E t S =S P S =S2[ ]
[ ]0 0 [ ]0 ( 0) ( ) 0 0 1
(0) 1 i
i
i i d
E T
b E T
i C
i
N i
d
p E T e e
C λ λ λ − − − + − ⎛ ⎞ ⎜ ⎟ ⎝ ⎠ = ⎡⎢ + − ⎤⎥⎡⎢ − ⎤⎥ ⎣ ⎦ ⎣ ⎦
∑
22 , 1
( ) ij j
L
a i N j i j i j
P L λ e λ
λ λ
−
− ≠ ≠ +
⎡ ⎤
⎢ ⎥
⎣
∑
∏
⎦ (9)
From the way to analyse , we can deduce: on the one
hand, we have
1
S
[
]
1
1 0 max
1 ( ) N i i d t t C − = ≤
∑
, where[
d t1( )0]
maxrepresents the maximum distance between S1 and other
N-1 stations, as a result of which P S( i =Sk) gets smaller
with getting bigger. On the other hand, pay attention to the follow equation:
k 1 0 0 (0) 1 [ ] k i
k i k i
i i d
E t S S E t
C λ
−
=
= = + − ⎡⎢⎣
⎦
∑
⎤⎥ (10)In (10),E t S[k i =Sk] gets smaller with
1 0 k i i E t − = ⎡
⎢⎣
∑
⎦⎤⎥ getting bigger. Because:[ ]k [k i k] ( i k) N k
E t E t S S P S S
−
=
∑
= = (11)We have:
E t[N−1] " E t[ ]2 E t[1] (12)
1 1 1 0 [ ] [ ] [ ] N i i Due to (12), we have:
T E l t E t E l
−
=
= ⎡⎢ + ⎤⎥≈ +
⎣
∑
⎦E (13)
P-CSMA performance can be valued by the targets as follows:
Definition 1: success rate (Ps) is defined as the
proportion of packets being sent to the peer successfully to the total packets sent.
[
2]
11 ( )
s i
i
P P S S
≠
=
∏
− = (14)Definition 2: throughput (S) is defined as the
proportion of the bit rate of packets being successfully sent and channel capacity (v)2.
From the definition 2, we have:
lim lim
i s i
n s n
n n
i i
n n
l P l
P S
v T v T
→∞ →∞
=
∑
=∑
∑
∑
(15)For any i and j, Ti has relevance to lj only in the case of
i=j. Due to the low degree of correlation, we approximately regard them as independent parameters. We can calculate the throughput expectation, as in (16).
[ ] lim
i
s n
n i n
l P
S E S E
v →∞ T
= =
⎡ ⎤
⎢ ⎥
⎢ ⎥
⎢ ⎥
⎣ ⎦
∑
∑
[ ]
[ ]
0[ ]
1lim i n
s s
n
i n
E l
E l
P P
v v E T
E T
→∞
≈ =
+
⎡ ⎤
⎢ ⎥
⎣ ⎦
⎡ ⎤
⎢ ⎥
⎣ ⎦
∑
∑
E T (16)Definition 3: packet delay (τs ) is defined as the
duration of packets being sent out successfully. From definition 3, we have (17) and (18):
τs = −T T P1 s =(T0+T1)−T P1 s =T0+
(
1−P Ts)
1 (17)τs =E T[ ]0 + −
(
1 P Es)
[ ]T1 (18)Definition 4: channel efficiency (η ) is defined as the
proportion of the working time to the total time of a channel.
Similar to definition 2, we have (19):
η ≈ 1
0 1
[ ]
[ ] [ ]
E T
E T +E T (19)
From (7), (8) and (13), we can calculate the targets defined in (14), (16), (18) and (19) and can evaluate the network performance in a quantified way.
III. SIMULATION BASED ON VDL2
Asynchronous p-CSMA is typically applied in VDL2 air-ground communication. In order to simulate the
2 In the definition, channel capacity represents the maximum bit rates of a communication system. With limited bandwidth, it must satisfy the Nyquist theory or the first (or second) Nyquist law to guarantee no inter-symbol interference.
performance of asynchronous p-CSMA, a model has been constructed and programmed for VDL2 protocol based on OPNET 14.5 platform [10-12].
A. VDL2 Modeling
VDL2 is the product of the aviation development: With the rapid growth of Air transport, the original ACARS architecture has not been able to satisfy the need of civil-aviation communication in both throughput and service quality. To meet the problem, ICAO proposed a plan to establish a global, seamless and interconnection network - ATN, which will feed air traffic management (ATM) and become the future infrastructure in the field of aviation- communication. As one of four VHF data-link modes, VDL2, which can provide reliable network services for ATN, has been tested in Europe and identified as the main stream in the transition from current system to ATN [8, 9].
In VDL2, there are two sides of communication: ground station (GS) and aircraft (AC), by which a peer entity is composed. The communication can only be realized in half-duplex manner by peer entities, which work with the band of 25 kHz/channel in the coverage of 118 to 136 MHz.
VDL2 applies hierarchical structure and conforms to ISO standard. From the bottom to the upper, there are three layers in VDL2 protocol stack [13]: physical layer, data link layer and network layer. The multi-layer structure is realized in the nodes of both GS and AC:
1) Physical layer: The layer is responsible for the maintenance of physical data transmission over wireless channel, realizing the functions of modulation, error detection and correction, bit synchronization and provide the quality of service parameters to the upper layer [14].
2) Data-link layer: The layer can realize media access, flow control, frame synchronization, link establishment and maintenance, handover functions.
The data-link layer consists of two sub-layers and an entity [15]: the medium access control sub-layer (MAC), data link service layer (DLS) and very high frequency link management entity (VME), the functions of which are as follows: ① MAC: Media access control and channel multi-plexing; ② DLS: Traffic control and Error detection\ recovery; ③VME: Data link establishment\ release and handover.
3) Subnet layer: the layer can realize routing and packet assembly\disassembly functions. Within Subnet layer of node models, Poisson flow can be generated with certain intensity (λ) as data source for lower layers.
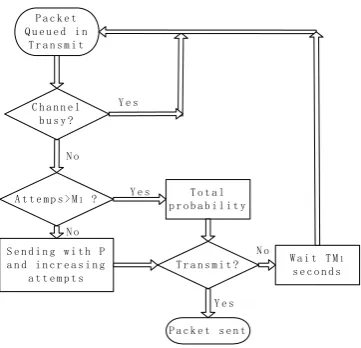
Asynchronous p-CSMA is applied and executed in MAC. In asynchronous p-CSMA, a transmitter will wait for the channel to be idle and sense the channel state with the interval of TM1. If he has found the channel is not
busy within the maximum access number (M1), he will
attempt to send a packet to the media with the probability p, or he will go back to wait with the probability 1-p. If the access number reaches M1, he will send message with
Figure 2. asynchronous p-CSMA flow chart
In MAC of VDL2, parameter TM2 is applied to indicate the channel maximum busy-time [15]. If the busy-time is over TM2, the channel will be taken as congestion. Accordingly MAC will inform the condition to VME, which will initiate the handover process.
The defaults [14] of parameters are listed in table 1.
TABLE I. PARAMETERS OF MAC IN VDL2
Parameter Name Default Increment M1 maximum access times 135 1
P persistence 13/256 1/256 TM1 Inter-access delay 4.5ms 0.5s TM2 Channel busy 60s 1s
Taking asynchronous p-CSMA as center, we have constructed and programmed the MAC process model. The MAC process of GS side is shown in Fig.3.
Figure 3. MAC process model of GS
As shown in Fig.3, state INIT fulfills the tasks of variable initialization, object\ simulation parameters reading, statistic registration and TM1 timer initialization.
DATA_CHAN reads Channel busy\idle statistics from physical layer and updates the message for media access. TM1_intr_des achieved the implementation of TM1 timer. State STORE realizes data stream shunting function with the application of queue. The received data stream is transmitted to the upper layer in a transparent way. According to the type of information, data packets are delivered into different queues waiting for processing. DATA_ACCE implements the algorithm of P-CSMA and realizes the probability decision. Common signaling channel (CSC) is working on the fixed frequency of 136.975 MHz. The State type of CSC is in symmetry with that of DATA and realizes processing and transmitting of signaling.
The MAC modeling method of AC side is similar to that of GS side. The main difference exists in that not only one GS can be connected and switched to an AC. Therefore, there are multiple frequency channels in an AC model.
C h a n n e l b u s y ?
A t t e m p s > M1 ?
S e n d i n g w i t h P a n d i n c r e a s i n g
a t t e m p t s P a c k e t Q u e u e d i n
T r a n s m i t
T o t a l p r o b a b i l i t y
W a i t T M1
s e c o n d s T r a n s m i t ?
P a c k e t s e n t Y e s
N o
Y e s N o
Y e s N o
B. Simulation
Figure 4. multi-ACs scenario
In the simulation, 16 ACs are equipped with scattered position around GS, which can closely meet the condition of the theory in the paper. The multi-ACs scenario is shown in Fig.4.
In simulation, parameter iat is defined as the mean of exponential distribution of the packet interval and we have iat=1 / λ ground on Poisson theory. For packet length, we set the lower and upper limit to be =128 bits
and =8320 bits according to VDL2 protocol and assume that the random variable abides by uniform distribution.
a l
b l
By changing parameters in different groups, we can get the trends of performance targets and acquire the correlations between targets.
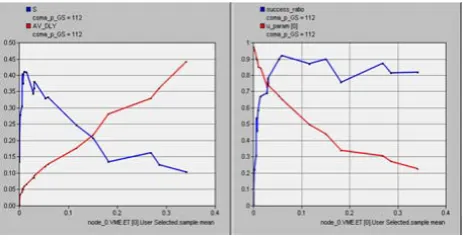
As shown in Fig.5, the trends of targets are not sensitive to p value in a large coverage. With iat getting bigger, success rate gets higher and channel efficiency (u_param) gets lower. Throughput (S) performs in a parabola-alike curve. When p=8 and iat=1.5, throughput arrives at the maximum of about 40%.
Figure 6. delay trends vs through and iat
In Fig.6, we can see that packet delay has a proportional relationship with iat and an inversed relationship with throughput.
From (16), (18) and (19), we can see that the expectations of idle and busy period are keys to calculate the targets of both throughput and packet delay as well as channel efficiency. From (7) and (13), we know that E[T0]
and E[T1] change in opposite direction. Therefore, we can
focus on E[T0], which is decided by multiple parameters.
The simulation results are shown in Fig.7. From the figure, we can see E[T0] has positive correlation with
packet delay and has negative correlation with throughput and channel efficiency. There is no obvious correlation between success rate and E[T0]. The results
are in consistent with the theory we deduced.
Figure 7. E[T0] trends with parameters
With the method of numerical analysis, the simulation results have the good consistency with preemptive probability model we set up, which can verify the correctness of the mathematic model.
Furthermore, different scenarios are built by changing the distribution of nodes positions. The results of simulation become complicate and variable. But with the multiple experiments, we can see that distribution pattern has a significant impact on the system performance. Specially, packets collisions will aggravate as the locations of stations become more uneven. The conclusion conforms to the sequitur from the probability model that success rate is negatively related to the sum of the absolute value of d tij( )− dik( )t , where: i≠ ≠j k and
, , (0, 1) i j k∈ N− .
IV. SUMMARY
Taking propagation delay into account, a preemptive probability model is built for asynchronous p-CSMA. With the idle and busy period expectation calculated in the probability model, throughput and packets delay can be achieved.
The model can also be simplified by specialization. For instance, it can be specialized on Bianchi’s critical saturation condition [3]. Under the condition, the actor of packet rate is eliminated.
The simulation model is built on OPNET platform for VDL2, in which asynchronous p-CSMA is typically applied. Through simulation, the probability model is verified in different scenarios with both fixed position distribution and varied position distributions.
APPENDIX
Solution of P L( )
The probability of Lcan be decided by the generating function P s( ) . To any station, Xi comply with 0-1 distribution, where Xi represents the random event of whether station Si passes the p-value.
0 1 i
fail X
pass
=
⎧
⎨
⎩
(A.1)From (A.1), we have:
1 0
( ) [ Xi] ( 1)
i i i i i i
P s =E s =p s +q s = p s+q p +qi = (A.2)
Take 1
i N
L X
−
=
∑
into consideration, we have:
1
( ) ( i i) N
P s p s q
−
=
∏
+ (A.3)In (A.3), P L( ) is just the coefficient of L
s in the
1
1 1
( ) ( ) 1
N
N N p
P s ps q q s
q
−
− −
= + = ⎛⎜ + ⎞⎟
⎝ ⎠ (A.4)
From the binomial theorem, there is (A.5):
1
1
( )
L N
N p
P L q C
q
−
−
= ⎛ ⎞⎜ ⎟
⎝ ⎠ L
(A.5)
ACKNOWLEDGMENT
This work is financially supported by the National Natural Science Foundation of China (No. 61170328), and Natural Science Foundation of Tianjin (No. 12JCZDJC20900).
REFERENCES
[1] Kleinrock L. and Tobagi, F.A., “Packet Switching in Radio Channels: Part I-Carrier Sense Multiple-Access Modes and Their Throughput-Delay Characteristics,” IEEE Transactions on Communications, Vol. COM-23, No. 12, December 1975, pp. 1400-1416
[2] Tobagi, F.A., and Kleinrock L., “Packet Switching in Radio Channels: Part IV-Stability Considerations and Dynamic Control in Carrier Sense Multiple Accesses,” IEEE Transactions on Communications, Vol. COM-25, No. 10, October 1977, pp. 1103-1119
[3] Giuseppe Bianchi, “Performance Analysis of the IEEE 802.11 Distributed Coordination Function,” IEEE Journal On Selected Areas In Communications, Vol. 18, No. 3, March 2000, pp. 535-547
[4] Richard MacKenzie, and Timothy O’Farrell, “Throughput and Delay Analysis for p-Persistent CSMA with Heterogeneous Traffic,” IEEE Transactions On Communications, Vol. 58, No. 10, October 2010, pp. 2881-2891
[5] Salim Abukharis, Richard MacKenzie and Timothy O’Farrell, “Throughput and Delay Analysis for a Differentiated p-Persistent CSMA Protocol with the Capture Effect,” Vehicular Technology Conference, IEEE 73rd, May 2011, pp. 1-5
[6] Yayu Gao and Lin Dai, “On the Throughput of CSMA,” Information Sciences and Systems (CISS), 45th Annual Conference, 2011, pp. 1-4
[7] Wang Deqing, Hu Xiaoyi, Xu Fang, Chen Huabin, Wu Yindong, “Performance analysis of P-CSMA for underwater acoustic sensor networks,” OCEANS 2012 MTS
[8] Zheng Huiyuan, Zhang Xuejun, Zhang Jun, “Migration from ACARS to New VHF Data Link in China,” Intertional Conference on ITS Telecommunications Proceedings, Jun 2006: 1297-1300 [9] Chris A. Wargo, Jean-Francois D’Arcy, “Performance of Data Link
Communications in Surface Management Operations,” Aerospace Conference, IEEE, pp. 1-10, 2011.
[10] Cao Wen-jing, Xu Sheng-hong, Shi Jian-hong, “Research on Performance of CSMA Protocol Based on OPNET, ” Journal of Naval Aeronautical and Astronautical University, Vol. 26, No. 3, pp. 262-266, March 2011.
[11] Steven Bretmersky, and Rafael Apaza , “Estimation of VDL Mode 2 with Hidden Transmitters, ” Aerospace conference, IEEE, pp. 1-11, March 2009.
[12] Han Yaqi, Zhang Xuejun, Zhang Jun, “Simulation Research on Parameters of VDL Mode2,” Journal of Computer Simulation, Vol. 23, No. 11, pp. 67-70, November 2006.
[13] ICAO, VDL-2 Standards and Recommended Practices [SARPS] [14] ICAO, "Manual of Technical Provisions for the Aeronautical
Telecommunication Network (ATN),” First Edition, Doc 9705-AN/956, International Civil Aviation Organization, 1998.
[15] ICAO, Annex 10 Aeronautical Telecommunications, Volume III Part I Digital Data Communication Systems, 2007.
Lin Gao is a Ph.D. candidate in wireless networks at
Tianjin University. He is also an instructor at School of
Science and Technology of Tianjin Economic and Financial University. His current research areas are communication key technology and digital signal processing.
Zhijun Wu is a professor and doctoral supervisor at Civil