149806-3737-IJET-IJENS © December 2014 IJENS I J E N S
Influence of Adding Bi\ or Bi-In on Structure and
Required Properties of tin-Copper Lead Free Solder
Alloy
Abu Bakr El-Bediwi, Amira El-Shafei, Mustafa Kamal
Metal Physics Lab., Physics Department, Faculty of Science, Mansoura University, Egypt, [email protected]
Abstract-- The aim of this research was to improve soldering properties of eutectic SnCu0.7 binary solder alloy. It is
considered as one of the alternates for Sn-Pb solders with melting temperature is 227 ºC. To verify this aim, effect of adding bismuth\ or bismuth- indium on structure, wetting behavior, melting temperature, electrical resistivity, elastic modulus and internal friction of tin-copper eutectic alloy has been investigated. Matrix microstructure such as lattice parameters, unit cell volume and formed crystal structure of Sn99.3Cu0.7 alloy
changed after adding bismuth or bismuth-indium. Melting temperature and contact angle of Sn99.3Cu0.7 alloy decreased after
adding bismuth or bismuth- indium. Electrical resistivity of Sn99.3Cu0.7 alloy increased but elastic modulus decreased after
adding bismuth or bismuth- indium. The Sn79.3Cu0.7Bi20 and
Sn69.3Cu0.7Bi20In10 alloys have best properties as a lead free solder
alloys for electronic industrial applications.
Index Term-- wetting behavior, mechanical properties, microstructure, eutectic alloy, melting temperature, electrical resistivity
1.INTRODUCTION
In the electronic industry Pb-Sn solder is a very important material but Pb is toxic and has adverse effects on the environment and human beings. Due to the harmful effects of Pb the use of Pb-Sn solder alloys are being avoided and new Pb-free solder alloys are being used for electronic applications. The new lead free solders should have some desirable properties like wettability, low melting temperature, corrosion resistance, good electrical conductivity and good mechanical and material properties.
Solders are divided into two basic categories: eutectic and non-eutectic. Eutectic solders such as 63Sn- 37Pb have a distinct 183 °C melting point. Non-eutectic solders have a solidus and liquidus region. Many studies have been made on various lead free solder alloys based on Sn, e.g., Sn-9Zn, Sn-3.5Ag, Sn-3Ag-0.5Cu, etc. as possible alternatives [1- 3
[
. The properties of Sn-3.5%Ag-1%Zn and Zn-In lead free solder alloys are described by M. Mc Cormack et al]
4[
. Microstructure and mechanical properties of Sn-58Bi, Sn-52In and Sn-3.4Ag lead free solder alloys are reported]
5[
. Also structure, electrical resistivity, wettability, melting point and elastic modulus of 50Sn-50In, 72.2Sn-20In-2.8Ag,72.5Sn-25In-2.5Ag and 95Sn-5Ag lead free solder alloys have been investigated]
6[
. Influence of adding In on solidus and liquidus temperatures, wetting time, wetting force, tensile strength and microhardness of Sn-0.3Ag-0.7Cu lead-free solder alloy hasbeen investigated [7
[
. Adding 1% of In to Sn-9Zn-0.5Ag alloy decreased melting point of alloy and enhanced adhesion strength of alloy on Cu substrate. Also Sn-In-Ag system offers several advantages such as good wettability [8, 9], good corrosion behavior [10] and very satisfying interaction with the substrate, especially with copper [11]. The eutectic Sn-0.7Cu binary solder alloy is also considered as one of the alternates for Sn-Pb solders. This solder shows better creep and fatigue resistance compared to the Sn-Pb solders [12]. The aim of this work is to study the effect of adding bismuth or bismuth- indium on structure, wetting behavior, thermal, electrical and mechanical properties of tin-copper eutectic alloy.2. EXPERIMENTAL WORK
In the present work, Sn99.3-xCu0.7Bix (x= 0, 5, 10, 15 and 20 wt. %) and Sn79.3-xCu0.7Bi20Inx (x= 0, 2.5, 5, 7.5 and 10 wt. %) were melted in a muffle furnace using tin, copper, bismuth and indium of purity better than 99.5 %. The resulting ingots were turned and re-melted four times to increase the homogeneity. From these ingots, long ribbons of about 4 mm width and ~70 µm thickness were prepared by a single roller method in air. The surface velocity of the roller was 31.4 m/s giving a cooling rate of ~3.7 × 10⁵ K/s. The samples then cut into convenient shape for the measurements using double knife cuter. Microstructure of used samples was studied using a Shimadzu x–ray diffractometer (Dx–30, Japan) and scanning electron microscope JEOL JSM-6510LV, Japan. Also electrical resistivity and DTA thermographs were obtained by a conventional double bridge method and SDT Q600 V20.9 Build 20 instrument with heating rate 10 k/min. The internal friction Q–1 and the elastic constants were determined using the dynamic resonance method. The value of the dynamic Young modulus Eis determined by relationship [13– 15].
3. RESULTS AND DISCUSSION
Effect of adding bismuth on structure of Sn99.3Cu0.7 alloy
149806-3737-IJET-IJENS © December 2014 IJENS I J E N S
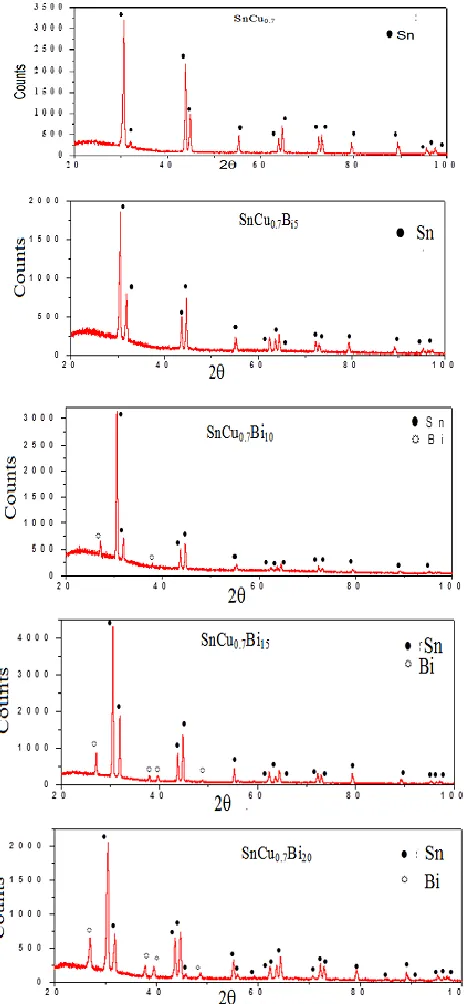
Fig. 1. X-ray diffraction patterns of Sn99.3-xCu0.7Bix alloys
phase (Sn phase+ solid solution). That is mean that, Cu and Bi atoms dissolved in Sn matrix changing its structure, lattice parameters and unit cell volume as listed in Table (I). Also matrix structure such as crystallinity, crystal size and orientation of Sn99.3Cu0.7 alloy changed after adding bismuth. Lattice parameters, (a and c), and unit volume cell of β- Sn phase for Sn99.3-xCu0.7Bix alloys were determined from equations (1) and (2) [16].
(1) (2)
The maxima of the diffraction pattern are broadened by an amount inversely proportional to the crystallite size and measurement of the additional broadening thus gives a means of estimating the size through the formula given by Scherer equation [17].
Table (I) shows the calculated lattice parameters, unit volume cell and crystal size of β-Sn phase in Sn99.3-xCu0.7Bix (x= 0, 5, 10, 15 and 20 wt. %) alloys. The results show that, lattice parameters, unit cell volume and crystal size of β-Sn phase in Sn99.3Cu0.7 alloy changed after adding bismuth. That is because Bi atoms dissolved in matrix alloy changed its lattice parameters and matrix structure.
Table I
Lattice parameters, unit cell volume and particle size of β-Sn phase
Sample particle
size (Å) a (Å) c (Å) c/a
Unit cell volume (Å)3
Sn99.3Cu0.7 459.973 5.845 3.178 0.544 107.49
Sn94.3Cu0.7Bi5 428.574 5.864 3.181 0.542 108.11
Sn89.3Cu0.7Bi10 311.658 5.855 3.176 0.542 107.96
Sn84.3Cu0.7Bi15 398.569 5.851 3.19 0.545 107.34
Sn79.3Cu0.7Bi20 297.315 5.856 3.052 0.521 112.36
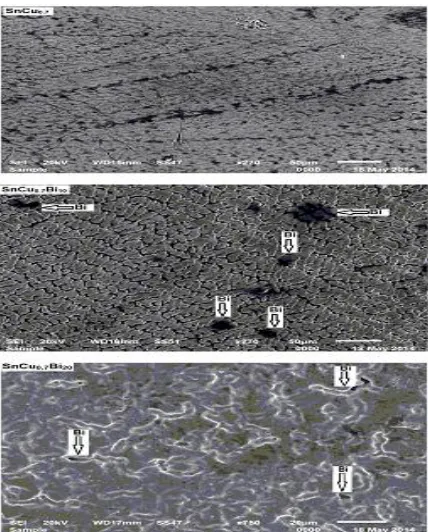
Scanning electron micrographs, SEM, of Sn 99.3-xCu0.7Bix (x= 0, 10 and 20 wt. %) alloys are shown in figure (2). SEM analysis of Sn99.3-xCu0.7Bix (x= 0, 10 and 20 wt. %) alloys showed considerable heterogeneity of micro-structure, which relate to the formation of β-Sn phase or β-Sn\ Bi phases or β-Sn\ Bi\SnBi phases , which also proved by the x-ray analysis.
Effect of adding bismuth on melting temperature of Sn99.3Cu0.7 alloy
149806-3737-IJET-IJENS © December 2014 IJENS I J E N S
Fig. 2. Scanning electron micrographs of Sn99.3-xCu0.7Bix alloys
Effect of adding bismuth on wetting behavior of Sn99.3Cu0.7 alloy
Wetting is a property of liquid to spread over a solid substrate, i.e., the tendency for a liquid solder to wet the substrate. It tells how a liquid and a solid are having an intimate contact between them. Wettability is characterized by the degree and rate of wetting. Degree of wetting depends on the contact angle formed at the interface as well as on the surface energy of interface. The rate of wetting is determined by how quick the liquid wets the surface and spreads over the substrate. Wettability is quantitatively assessed by the contact angle formed at the solder substrate’s flux triple point. Wettability is affected by a number of factors like thermal conductivity, viscosity of the molten solder and the possible chemical reaction at the interface [18]. The spreading of
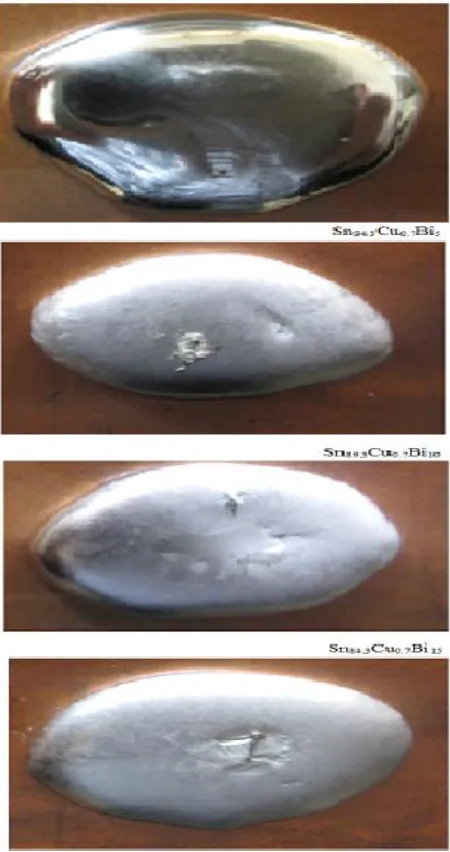
Sn99.3-xCu0.7Bix (x= 0, 5, 10, 15 and 20 wt. %) alloys on pure
Cu substrate at room temperature are shown in figure (4). The contact angle of Sn99.3-xCu0.7Bix (x= 0, 5, 10, 15 and 20 wt. %) alloys is listed in Table (III). From these results, it is clear that a significant change in contact angle of Sn99.3Cu0.7 alloy after adding bismuth. The Sn79.3Cu0.7Bi20 alloy has lower contact angle.
149806-3737-IJET-IJENS © December 2014 IJENS I J E N S
Table II
Melting points of Sn99.3-xCu0.7Bix alloys
Sample Melting point (ºC)
Sn99.3Cu0.7 231.55
Sn94.3Cu0.7Bi5 221.87
Sn89.3Cu0.7Bi10 214.92
Sn84.3Cu0.7Bi15 208.1
Sn79.3Cu0.7Bi20 200.74
Table III
Contact angles of Sn99.3-xCu0.7Bix alloys
Sample contact angle (θº)
Sn99.3Cu0.7 37.5±3.15
Sn94.3Cu0.7Bi5 31±2.1
Sn89.3Cu0.7Bi10 25.5±1.85
Sn84.3Cu0.7Bi15 25±1.9
Sn79.3Cu0.7Bi20 24±1.1
Effect of adding bismuth on electrical resistivity of
Sn99.3Cu0.7 alloy
In general, the plastic deformation raises the electrical resistivity as a result of the increased number of electron scattering centers. Crystalline defects serve as scattering center for conduction electrons in metals, so the increase in their number raises the imperfection. The measured electrical resistivity of Sn99.3-xCu0.7Bix (x= 0, 5, 10, 15 and 20 wt. %) is listed in Table (IV). Electrical resistivity of Sn99.3Cu0.7 alloy increased after adding bismuth. That is because dissolved bismuth atoms serve as scattering center for conduction electrons. Also bismuth is a semimetal with high resistivity.
Effect of adding bismuth on elastic modulus of Sn99.3Cu0.7 alloy
The elastic constants are directly related to atomic bonding and structure. Also it is related to the atomic density. Elastic moduli of Sn99.3Cu0.7 alloy decreased after adding bismuth as shown in Table (V). That is because adding bismuth effected on matrix bonding strengthen due to dissolved bismuth atoms on grain boundary/ or formed Bi phase.
The resonance curves Sn99.3-xCu0.7Bix (x= 0, 5, 10, 15 and 20 wt. %) alloys are shown in figure (5). Calculated internal friction and thermal diffusivity values of Sn 99.3-xCu0.7Bix are seen in Table (VI). The results show that, internal friction value of Sn99.3Cu0.7 alloy increased but thermal diffusivity decreased after adding bismuth.
Fig. 4. Photographs of solidified Sn99.3-xCu0.7Bix alloys on Cu
in air
Table IV
Electrical resistivity of Sn99.3-xCu0.7Bix alloys
Sample ρx10-8 Ω.m
Sn99.3Cu0.7 43.36±2
Sn94.3Cu0.7Bi5 46.8±1.95 Sn89.3Cu0.7Bi10 55.2±2.6
Sn84.3Cu0.7Bi15 59±3
149806-3737-IJET-IJENS © December 2014 IJENS I J E N S
Table V
Elastic modulus of Sn99.3-xCu0.7Bix alloys
Sample E GPa
Sn99.3Cu0.7 83.2±4
Sn94.3Cu0.7Bi5 73.6±3.2
Sn89.3Cu0.7Bi10 67.8±3
Sn84.3Cu0.7Bi15 66±2.5
Sn79.3Cu0.7Bi20 61.86±1.5
Fig. 5. Resonance curves of Sn99.3-xCu0.7Bix alloys
Table VI
Internal friction and thermal diffusivity of Sn99.3-xCu0.7Bix alloys
Sample Q-1 Dth x10
-4
cm2/sec
Sn99.3Cu0.7 0.04 1.52
Sn94.3Cu0.7Bi5 0.029 1.27
Sn89.3Cu0.7Bi10 0.0329 6.48
Sn84.3Cu0.7Bi15 0.03286 3.08
Sn79.3Cu0.7Bi20 0.0434 1.23
Effect of adding indium on structure of Sn79.3Cu0.7Bi20 alloy
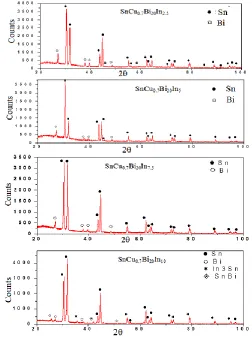
X-ray diffraction patterns of Sn79.3-xCu0.7Bi20Inx (x= 0, 2.5, 5, 7.5 and 10 wt. %) alloys are shown in figure (6). X-ray diffraction patterns of Sn79.3-xCu0.7Bi20Inx (x= 0, 2.5, 5 and 7.5 wt. %) have lines corresponding to body-centered tetragonal Sn phase and rhombohedral Bi phase. That is meant that, indium atoms dissolved in Sn matrix changing its structure, lattice parameters and unit cell volume as seen in Table (VII). Also x-ray diffraction patterns of Sn69.3Cu0.7Bi20In10 alloy have lines corresponding to
body-centered tetragonal Sn phase, rhombohedral Bi phase, rhombohedral SnBi and Sn3In intermetallic phases.
Table (VII) shows the calculated lattice parameters, unit volume cell and crystal size of body-centered tetragonal Sn phase in Sn79.3-xCu0.7Bi20Inx (x= 0, 2.5, 5, 7.5 and 10 wt. %) alloys. The results show that, lattice parameters, unit cell volume and crystal size of β-Sn phase in Sn79.3Cu0.7Bi20 alloy changed after adding indium. That is because In atoms dissolved in matrix alloy changed its structure.
Fig. 6. X-ray diffraction patterns of Sn99.3-xCu0.7Bi20Inx alloys
Table VII
Lattice parameters, unit cell volume and particle size of β-Sn phase
Sample particle size (Å) a (Å)
c (Å) c/a
Unit cell volume (Å)3
Sn76.8Cu0.7Bi20In2.5 371.567 5.86 3.186 0.543 10.7768
Sn74.3Cu0.7Bi20In5 370.715 5.86 3.193 0.544 10.755
Sn71.3Cu0.7Bi20In7.5 381.792 5.864 3.197 0.545 10.758
149806-3737-IJET-IJENS © December 2014 IJENS I J E N S
Effect of indium addition on melting temperature of Sn79.3Cu0.7Bi20 alloy
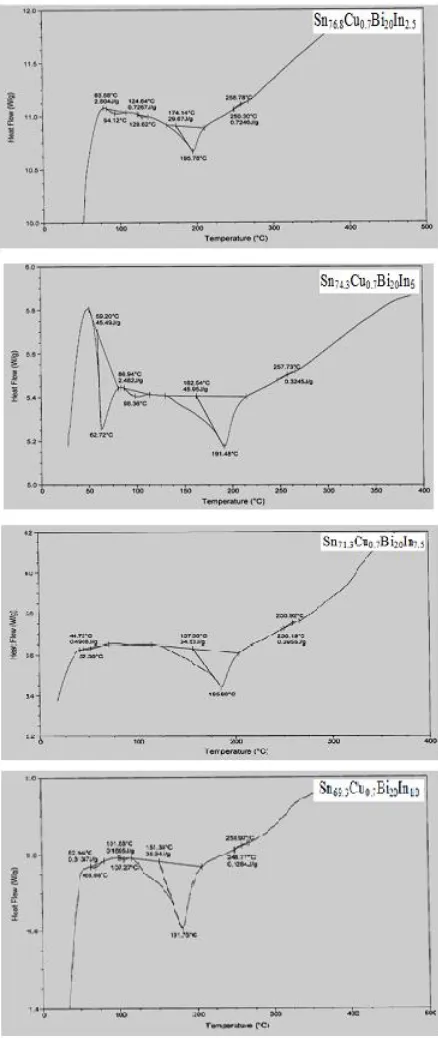
DSC thermographs of Sn79.3-xCu0.7Bi20Inx (x= 0, 2.5, 5, 7.5 and 10 wt. %) alloys are shown in figure (7). Thermo-graph of Sn79.3Cu0.7Bi20 alloy has a variation, (intensity, position and area), in its exothermal peak after adding indium. The melting temperature of Sn79.3Cu0.7Bi20 alloy decreased after adding indium as listed in Table (VIII). The Sn69.3Cu0.7Bi20In10 alloy has lowest melting point, 181.76 C.
Effect of adding indium on wetting behavior of Sn79.3Cu0.7Bi20 alloy
The spreading of Sn79.3-xCu0.7Bi20Inx (x= 0, 2.5, 5, 7.5 and 10 wt. %) alloys on pure Cu substrate at room temperature are shown in figure (8). The contact angle of Sn 79.3-xCu0.7Bi20Inx alloys is listed in Table (VIIII). Adding indium to Sn79.3Cu0.7Bi20 alloy caused a little increased in contact angle value.
Effect of adding indium on electrical resistivityof Sn79.3Cu0.7Bi20 alloy
The measured electrical resistivity of Sn 79.3-xCu0.7Bi20Inx (x= 0, 2.5, 5, 7.5 and 10 wt. %) alloys is listed in Table (IX). Electrical resistivity of Sn79.3Cu0.7Bi20 alloy increased after adding indium. That is because dissolved indium atoms serve as scattering center for conduction electrons.
Effect of adding indium on elastic modulus of Sn79.3Cu0.7Bi20 alloy
Elastic modulus of Sn79.3Cu0.7Bi20 alloy decreased after adding indium as shown in Table (IXX). That is because adding indium effected on matrix bonding strengthen due to dissolved indium atoms on grain boundary/ or formed Bi phase.
The resonance curves Sn79.3-xCu0.7Bi20Inx (x= 0, 2.5, 5, 7.5 and 10 wt. %) alloys are shown in figure (9).
Calculated internal friction and thermal diffusivity values of
Sn99.3-xCu0.7BixInx are seen in Table (IXXX). The results show
that, internal friction of Sn79.3Cu0.7Bi20 alloy increased but thermal diffusivity decreased after adding indium.
Fig. 7. DSC thermographs of Sn79.3-xCu0.7Bi20Inx alloys
Table VIII
Melting points of Sn79.3-xCu0.7Bi20Inx alloys
Sample Melting temperature (ºC) Sn76.8Cu0.7Bi20In2.5 195.78
Sn74.3Cu0.7Bi20In5 191.48
Sn71.3Cu0.7Bi20In7.5 185.8
149806-3737-IJET-IJENS © December 2014 IJENS I J E N S
Fig. 8. Photographs of solidified Sn79.3-xCu0.7Bi20Inx
alloys on Cu in air
Table VIIII
Contact angles of Sn79.3-xCu0.7Bi20Inx alloys
Sample contact angle (θº)
Sn76.8Cu0.7Bi20In2.5 33.5 Sn74.3Cu0.7Bi20In5 32.5 Sn71.3Cu0.7Bi20In7.5 29.5 Sn69.3Cu0.7Bi20In10 26
Table IX
Electrical resistivity of Sn79.3-xCu0.7Bi20Inx alloys
Sample ρx10-8 Ω.m
Sn76.8Cu0.7Bi20In2.5 65.2±2.15 Sn74.3Cu0.7Bi20In5 71.16±2.5 Sn71.3Cu0.7Bi20In7.5 88.33±4.23 Sn69.3Cu0.7Bi20In10 108.3±6.5
Table IXX
Elastic modulus of Sn79.3-xCu0.7Bi20Inx alloys
Sample E GPa
Sn76.8Cu0.7Bi20In2.5 58.7±1.25 Sn74.3Cu0.7Bi20In5 55.2±1.4 Sn71.3Cu0.7Bi20In7.5 93.4±3.15
Sn69.3Cu0.7Bi20In10 36.6±1.08
Fig. 9. Resonance curves of Sn79.3-xCu0.7Bi20Inx alloys
Table IXXX
Internal friction and thermal diffusivity of Sn79.3-xCu0.7Bi20Inx alloys
Sample Q-1 Dth x10-4 cm2/sec Sn76.8Cu0.7Bi20In2.5 0.034 4.56
Sn74.3Cu0.7Bi20In5 0.035 3.11 Sn71.3Cu0.7Bi20In7.5 0.013 1.63 Sn69.3Cu0.7Bi20In10 0.015 1.94
CONCLUSION
1. Matrix structure, (such as lattice parameters, unit cell volume and crystal size), of β- Sn, of Sn79.3Cu0.7 alloy changed after adding bismuth or bismuth\ indium which effects on all physical measurement.
2. Melting temperature of Sn79.3Cu0.7 alloy decreased after adding bismuth or bismuth\ indium
3. Electrical resistivity of Sn79.3Cu0.7 alloy increased after adding bismuth or bismuth\ indium
4. Elastic moduli of Sn79.3Cu0.7 alloy decreased after adding bismuth or bismuth\ indium
From our work it is concluded that, soldering properties such as melting temperature and contact angle of Sn79.3Cu0.7 alloy improved by adding Bi or Bi\In
REFERENCES
[1] R. K. Shiue, L. W. Tsay, C. L. Lin and J. L. Ou, J. Mater. Sci. 2003; 38: 1269
[2] A. Miiyamoto, T. Ogawa and T. Ohsawa, Mater. Sci. Res. Inter. 2003; 9: 16
149806-3737-IJET-IJENS © December 2014 IJENS I J E N S
[4] M. Mc Cormack, S. Jin, G. W. Kammlott and H. S. Chen, Appl. Phys. Lett. 1993; 63: 15
[5] J. Glazer, J. Electron. Mater. 1994; 23: 693-700
[6] A. El-Bediwi, M. El-Bahay, Radiat. Effect Defects Solids. 2004; 159: 133-40
[7] K. Kanlayasiri, M. Mongkolwongrojn, T. Ariga, Journal of alloys and Compounds. 2009; 485: 225-230
[8] D. R. Frear, j. Metals. 1996; 48 (5): 49-53
[9] I. Artaki, A. M. Jackson, P. T. Vianco, J. Electron. Mater.1994; 23 (8): 757
[10] H. Oulfajrite, A. Sabbar, M. boulghallat, A. Touaiti, R. Lbibb, A. zrineh, Mater. Lett. 2003; 57: 4368-71
[11] W. K. Choi, H .M. Lee, J. Korean., Phys. Soc. 1999; 35: 340-344 R.A. Islam, B.Y. Wu, M.O. Alam, Y.C. Chan, W. Jillek, Journal of Alloys and Compounds 2005; 392: 149-158
[12] E. Schreiber, O. L. Anderson and N. Soga, Elastic constant and their measurements, McGraw-Hill, New York. 1973, 82
[13] S. Timoshenko and J. N. Goddier, "Theory of elasticity, 2nd Ed",
McGraw- Hill, New York. 1951, 277 [14] K. Nuttall, J. Inst. Met. 1971; 99: 266
[15] Tables for X-Ray Crystallography. 1952; 1: 15-21
[16] B. D. Cullity "Element of x-ray diffraction" Ch.10 (1959) 297 [17] G Kumar, KN Prabhu, Adv Colloid Interface Sci. 2007; 133: