Abstract— one of the most common forms of failures observed in brittle thin films subjected to stress is cracking. The crack growth rate depends on intrinsic film properties, stress and some environmental factors. we investigate central crack on different material planes. The planes are made from silicon, copper, aluminum, polyamide and silicon nitride. Each plane is 1.0m x 0.4m and has a crack length of 0.04m. Because of symmetry only 0.5m and o.2m of the plate is used. They are subjected to a normal stress of 100MPa. A two dimensional (2D) Finite Element Analysis (FEA) model is developed and ANSYS software is used to calculate the MODE I Stress Intensity Factor (SIF) on each material plane. Silicon had a SIF of 21.562, aluminum 23.838, copper 23.383, polyamide 24.948 and silicon nitride 22.371. From the results, silicon had the lowest MODE I SIF while polyamide had the highest.
Index Term— ANSYS, Flipchip, Interconnect, Stress Intensity Factor (SIF)
I. INTRODUCTION
Multi silicon dies stack is required for higher performance, greater package miniaturization and more functionality electronic device. Silicon passivation cracking and interconnect metal thin film cracking are organic packaging failure modes which occur due to global thermal expansion mismatch between the package and the silicon and also local thermal expansion mismatch among interconnect metals and passivation materials .Experimental data have shown that some properties have to be considered before designing an IC to minimize the risks encountered due to thermal mismatch. Some of these properties include: the size of the chip, the (Interlayer Dielectric) ILD material and also the number of die layers. We used ANSYS 14.0 to analyze MODE I SIF on the different materials used.
II. LINEAR ELASTIC STRESS ANALYSIS OF 2D CRACKS Homogeneous and isotropic materials with cracks have stress surrounding the crack tip analyzed assuming linear elastic material behavior. Linear Elastic Fracture Mechanics (LEFM) method assumes the plastic region near crack tip is much smaller than the dimensions of the crack and the structural member. This is a very important concept, scientists and engineers call it small-scale yielding [1], since it simplifies stress analysis near the tip. Assuming the geometry has very small displacement and the material is elastic, homogeneous and isotropic. The governing equations for linear elastic analysis in 2-D are:
The strain-displacement relationships:
(1) (2) * + (3)
The stress-strain relationships:
For plane strain, where
( )( )[( ) ]
(4)
( )( )[( ) ] (5)
(6)
( ) (7)
For plane stress, where
[ ] (8) [ ] (9) (10) ( ) (11)
Assessing Central Cracks and Interconnect
Reliability in Flipchips
The equilibrium equations: (12) (13)
The compatibility equation:
* + ( ) (14)
The Airy stress function, Φ, can satisfy all the governing equations and is used to derive the stress field near the crack tip.
√ ⁄ ( ) (15)
(16)
Solving Eq. (16) yields the stress fields for Mode I as:
√ * + (17) √ * + (18) √ (19) ( ) (20) (21)
The displacement fields are:
√ * + (22) √ * + (23) (24)
The coordinates (r, θ) for the stress components are shown in Fig. 1.
Fig. 1 Coordinate systems for the stress components [1].
III. CALCULATION OF STRESS INTENSITY FACTORS (SIF) USINGTHEFINITE ELEMENT METHOD
Several publications have discussed the stress intensity factor and methods involved in its calculation. Enough literature exists addressing the analysis procedure for structures made of composites [2]. In unidirectional fiber composites, the behavior of cracks aligned along the fiber is well characterized by the SIF [3]. Different experimental techniques have been used in the past to determine the SIF for cracks in composites by various researchers. Singular stress field in the neighborhood of the periphery of an annular crack was studied by Gdoutos et al. [4]. The case of fiber debonding originating from the annular crack was also considered. In the study, they calculated KI and KII stress intensity factors and energy release rates. The energy release rate was derived by Liu and Kagawa [5] for an interfacial debonding of a crack in a ceramic-matrix composite and they used the Lame solution for an axisymmetric cylindrical fiber/matrix model. A numerical solution was carried out for the problem of interface crack by Aslantas and Tasgetiren [6]. Variations in the stress intensity factors KI and KII, with load position were obtained for various cases such as different combinations of material of coating layer and substrate, changes in the coefficient of friction on the surface. Xia et al. [7] analyzed fatigue crack initiation in SiC fiber (SCS-6) reinforced titanium on the basis of a finite element model. Their results showed that the formation of matrix crack largely depends on the applied stress and reaction layer thickness. A new method that obtains the complex stress intensity factor was presented by Bjerken and Persson, [8] for an interface crack in a bimaterial using a minimum number of computations. Dirikolu and Aktas [9] carried out a comparative study regarding the determination of stress intensity factors for nonstandard thin composite plates. Carbon-epoxy composite plates were also considered for the study.
elements methods. In this paper, we used the finite elements method to calculate the KI of five different materials used in flipchip packaging.
TABLE1 MATERIALSPROPERTIES
Material Young Modulus
(GPa)
Poisson’s Ratio
Silicon 150 0.17
Aluminum 70 0.33
Copper 110 0.33
Silicon nitride 166 0.23
Polyamide 2.1 0.4
IV. RESULTS AND DISCUSSION
Based on the above materials properties, we give the simulation results and discussions obtained from ANSYS GUI.
Silicon elements distribution along the cracks on silicon plate
Fig. 2 Silicon elements
Elements, nodes, keypoints and areas used in cracked silicon plate simulation
Fig. 3 Silicon output window
MODE I, II and III SIFs values along the crack on silicon plate
Fig. 4 Stress intensity factor in silicon
Aluminum elements distribution along the cracks on aluminum plate
Fig. 5 Aluminum elements
Elements, nodes, keypoints and areas used in cracked aluminum plate simulation
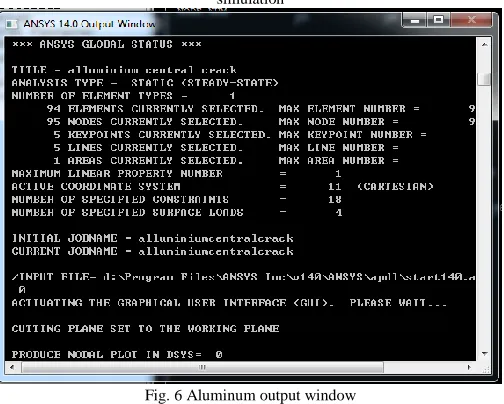
Fig. 6 Aluminum output window
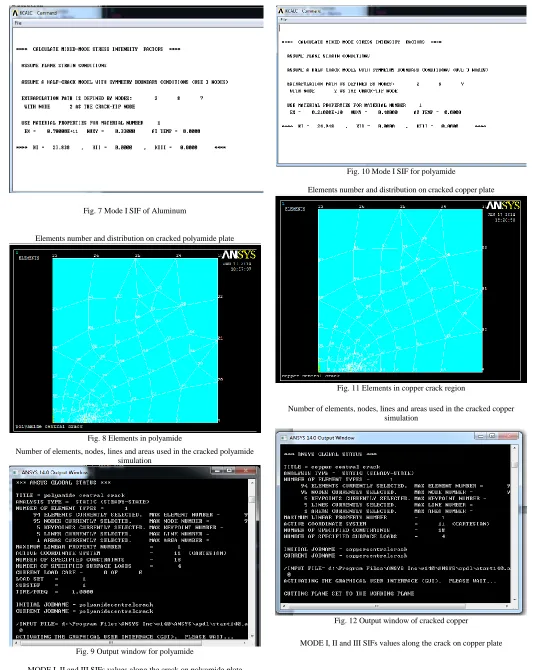
Fig. 7 Mode I SIF of Aluminum
Elements number and distribution on cracked polyamide plate
Fig. 8 Elements in polyamide
Number of elements, nodes, lines and areas used in the cracked polyamide simulation
Fig. 9 Output window for polyamide
MODE I, II and III SIFs values along the crack on polyamide plate
Fig. 10 Mode I SIF for polyamide
Elements number and distribution on cracked copper plate
Fig. 11 Elements in copper crack region
Number of elements, nodes, lines and areas used in the cracked copper simulation
Fig. 12 Output window of cracked copper
Fig. 13 Mode I SIF of copper
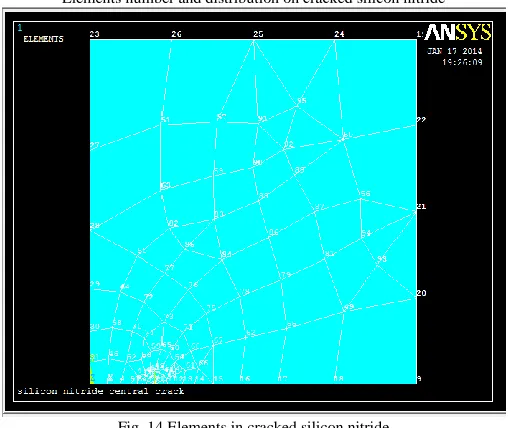
Elements number and distribution on cracked silicon nitride
Fig. 14 Elements in cracked silicon nitride
Number of elements, nodes, lines and areas used in the simulation
Fig. 15 Output window of cracked silicon nitride
MODE I, II and III SIFs values along the crack on silicon nitride plate
Fig. 16 Mode I SIF of cracked silicon nitride
The results and discussions of each material type we used in the simulation of the central holes in silicon, copper, aluminum, polyamide and silicon nitride are discussed in details.
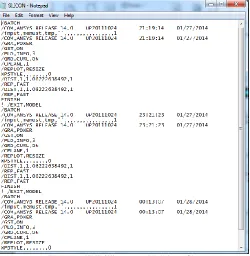
The output windows were of real relevance to us since they showed the specifications we put in the system for the analysis to take place. In this paper, we used 94 elements, 95 nodes, 5 keypoints, 5 lines and 1 area. We only used a single area which was rectangular and because of symmetry, we used only half of the area for simulation. The numbers of nodes used as shown by the output windows for each material are the same. This is because we used the same plate size with the same crack position and length.
We used KCALC command to get the mode I SIFs of each material used. Only one specific value of SIF for each material is given. Since our focus for this paper was mode I SIF, the mode II and III SIFs for each material used is noted to be zero. This is clearly shown by the KCALC diagrams for each material used. Silicon material had the lowest MODE I SIF of 21.562 while polyamide which is a dielectric material had the highest MODE I SIF of 24.948. We noted that copper and aluminum had the same values of MODE I SIF of 23.838 each. Silicon nitride had a MODE I SIF of 22.371. In general, the MODE I SIFs of the materials we used ranged from 21 to 25.
We performed the elastic stress analysis using the KCALC command. We observed that different materials used had different MODE I SIFs. Silicon material had the lowest MODE I SIF of 21.562 while polyamide which is a dielectric material had the highest MODE I SIF of 24.948. We noted that copper and aluminum had the same values of MODE I SIF of 23.838 each. In general, the MODE I SIFs of the materials used ranged from 21 to 25. The table below summarizes the MODE I SIFs of the five materials we used in this project.
TABLE II
Summary of results for all the materials used in theproject Material Young’s
Modulus (GPa)
Poisson’s ratio MODE I SIF
Silicon 150 0.17 21.562
Aluminum 70 0.33 23.838
Copper 110 0.33 23.838
Polyamide 2.1 0.4 24.948
Silicon nitride 166 0.23 22.371
The recommendations we made on this project include: Copper and aluminum can be used interchangeably
where mechanical strength is concerned since they have the same MODE I SIF.
Silicon is the best material as per this project to be used as a chip in flipchip ball grid arrays since it has the lowest SIF.
When dielectric materials are selected for use, Silicon nitride should be considered more than polyamide since it has a lower MODE I SIF.
MODE I SIF can be used to categorize materials according to their mechanical strength. Those with lower SIFs can be considered stronger than those with higher SIFs.
With more material properties integrated, more precise results will be achieved and other parameters apart from stress and deformations. These approaches will help curb cracking problem in chips therefore making electronic devices more reliable in the market. The electronic devices can also be used for a longer period of time and the problem of repair will be solved.
APPENDIX List of symbols
E = Modulus of Elasticity (GPa) v = Poisson’s Ratio (-)
ε = Strain (-)
u = Displacement (mm) σ = Normal Stress (GPa) τ = Shear Stress (GPa) G = Shear Modulus (GPa) Φ = Airy Stress Function (kN)
K = Stress Intensity Factor (GPa √ ) a = crack length (mm)
P = geometrical parameter depends on structural member and crack
@ = at
Step by step inputs in cracked polyamide plate simulation
Fig. 17. ANSYS central crack Input File for polyamide
Step by step inputs in cracked silicon nitride plate simulation
Step by step inputs in cracked silicon plate simulation
Fig. 19. ANSYS Silicon central hole input file
Step by step inputs in cracked aluminum plate simulation
Fig. 20. ANSYS Aluminum central hole input file
Step by step inputs in cracked copper plate simulation
Fig. 21. ANSYS Copper central hole input file
ACKNOWLEDGMENT
These lines I want to dedicate for giving my thanks to all people without who this paper would have not been possible. I want to thank my advisor, doctor Zhang Xuliang, first for believing in me and for giving me the opportunity to work with him on this paper, and then for being a great help during my work, with his constant patience, useful advices and suggestions. I am especially grateful to him for his great personality regarding giving me professionally honest and timely feedback to the very last day of my work. I will always remember him .My regards also go to other lecturers in our lab since they were of great help too by giving their contributions towards the work. My thanks also go to my friends especially those in the same lab who, during the rough moments like software installation, cheered me up and gave me the strength to go on.
REFERENCES
[1] Barsom, John M. and Rolfe, Stanley T., Fracture and Fatigue Control in Structures: Application of Fracture Mechanics, Philadelphia, 1999.
[2] Agarwal, B. D. and Broutman, L. J. 1990. Analysis and Performance of Fiber Composites. John Wiley and Sons. New Jersey.
[3] Anderson, T. L. 1995. Fracture Mechanics-Fundamentals and Applications. CRC Press. Boca Ralton.
[4] Gdoutos, E.E., Giannakopoulou, A., Zacharopoulos, D.A., 1999. Stress and failure analysis of brittle matrix composites. Part II: Failure analysis. International Journal of Fracture 98. 279-291. [5] Liu, Y.F., Kagawa, Y., 2000. The energy release rate for an
interfacial debond crack in a fiber pull-out model. Composites Science and Technology 60 (2). 167–171.
[6] Aslantas_, K., Tas_getiren, S., 2002. Debonding between coating and substrate due to rolling sliding contact. Materials and Design 43. 871–876.
titanium alloys. Composites Part A: Applied Science and Manufacturing 31 (10). 1031–1037.
[8] Bjerken, C., Persson, C., 2001. A numerical method for calculating stress intensity factors for interface cracks in bimaterials. Engineering Fracture Mechanics 68 (2). 235–246.
[9] Dirikolu, M.H., Aktas_, A., 2000. Analytical and finite element comparisons of stress intensity factors of composite materials. Composite Structures 50 (1). 99-102.
[10] D.E Rooke and D.J. Cartwright, 1979. Compendium of Stress Intensity Factors", Her Majesty's Stationery Office, London. [11] E.E. Gdoutos, 2005. Fracture Mechanics: An Introduction.
Springer.
[12] Gdoutos, E.E., 1990. Fracture Mechanics Criteria and Applications. Kluwer Academic Publishers.
[13] Murakami, Y. (ed.), 1987. Stress Intensity Factors Handbook. Pergamon Press.
[14] Majid Mirzaei, Fracture Mechanics: Theory and Applications.
Dept. of Mechanical Eng.. TMU.
http://www.modares.ac.ir/eng/mmirzaei.