Data Mining the Data Processing Technologies
for Inventory Management
Chien-Wen Shena
aDepartment of Business Administration, National Central University, Jhongli City, Taoyuan County 32001, Taiwan
Email: [email protected]
Heng-Chi Leeb, Ching-Chih Chouc, and Chiao-Chun Chengb
bDepartment of Logistics Management, National Kaohsiung First University of Science and Technology, Kaohsiung
City 811, Taiwan; cInstitute of Management, National Kaohsiung First University of Science and Technology, Kaohsiung City 811, Taiwan
Email: {hlee, u9628902, u9723808}@nkfust.edu.tw
Abstract—This research applied various data mining approaches to investigate the innovations of data processing technologies for inventory management based on the database of the United States Patent and Trademark Office. The first objective of data mining in this study is to find the core technologies by evaluating patent citation matrix and patent strength. This information can help companies to choose suitable tools through the understanding of the most essential innovations. A total of 63 core technologies were identified from 949 patents under the US patent class of 705/28. Besides, a network of patent development paths was also derived to illustrate the correlations of core advancements. Finally, this study adopted the method of nonhierarchical clustering analysis to identify key groups of technologies through the symmetrical matrix of relative correlation strength. Enterprise can refer the findings of clustering to recognize the trend and characteristics of data processing technologies for their strategic technology management.
Index Terms—data mining, patent analysis, inventory management, data processing
I. INTRODUCTION
Data processing of inventory management involves with electrical apparatus and its corresponding method that performs operations with significant data change or calculations in the processing of inventory records [1]. Due to the complexity and importance of inventory control in the age of globalization, new innovations have been proposed to enhance the computerized procedures for establishing, maintaining, or updating inventory records. For example, an inventory management system can automatically determine which items in the Just-in-Time inventory may need replenishment most likely [2]. Another computer system uses a linear programming engine to choose the priority of customer orders and arrange limited inventory accordingly [3]. Empirical studies have also shown that applications of advanced inventory-related systems not only help the maintenance of service level but also save enormous amount of inventory costs, which can be allocated for other business
improvement projects [4][5]. Hence, how to apply advanced technologies for better inventory control and management is crucial for enterprise to develop a competitive advantage that is difficult to match [6].
mining are presented and discussed. Finally, we conclude this study and future researches in Section V.
II. TECHNOLOGIES AND INVENTORY MANAGEMENT
Due to the innovative advances of information and communication technology (ICT) since the 1990’s, companies have invested ICT solutions for the improvement of inventory operations. Studies have illustrated the close relationships between ICT implementation and supply chain performance. For example, an empirical finding showed that Toyota Production System can reduce inventory in the manufacturing sector [4]. Cheng and Chou [5] proposed a real-time inventory decision support system that not only decreases the inventory costs but also helps to maintain the service level greater than 90% for various demand patterns. Generally speaking, ICT can allow supply chain partners to share demand and inventory data quickly and economically [8].
From the perspective of inventory-related technologies, Yang, Ng and Cheng [9] described the application of vender–managed inventory (VMI) system, where suppliers take full responsibilities for maintaining inventory levels through the information shared by buyers. Performances of supply chain such as inventory holding cost, stock–out ratio, service level, and demand distortion are supposed to be benefited from the adoption of VMI systems. Meanwhile, technology of electronic data interchange (EDI) is the structured transmission of standardized electronic documents between entities. Study of Cachon and Fisher [8] suggested that information sharing through EDI can reduce supply chain costs, the gap between traditional information policy cost, lead time, and batch size. In the study of Lindau and Lumsden [10], automatic data capture systems are applied to control shipments and keep track of work–in– process. In addition, bar–code is another technology used to meliorate the accuracy of information and speed the transmission of data. In the case study of Manthou and Vlachopoulou [11], bar–code technology was deployed to automate daily transactions for the reduction of cost and human error during data entry operations. Their study also indicated that bar–code application can offer accurate inventory control and replenishment for uncertainty reduction at the store level. Meanwhile, the optimization of inventory and supply chain operations can be achieved by the approaches of two–way radio frequency (RF) transmission, where operational records are collected automatically in real-time. Furthermore, through the integrations of RF systems, automatic identification systems (AIS), bar–code systems, automatic data capture (ADC), enhancing EDI and quick response (QR) systems, the manufacturing and distribution firms are able to better control inventory operations with enhanced data processing technologies [12]. Study of Fleisch and Tellkamp [13] also indicated that automatic identification technologies such as radio frequency identification (RFID) not only can be used to solve the problem of inventory inaccuracy caused by theft but also reduce the level of out–of–stock and supply
chain cost. To deal the compatibility requirement of data standard from globalization, enterprises are trying to enhance competence by seeking effective ways to integrate resources with the demand for information exchange. For example, the 96–bits RFID electronic product code (EPC) system was successfully implemented by several pilot projects to exchange data supported by GS1 association, which provides widely-used standards for supply chain activities. Hence, the RFID–enabled pull–based supply chain can effectively decrease total inventory cost and increase inventory turnover rate through the support of object visibility from RFID [14]. In the study of Martínez-Sala et al. [15], active RFID was applied on the tracking of returnable packaging and transport units in the grocery supply chain. Their findings show that active type of RFID tags not only prevents tag redundancy like general RFID tags but also has the capability of reusability and long-range reading. Although previous studies described the main technologies for inventory management, related investigations on core innovations as well as technical trend and characteristics were addressed little. Therefore, further examination on this class of technologies has its importance.
III.METHODOLOGY AND DATA COLLECTION
A. Data Mining
To understand the context of data processing technology development regarding inventory management, the approaches of patent citation matrix, patent strength, and network of patent development paths were utilized first in this study to identify the core technologies and their correlations. Then nonhierarchical cluster analysis was analyzed by a symmetrical matrix of relative correlation strength to understand the trend and characteristics of technological advances. Details of the above approaches are describes as follows.
Patent information of data processing technologies was retrieved as the data source of data mining. In this study, patent citation matrix was examined to represent the relationships between patents. Suppose that the indexes of cited patent and citing patent are l and l′ respectively. We denote Cll′ the citation relationship between patent Zl and Zl′. If Cll′ = 0, it implies that patents Zl and Zl′ are
isolated. If Cll′ = 1, it says that patents Zl and Zl′ have a
direct citation relationship. Meanwhile, patents Zl and Zl′
have an indirect citation relationship if Cll′≠ 1, Clk = 1, and Ckl′ = 1, where patent Zl′ did not directly cite patent Zl, but patent Zk cited patent Zl and patent Zl′ cited patent Zk directly. Hence, a patent citation matrix can be constructed from the above configurations.
1
( ) ni ( )i
V W = +n β
∑
=V Z , if n> 0, (1)V(W) = 0, if n = 0,
where n is the number of patents (Z1, …, Zn) that directly cite patent W. If a patent Zi is an end node in a patent citation network, it implies that no patent cites Zi and therefore n = 0 and V(Zi) = 0. If β = 0, function V only calculates the direct citation effect. If β = 1, the indirect effect is equal to the direct effect. We included those patents that are ranked among the top 20 influential technologies from the measurements of citation strength when β = 0, β = 0.3, and β = 0.5. In addition to the application of citation strength, this study also employed the method of three standard deviations (three S.D.) to select those latest patents that have strong direct citations but relatively weak indirect citations. The core technologies are then determined by the union of patents extracted from the approaches of citation strength and three S.D.
The next step is to calculate the relationships of core patents. Suppose that W and Y are two core technologies derived from the above methods. The lineal linkage coefficient of W and Y can be estimated by
( )
1
( , ) m link j j
R W Y =
∑
=α , if m> 0, (2)( , ) 0
R W Y = , if m = 0,
where m is the number of paths from Y to W, link(j) denotes the number of intermediate patents in the jth path from Y to W (j = 1….m), and α (0 ≤α ≦ 1) represents the decline effect of intermediate patents [17]. If patent Y cites patent W directly and there is no other paths from Y to W, then R(W,Y) = 1. If there is no path from Y to W, then R(W,Y) = 0. While α is increasing, the effect of the intermediate patents becomes smaller and the indirect relationship between W and Y becomes larger. Here in this study, αwas set to 0.5 to imply that the lineal linkage of two patents is 0.5 if there is an intermediate patent in the path of these two patents. If a patent is not related to the other patents from the evaluation of (2), this patent was excluded for further analysis. For those patents that have lineal relationships with the other patents, a network of patent development paths and cluster analysis were conducted upon them.
To classify the categories of data processing technologies for inventory management, the approach of nonhierarchical cluster analysis was applied in this study. Because the input data should be a symmetrical correlation matrix and the domain values of the matrix should be between -1 to +1 or 0 to 1 for our cluster analysis, we transferred the relationship measurement of (2) to another measurement called relative correlation strength [16]. Suppose that Max(R(W,·)) is the maximum value of R(W,X) for all patents X in our data set. The relative correlation strength between patent W and patent Y can be formulated as
( , ) ( , )/ ( ( , ))
R W Y′ = R W Y Max R W ⋅ , if W≠Y, (3)
( , ) 1
R W Y′ = , if W = Y.
The purpose of the division in (3) is to constrain the domain value between 0 and 1, and the square root in (3) is to exclude the occurrence of small values.
Once obtained the symmetrical matrix of relative correlation strength by (3), nonhierarchical cluster analysis was applied to classify the core patents of data processing technologies in inventory management. Suppose that there are K clusters given the data of core technologies. The first step of the clustering algorithm used in this study is to place K initial group centroids into the space represented by the objects that are being clustered. Then the second step is to associate each core patent to the cluster that has the closest centroid. When all core patents have been assigned, step 3 is to re-calculate the K new centroids. We have to repeat Steps 2 and 3 until the locations of K centroids no longer change. According to the results of nonhierarchical cluster analysis, we further analyzed the characteristics of each technological cluster and evaluated the trend of data processing advances since 1990.
B. Data Collection
The patent data were collected from the United States Patent and Trademark Office (USPTO) database, which is the largest patent database in the world. Our analysis is based on the patents from the Subclass 28 (Inventory management) of the Class 705 (Data Processing: Financial, Business Practice, Management, or Cost/Price Determination). Accordingly, a total of 1,116 related patents can be found from the 705/28 class since 1947 to 2009. Because this study focused on the investigation of recent technological advances during the past two decades, we collected 949 patent records that issued after January 1, 1990 until December 31, 2009 for further data mining analysis.
IV.FINDINGS OF DATA MINING
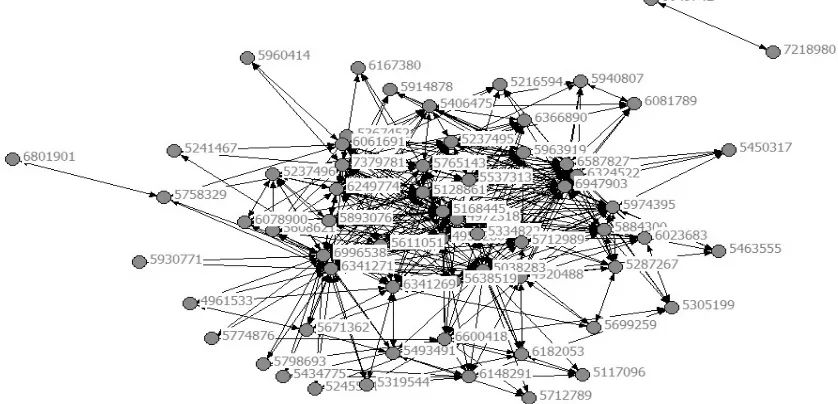
The next analysis of this study is to estimate the relationships of core technologies from (2). There are eight patents that were found not related to the other patents. These isolated core technologies are Patent No. 6006196 (Method of estimating future replenishment requirements and inventory levels in physical distribution networks), No. 6032125 (Demand forecasting method, demand forecasting system, and recording medium), No. 6260024 (Method and apparatus for facilitating buyer-driven purchase orders on a commercial network system), No. 6463420 (Online tracking of delivery status information over a computer network), No. 7292904 (Method for sizing production lot starts within a linear system programming environment), No. 7308330 (Dynamic order swapping in BTO environment), No. 7340420 (Method and system for providing information on industrial wastes, server and terminal for providing the information, recording medium for recording computer-readable program, and program allowing computer to execute process), and No. 7385529 (Dynamic and predictive information system and method for shipping assets and transport). Accordingly, these eight patents were deleted and the relationship matrix became to 63 by 63. The distribution of 63 core technologies by issued year is illustrated in Fig. 1, where 42% of core technologies were issued between 1997 and 2000. In addition, the network of patent development paths for these 63 core technologies is shown as Fig. 2, where node denotes patent and arrow represents the development direction of forward citation. The importance of individual patent can be recognized by its number of direct paths and indirect paths from the other patents. For example, Patent No. 7218980 (Prediction based optimization of a semiconductor supply chain using an adaptive real time work-in-progress tracking system) only has one direct path from patent 6049742 (Projected supply planning matching assets with demand in microelectronics manufacturing). Besides, it has no
indirect paths from the other patents. This core technology is relatively less important than the others because it’s a new patent which is issued in 2007. The network shown in Fig. 2 not only displays the importance of individual core patent, but also traces the development routes of core technologies.
Figure 1. The distribution of core technologies by issued year.
To further identify the categories of data processing technologies for inventory management, we need to transfer the input data from the matrix of R(W,Y) to the symmetrical matrix of relative correlation strength R′(W,Z) for the following cluster analysis. The diagonal of R′(W,Z) is set to 1 because the relationship of oneself is equal to 1. After we conducted the nonhierarchical clustering analysis, the 63 basic patents were classified into two groups as shown in Table I. According to the characteristics of major patent technologies in the group, Group 1 (G1) is named inventory management systems, which has 40 technologies. Meanwhile, Group 2 (G2) is named inventory monitoring methods and systems, which has 23 patents only. Among the 40 advancements in Group 1, the first issued technology was on April 4, 1990 and the last issued patent was on May 27, 2008. Generally speaking, the distribution period of issued
technologies in Group 1 is longer than those in Group 2. It implies that the development of technologies of inventory management systems is normally longer than the technologies of inventory monitoring methods and systems.
TABLE I.
SUMMARYOFNONHIERARCHICALCLUSTERINGANALYSIS
Group Volume First issued date Last issued date technologies Major
G1 40 1990.04.24 2008.05.27 Inventory management systems
G2 23 1990.10.09 2007.05.15 Inventory monitoring methods and systems
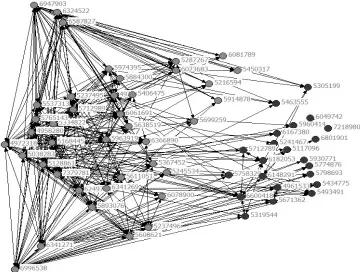
The citation relationship for the clustered patents is expressed in Fig. 3. Gray nodes denote patents in Group 1 while black nodes denote patents in Group 2. The citation relationship shows that most patents in Group 2 cite patents from Group 1. It means that the technologies of inventory management systems are relatively mature advances than the technologies of inventory monitoring methods and systems. For example, Patent No. 5319544 (Inventory monitoring and verification system and method) of group 2 cited Patent No. 5237496 (Inventory control method and system) of group 1. Patent No. 5463555 (System and method for integrating a business environment with a process control environment) of group 2 cited Patent No. 5287627 (Consumable supplies monitoring/ordering system for reprographic equipment) of group 1. Accordingly, our findings show that most technologies of inventory monitoring methods and systems depend on the technologies of inventory management systems.
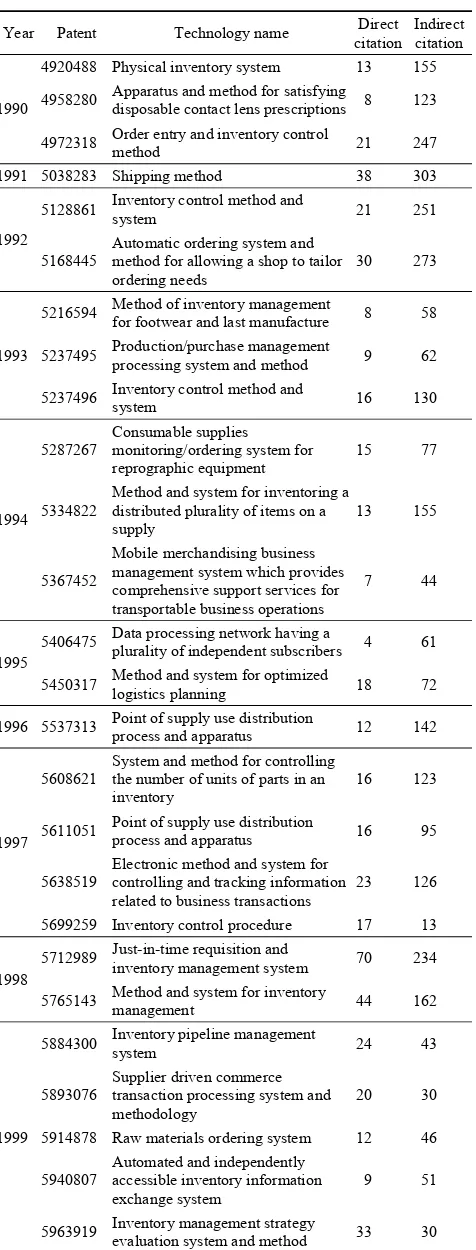
The characteristics of inventory management systems are shown in Table II, which includes the detailed information of issued date, patent number, technology name, number of direct citation, and number of indirect citation. Table II indicates that most of the patents in Group 1 were issued during 1990 to 2002. The year that has the peak issued volume is 1999, in which six related technologies of inventory management systems announced. The technology of just-in-time requisition and inventory management system (No. 5712989) issued in 1998 has most direct citations in Group 1. A total of 70 patents (include the non-core technologies) has cited Patent No. 5712989 directly for their innovation developments. Through these 70 patents, the just-in-time requisition and inventory management system was also cited indirectly by 234 patents. The patent that has the second most direct citations is No. 5765143 (Method and system for inventory management), but its number of direct citations shows a big gap to No. 5712989. Besides, the technology of shipping method (No. 5038283) issued in 1991 has most indirect citations (303 patents). Other technologies such as order entry and inventory control method (No. 4972318), inventory control method and system (No. 5128861), and automatic ordering system and method for allowing a shop to tailor ordering needs (No. 5168445) also have indirect citations over 200 times. However, latest technologies such as No. 6947903 (Method and system for monitoring a supply-chain), No. 6996538 (Inventory control system and methods), and No. 7379781 (Constraint based order optimization system and available to promise system) generally have no indirect citations from the other technologies. This summary table of Group 1 technologies can help companies to
understand the trend of innovations and the key patents for the future development of inventory management systems.
TABLE II.
CHARACTERISTICSOFINVENTORYMANAGEMENTSYSTEMS
Year Patent Technology name citationDirect Indirect citation
1990
4920488 Physical inventory system 13 155
4958280 Apparatus and method for satisfying disposable contact lens prescriptions 8 123
4972318 Order entry and inventory control method 21 247
1991 5038283 Shipping method 38 303
1992
5128861 Inventory control method and system 21 251
5168445
Automatic ordering system and method for allowing a shop to tailor
ordering needs 30 273
1993
5216594 Method of inventory management for footwear and last manufacture 8 58
5237495 Production/purchase management processing system and method 9 62
5237496 Inventory control method and system 16 130
1994
5287267
Consumable supplies monitoring/ordering system for reprographic equipment
15 77
5334822
Method and system for inventoring a distributed plurality of items on a supply
13 155
5367452
Mobile merchandising business management system which provides comprehensive support services for transportable business operations
7 44
1995
5406475 Data processing network having a plurality of independent subscribers 4 61
5450317 Method and system for optimized logistics planning 18 72
1996 5537313 Point of supply use distribution process and apparatus 12 142
1997
5608621
System and method for controlling the number of units of parts in an inventory
16 123
5611051 Point of supply use distribution process and apparatus 16 95
5638519 Electronic method and system for controlling and tracking information related to business transactions
23 126
5699259 Inventory control procedure 17 13
1998
5712989 Just-in-time requisition and inventory management system 70 234
5765143 Method and system for inventory management 44 162
1999
5884300 Inventory pipeline management system 24 43
5893076
Supplier driven commerce transaction processing system and methodology
20 30
5914878 Raw materials ordering system 12 46
5940807
Automated and independently accessible inventory information exchange system
9 51
5963919 Inventory management strategy evaluation system and method 33 30
5974395
System and method for extended enterprise planning across a supply chain
26 13
2000 6023683 Electronic sourcing system and method 20 33
6061691 Method and system for inventory management 13 5
6078900
Method for estimating stock levels in production-distribution networks with inventory control
21 42
6081789
Automated and independently accessible inventory information exchange system
19 36
2001
6249774
Method for owning, managing, automatically replenishing, and invoicing inventory items
16 12
6324522 Electronic information network for inventory control and transfer 26 31
2002
6341269
System, method and article of manufacture to optimize inventory and merchandising shelf space utilization
14 21
6341271 Inventory management system and method 29 23
6366890
Product inventory category management and variety optimization method and system
15 3
2003 6587827 Order fulfillment processing system 11 4
2005 6947903 Method and system for monitoring a supply-chain 6 0
2006 6996538 Inventory control system and methods 4 0
2008 7379781
Constraint based order optimization system and available to promise
system 3 0
understand whether this brand of technologies may not need to refer other patents for their developments.
TABLE III.
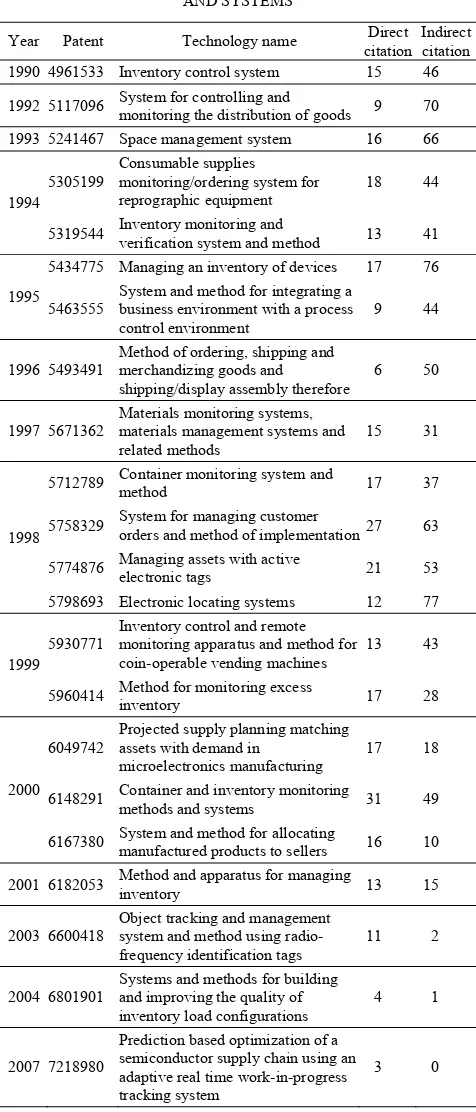
CHARACTERISTICSOFINVENTORYMONITORINGMETHODS ANDSYSTEMS
Year Patent Technology name citationDirect Indirectcitation
1990 4961533 Inventory control system 15 46
1992 5117096 System for controlling and monitoring the distribution of goods 9 70
1993 5241467 Space management system 16 66
1994
5305199 Consumable supplies monitoring/ordering system for reprographic equipment
18 44
5319544 Inventory monitoring and verification system and method 13 41
1995
5434775 Managing an inventory of devices 17 76
5463555
System and method for integrating a business environment with a process control environment
9 44
1996 5493491
Method of ordering, shipping and merchandizing goods and shipping/display assembly therefore
6 50
1997 5671362
Materials monitoring systems, materials management systems and
related methods 15 31
1998
5712789 Container monitoring system and method 17 37
5758329 System for managing customer orders and method of implementation 27 63
5774876 Managing assets with active electronic tags 21 53
5798693 Electronic locating systems 12 77
1999 5930771
Inventory control and remote monitoring apparatus and method for coin-operable vending machines
13 43
5960414 Method for monitoring excess inventory 17 28
2000 6049742
Projected supply planning matching assets with demand in
microelectronics manufacturing
17 18
6148291 Container and inventory monitoring methods and systems 31 49
6167380 System and method for allocating manufactured products to sellers 16 10
2001 6182053 Method and apparatus for managing inventory 13 15
2003 6600418 Object tracking and management system and method using radio-frequency identification tags
11 2
2004 6801901
Systems and methods for building and improving the quality of inventory load configurations
4 1
2007 7218980
Prediction based optimization of a semiconductor supply chain using an adaptive real time work-in-progress tracking system
3 0
To compare the citation trend of these two core groups, we summarize their citation volumes (include the non-core technologies) from 1990 to 2009 in Table IV. The volume of Group 1 technologies generally shows an increasing pattern since 1992. Particularly, the citation volumes of these two groups increase significantly since
2005. Our findings indicate that both groups of technologies are still emerging. In addition, latest data processing technologies for inventory management are dependent on the foundations of core technologies.
TABLE IV.
TRENDANALYSISOFTECHNOLOGICALGROUPS
Year 1990 1991 1992 1993 1994 1995 1996 1997 1998 1999 G1 0 0 3 5 10 3 9 15 18 54 G2 0 0 0 0 0 4 0 3 4 26 Year 2000 2001 2002 2003 2004 2005 2006 2007 2008 2009 Total
G1 40 30 45 51 14 72 104 120 84 98 775 G2 29 18 26 28 9 27 43 45 37 30 329
V.CONCLUSIONS
Because inventory management is critical for supply chain participants, understanding and monitoring the development trend and context of data processing technologies for inventory management would benefit participants to enhance their competitive advantage. This study applied various data mining techniques to investigate the data processing innovations for inventory management through the investigation of USPTO database. We applied the approaches of citation strength and three S.D. to extract 63 core patents from 949 patents. The correlation strength between core patents was estimated through the lineal linkage coefficients and expressed by their correlation strength diagrams. Finally, the approach of nonhierarchical cluster analysis was used to reveal the trend and characteristics of core data processing technologies. Our results show that the data processing technologies for inventory management can be classified into the category of inventory management systems and the category of inventory monitoring methods and systems. The technologies inside the group of inventory management systems are generally mature innovations and thus they may be considered as the indicator techniques. Meanwhile, the patents inside the cluster of inventory monitoring methods and systems are relatively new and thus still have more rooms for development in the future.
Some possible future researches related to this work are described as follows. First, our analysis only focuses on the data mining of USPTO 705/28 class. However, there are other subclasses related to the technologies of inventory management under Class 705. Extended investigations on these subclasses can help companies to evaluate technological development from different angles. Second, the patents of data processing techniques for inventory management are issued continuously. More recent records can be collected for further analysis to see whether new core technologies can be identified.
REFERENCES
[1] United States Patent and Trademark Office (USPTO),
Concordance, U.S. Patent Classification (USPC) to International Patent Classification (IPC) Eighth Edition,
http://www.uspto.gov/web/patents/classification/uspc705/d efs705.htm#C705S028000
[2] J.M. Johnson and D.A. Momyer, U.S. Patent No. 5,712,989. Washington, DC: U.S. Patent and Trademark Office, 1998.
[3] R.B. Treichler, P.Y.W. Yuk, and R.B. Bresticker, U.S. Patent No. 7,379,781. Washington, DC: U.S. Patent and Trademark Office, 2008.
[4] P.M. Swamidass, “The effect of TPS on US manufacturing during 1981–1998: inventory increased or decreased as a function of plant performance,” Int. J. Prod. Res., vol. 45(16), pp. 3763–3778, 2007.
[5] J.–C. Cheng and C.–Y. Chou, “A real–time inventory decision system using Western Electric run rules and ARMA control chart,” Expert Syst. Appl., vol. 35(3), pp. 755–761, 2008, doi:10.1016/j.eswa.2007.07.019.
[6] R. Frankel, “The role and relevance of refocused inventory: Supply chain management solutions,” Bus. Horizons, vol. 49(4), pp. 275–286, 2006.
[7] H. Ernst, “Patent information for strategic technology management,” World Patent Infom., vol. 25(3), pp. 233– 242, 2003, doi:10.1016/S0172-2190(03)00077-2.
[8] G.P. Cachon and M. Fisher, “Supply chain inventory management and the value of shared information,” Manage. Sci., vol. 46(8), pp. 1032–1048, 2000.
[9] L. Yang, C.T. Ng, and T.C.E. Cheng, “Evaluating the effects of distribution centres on the performance of vendor-managed inventory systems,” Eur. J. Oper. Res., vol. 201(1), pp. 112–122, 2010.
[10]R. Lindau and K. Lumsden, “The use of automatic data capture systems in inventory management,” Int. J. Prod. Econ., vol. 59(1–3), pp. 159–167, 1999, doi:10.1016/S0925–5273(98)00098–X.
[11]V. Manthou and M. Vlachopoulou, “Bar–code technology for inventory and marketing management systems: A model for its development and implementation,” Int. J. Prod. Econ., vol. 71(1–3), pp. 157–164, 2001, doi:10.1016/S0925–5273(00)00115–8.
[12]A.C. Yao and J.G. Carlson, “The impact of real–time data communication on inventory management,” Int. J. Prod. Econ., vol. 59(1–3), pp. 213–219, 1999, doi:10.1016/S0925–5273(98)00234–5.
[13]E. Fleisch and C. Tellkamp, “Inventory inaccuracy and supply chain performance: a simulation study of a retail supply chain,” Int. J. Prod. Econ., vol. 95(3), pp. 373–385, 2005, doi:10.1016/j.ijpe.2004.02.003.
[14]S.–J. Wang, S.–F. Liu, and W. L. Wang, “The simulated impact of RFID–enabled supply chain on pull–based inventory replenishment in TFT–LCD industry,” Int. J. Prod. Econ., vol. 112(2), pp. 570–586, 2008, doi:10.1016/j.ijpe.2007.05.002.
[15]A.S. Martínez-Sala, E. Egea-López, F. García-Sánchez, and J. García-Haro, “Tracking of returnable packaging and transport units with active RFID in the grocery supply chain,” Comput. Ind., vol. 60, pp. 161–171, 2009, doi:10.1016/j.compind.2008.12.003.
[16]S.–B. Chang, K.–K. Lai, and S.–M. Chang, “Exploring technology diffusion and classification of business methods: Using the patent citation network,” Technol. Forecast. Sco., vol. 76, pp. 107–117, 2009, doi:10.1016/j.techfore.2008.03.014.
[17]S.–B. Chang, M.–L. Lin, K.–K. Lai, and S.–M. Chang, “Re–examining the taxonomy of patent analysis literature,”