MACROSCOPIC PEDESTRIAN FLOW MODELLING USING
SIMULATION TECHNIQUE
Pritikana Das1, Manoranjan Parida2, Vinod Kumar Katiyar3 1 Transportation Planning Division, CSIR-CRRI, New Delhi, India
2 Civil Engineering Department, IIT Roorkee, India 3 Mathematics Department, IIT Roorkee, India
Received 24 August 2017; accepted 30 March 2018
Abstract: Simulation is useful to engineers when the model parameters will be calibrated and validated with the real system. Microscopic analysis is used in this study to get macroscopic output for developing pedestrian flow models. Pedestrian characteristics on sidewalk facility in India have been considered to observe performance of pedestrians in VISWALK. The calibration of the model parameters was carried out with the adjustment of model parameters such as Tau, lambda, social forces from other objects etc. Constructed model was validated locally and globally. In this study mean absolute error and root mean square error values were observed to measure accuracy of the model output for validation purpose. Real and simulated data were compared considering fundamental flow diagrams and flow parameters. Developed models and estimated values of flow parameters such as free flow speed and capacity were compared with the real data and estimated error was less than 10%. Scatters in the field data is more as comparing to simulated data in Indian context.
Keywords: fundamental diagram, macroscopic, pedestrian flow modelling, simulation, VISWALK .
1 Corresponding author: [email protected]
1. Introduction
Pedestrian traffic flow modelling involves mat hemat ica l relat ionsh ips a mong fundamental parameters of traffic stream. Many models have been developed based on macroscopic and microscopic approaches. In macroscopic study, group movements of pedestrians i.e. stream characteristics are considered for flow characterization. Flow models describe the relationship between speed, flow and density with the fundamental diagram. Flow parameters such as Speed, Flow, Density/ Space are basic inputs for pedestrian flow modelling in macroscopic approach. The secondary flow
parameters are estimated using these models for instance free flow speed and capacity can be computed and used to evaluate the efficiency of the facility.
of simulation models were checked by measuring error in terms of mean absolute error and root mean square error.
2. Past Studies
Simulation techniques have some limitation of the operation of a real-world system over time. It represents the operation of the system over time. Helbing and Molnar (1995), proposed a social force model considering several forces termed as describing the acceleration towards the desired velocity of motion, reflecting the distance between pedestrians and from borders also, modelling attractive effects. They described pedestrian motion by a social force model for individual pedestrian behaviour and they observed the social force model is capable of describing the self-organization of collective effects of pedestrian behaviour realistically. Many researchers observed the pedestrian behaviour using simulation technique for developed countries (Zacharias et al., 2005; Hoogendoorn, 2003; Ishaque and Noland, 2009; Sahaleh et al., 2012). (Zhang et al., 2009), described the progress in simulation studies for pedestrians’ with the mechanism and applicable software. Park and Schneeberger (2003), developed a model using simulation tool which was calibrated and validated through a case study of VISSIM Simulation Model for a Coordinated Actuated Signal
System. (Galiza et al., 2011), used
micro-simulation approach to observe the effect of older pedestrian proportion in pedestrian flow and on the LOS criteria. Equivalent factor was developed for heterogeneous pedestrian flow using micro simulation approach instead of real data by (Galiza and Ferreira, 2013). Legion, VISSIM, VISWALK, SimWalk, PedGo are the simulation software to study pedestrians’ behaviour. VISWALK is more transparent and it provides more modification
comparing with Legion for Aimsun to perform a pedestrian traffic simulation (Alexandersson and Johansson, 2013). (Huynh et al., 2013), modelled traffic flow at signalized intersection for mixed traffic using social force model. They stated that proposed model is more complex comparing the social force model for pedestrians.
(Federici et al., 2014), provided a checklist for the quantitative evaluation of Pedestrians in crowd modelling area in Simulation software which provide accurate results in planning of new facilities or schemes. Pedestrian behaviour model in VISSIM was included in 2006 using the model developed for pedestrians by (Helbing and Molnar, 1995). Final pedestrian simulation was included in VISSIM 5.10 in 2008 and VISWALK started in 2011 as a separate product name in VISSIM.
3. Framework for Analysis
Data Collection
Input Parameters (Directional Flow, Desired Speed, Pedestrian composition) Data Extraction
Calibrated Parameters (Asocio, Bsocio, Tau,
Lambda etc.) Conventional Model Development VISWALK Model Development
Estimated Secondary Flow Parameters (uf, uo, kj, ko, qmax)
Model Comparison & Conclusions
Developed Pedestrian Flow Models using simulated Data Input Parameters
(Flow, Speed, Density and Space)
Developed Pedestrian Flow Models using real field Data
Fig. 1.
Structural Framework for Analysis
4. Data Collection and Extraction
Technique
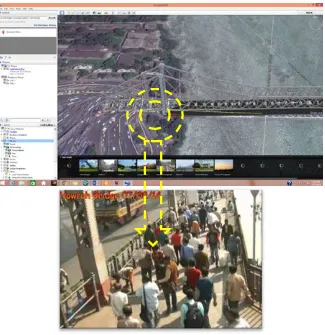
Data were collected at peak hours to analyse the performance of pedestrians on sidewalk at North campus (Delhi) and Howrah Bridge (Kolkata). Data were collected
using videographic technique and required parameters were extracted manually from the recorded videos. Measurement interval for data extraction was 30 second to extract data. Photograph of surveyed locations are shown in Fig. 2 and 3.
Fig. 2.
Fig. 3.
Sidewalk at Howrah Bridge, Kolkata with Google Image
Flow rate values were estimated in terms of pedestrians per minute per meter width (P/min/m) considering effective walkway width. Effective walkway width can be described as the width of a facility that can be effectively used by pedestrians after deducting shy away distance.
5. Pedestrian Flow Modelling Using Real
Data
Pedestrian flow models were developed for real field data to observe pedestrian characteristics
on sidewalk at North Campus (Delhi) and Howrah Bridge (Kolkata). Flow characteristics of pedestrians on sidewalks were established. Greenshield’s model follows the linear speed-density relationships. From the developed model for observed data secondary flow
parameters such as free flow speed (Uf),
optimum speed (Uo), optimum density (ko),
jam density (kj) and capacity (qmax) were
Table 1
Pedestrian Flow Models for Observed Data
Location Models Equations R2
North Campus Flow-Density
Speed-Density Speed-Flow
Flow-Space
0.96
Howrah Bridge Flow-Density
Speed-Density Speed-Flow
Flow-Space
0.92
Table 2
Estimated Flow Parameters for Observed Data
Flow Parameters Estimated values
North Campus Howrah Bridge
Free Flow Speed 75.80 m/min 80.95 m/min
Optimum Speed 37.89 m/min 40.48 m/min
Optimum Density 2.42 P/m2 1.79 P/m2
Jam Density 4.84 P/m2 3.58 P/m2
Capacity 91.64 P/min/m /min/m
6. Pedestrian Flow Modelling Using
VISWALK Simulation Tool
Computer simulation is a useful part of modelling real life system. Here for pedestrians VISWALK simulation tool used to study performance of pedestrians on sidewalks in Indian context. This simulation tool was developed based on social force model which was proposed by (Helbing and Molnar, 1995) to observe the behaviour of pedestrians. Basic principle of Social force model is to model pedestrian motion as Newtonian mechanics. Total force includes social, psychological and physical forces which ultimately provides acceleration of physical parameter. The forces generated from the defined destination and from other pedestrians, obstacles and attractions. Forces
were classified into three groups such as driving forces, repulsive forces and attractive forces for pedestrians’ movement. The driving force helps to move in the desired direction, the repulsive forces help to avoid collisions with other pedestrians or static obstacles and the attractive forces help the pedestrian move towards attractive objects.
7. VISWALK Model Construction Using
Real Data Sets
types modified in the default model. Predefined pedestrian types, men and women used for this model construction. Pedestrian composition is modified in the model using 97:3 ratio which was predefined in default model with an equal ratio of men and women. In pedestrian composition desired
distribution for men and women provided from the present study. These distributions are shown in the Fig. 4. Pedestrians can only move on the designated areas and ramps and those are drawn manually. Snap shots of VISWALK simulation run on 2D and 3D view are shown in Fig. 5.
Fig. 4.
Desired Speed Distribution for Men and Women Pedestrians
Fig. 5.
2D & 3D View of Constructed Model in VISWALK
Pedestrians and their movements can be defined by the two features, pedestrian inputs and pedestrian routes. Pedestrian inputs were created using the flow value in terms of pedestrians per hour with the pedestrian composition for each of the origins. Then routes were created, from the origin to the different destination areas. Pedestrian input was distributed from the origin to the different destinations as a
static percentage for the routes. Number of pedestrians those are using a route depends on the pedestrian input and the directional ratio. Actual path between origin and destination was calculated by the software only.
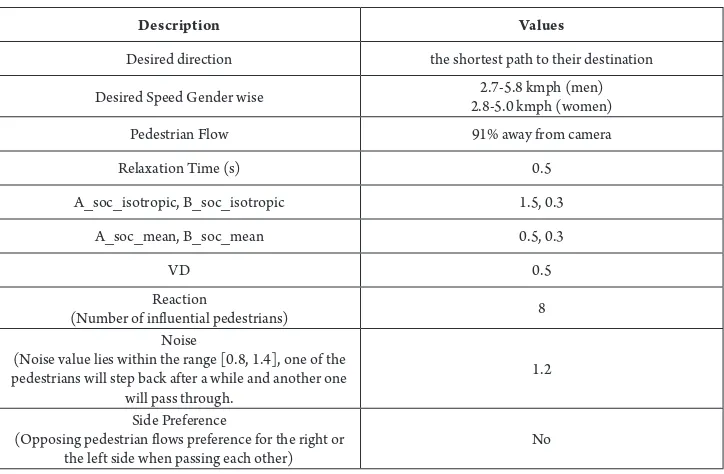
for pedestrians’ includes repulsive, friction, attractive and driving force. Required model parameters according to social force model are listed in Table 3. Calibrated values of VISWALK parameters to simulate pedestrians’ performance for this study in Indian condition is provided in the Table below. Hourly data of North campus (Delhi) was used to calibrate model parameters.
RMSE values were observed for validation of calibrated parameters. Minimum RMSE value was selected to take off values for VISWALK model parameters. 576 simulation was run to fix those values of parameters considering minimizing of error in terms of RMSE. Simulation was run for four seed values (30, 40, 50 and 60) and average value was taken.
Table 3
VISWALK Model Parameters
Description Values
Desired direction the shortest path to their destination
Desired Speed Gender wise 2.8-5.0 kmph (women)2.7-5.8 kmph (men)
Pedestrian Flow 91% away from camera
Relaxation Time (s) 0.5
A_soc_isotropic, B_soc_isotropic 1.5, 0.3
A_soc_mean, B_soc_mean 0.5, 0.3
VD 0.5
Reaction
(Number of influential pedestrians) 8
Noise
(Noise value lies within the range [0.8, 1.4], one of the pedestrians will step back after a while and another one
will pass through.
1.2
Side Preference
(Opposing pedestrian flows preference for the right or
the left side when passing each other) No
8. Model Validation
Model validation was done with the two criteria such as local and global validation. Local validation was done using the constructed VISWALK model with the different hourly data collected from the same location (North campus, Delhi). For global validation of model hourly data from the different location was simulated using
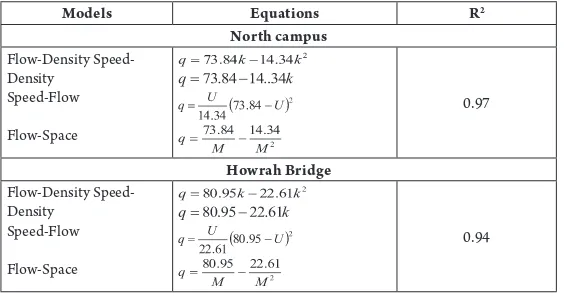
Table 4
Pedestrian Flow Models of Simulated Data
Models Equations R2
North campus
Flow-Density Speed-Density
Speed-Flow
Flow-Space
0.97
Howrah Bridge
Flow-Density Speed-Density
Speed-Flow
Flow-Space
0.94
Observed RMSE and MAE value for speed data and f low data for local and global validation are provided in Table 5. It can be observed that the estimated error value is less than 10. It implies that the constructed
model is accepted for defining sidewalk movement in Indian condition.
It can be concluded that the established model is validated with the field observation.
Table 5
Estimated Error for Validation of VISWALK Model
Error Local Validation Global Validation
Speed Flow Speed Flow
RMSE 6.18 3.79 8.35 5.67
MAE 4.97 2.94 7.99 3.01
9. Comparison of Observed and VISWALK
Simulated Models
From the developed macroscopic models, secondary flow parameters such as free flow
speed (uf), optimum speed (uo), optimum
density (ko), jam density (kj) and capacity
(qmax) were calculated. Estimated values of
secondary flow parameters for observed and simulated data are provided in Table 6 for both the locations. It shows the difference in free flow speed is 2.57% and for capacity the value is 3.72% at North campus which
Table 6
Estimated Secondary Flow Parameters at North Campus & Howrah Bridge
Flow Parameters ObservedNorth CampusSimulated ObservedHowrah BridgeSimulated
Free Flow Speed 75.80 m/min 73.84 m/min 80.95 m/min 73.87 m/min
Optimum Speed 37.89 m/min 36.92 m/min 40.48 m/min 36.94 m/min
Optimum Density 2.42 p/m2 2.57 p/m2 2.17 p/m2 2.60 p/m2
Jam Density 4.84 p/m2 5.15 p/m2 4.35 p/m2 5.21 p/m2
Capacity 91.64 p/min/m 95.05 p/min/m 88.03 p/min/m 96.14 p/min/m
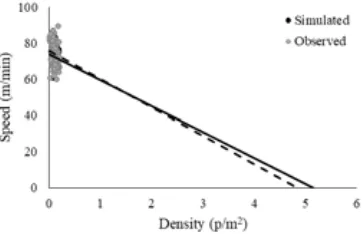
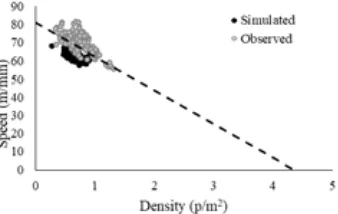
(a) Speed-Density Relationship for Simulated and Observed Data
(b) Flow-Density & Speed-Flow Relationship for Simulated and Observed Data
Fig. 6.
(a) Speed-Density Relationship for Simulated and Observed Data
(b) Flow-Density & Speed-Flow Relationship for Simulated and Observed Data
Fig. 7.
Comparison of MFDs for Simulated and Observed Data (Howrah Bridge)
From this study results, it can be concluded that the existing VISWALK software is able to simulate the performance of pedestrians in Indian condition. So it is applicable to use VISWA LK simulation tool for pedestrian flow models development in Indian context.
10. Conclusions
This study observed quantitative evaluation of pedestrian characteristics on sidewalks in India. Peak hour flow was observed using video graphic technique and fundamental flow parameters for instance speed, flow and density were extracted. Real data was fitted
Acknowledgement
The inputs received from MHRD fellowship at CTRANS, IIT Roorkee and the research project “Indo HCM WP-7” sponsored by CSIR-CRRI is thankfully acknowledged in the preparation of this paper.
References
Alexandersson, S.; Johansson, E. 2013. Pedestrians in Microscopic Traffic Simulation, Comparison Between Software Viswalk And Legion For Aimsun. Master’s Thesis, Chalmers University Of Technology, Gothenburg, Sweden. 89 p.
Federici, M.L.; Manenti, L.; Manzoni, S. 2014. A Checklist for the Evaluation of Pedestrian Simulation Software Functionalities, Arxiv Preprint Arxiv: 1404.7717.
Galiza, R.; Ferreira, L. 2013. A Methodology for Determining Equivalent Factors in Heterogeneous Pedestrian Flows, Computers, Environment and Urban Systems 39: 162-171.
Galiza, R.J.; Ferreira, L.; Charles, P. 2011. Estimating the Effects of Older People in Pedestrian Flow: A Micro-Simulation Approach. In Proceedings of the Transport Research Board TRB 90th Annual Meeting, 1-13.
Greenshields, B.A. 1935. Study in Highway Capacity. Highway Res. Board Proc. 448-477.
Helbing, D.; Molnar, P. 1995. Social Force Model for Pedestrian Dynamics, Physical Review E 51(5): 4282-4286.
Hoogendoorn, S.P. 2003. Microscopic Simulation of Pedestrian Flows. In Proceedings of the 82nd Annual Meeting
at the Transportation Research Board, [CD-Rom].
Huynh, D.N.; Boltze, M.; Vu, A.T. 2013. Modelling Mixed Traffic Flow at Signalized Intersectionusing Social Force Model, Journal of The Eastern Asia Society for Transportation Studies 10: 1734-1749.
Ishaque, M.M.; Noland, R.B. 2009. Pedestrian and Vehicle Flow Calibration in Multimodal Traffic Microsimulation, Journal of Transportation Engineering
135(6): 338-348.
Johansson, A. 2008. Data-Driven Modeling of Pedestrian Crowds. Faculty of Traffic Sciences ,,Friedrich List” Technische Universitat Dresden, Dreseden, Germany. 185 p.
Park, B.; Schneeberger, J. 2003. Microscopic Simulation Model Calibration And Validation: Case Study of VISSIM Simulation Model for a Coordinated Actuated Signal System, Transportation Research Record: Journal of The Transportation Research Board 1856: 185-192.
PTV AG. 2013. PTV Vissim 6 User Manual. Karlsruhe, Germany. 223 p.
Sahaleh, S.; Bierlaire, M.; Farooq, B.; Danalet, A.; Hänseler, F. 2012. Scenario Analysis of Pedestrian Flow in Public Spaces. In Proceedings of the12th Swiss Transport Research Conference, 25 p.
Zacharias, J.; Bernhardt, T.; De Montigny, L. 2005. Computer-Simulated Pedestrian Behavior in Shopping Environment, Journal of Urban Planning and Development
131(3): 195-200.