Predictive Validity of a 2-Question
Alcohol Screen at 1-, 2-, and
3-Year Follow-up
James G. Linakis, PhD, MD,a,bJulie R. Bromberg, MPH,a,bT. Charles Casper, PhD,cThomas H. Chun, MD, MPH,a,b Michael J. Mello, MD, MPH,a,bRachel Richards, MStat,cColette C. Mull, MD,d,eRohit P. Shenoi, MD,fCheryl Vance, MD,g Fahd Ahmad, MD, MSCI,hLalit Bajaj, MD, MPH,iKathleen M. Brown, MD,jLauren S. Chernick, MD, MSc,kDaniel M. Cohen, MD,l Joel Fein, MD, MPH,mTimothy Horeczko, MD, MSCR, FACEP, FAAP,nMichael N. Levas, MD,oBrett McAninch, MD,p
Michael C. Monuteaux, SCD,qJackie Grupp-Phelan, MD, MPH,rElizabeth C. Powell, MD, MPH,sAlexander Rogers, MD,t Brian Suffoletto, MD, MS,pJ. Michael Dean, MD, MBA,cAnthony Spirito, PhD,afor the Pediatric Emergency Care Applied Research Network
abstract
BACKGROUND:The National Institute on Alcohol Abuse and Alcoholism (NIAAA) 2-question screen
is a valid adolescent alcohol screening tool. No studies have examined if this tool predicts future alcohol problems. We conducted a study at 16 pediatric emergency departments to
determine the tool’s predictive validity for alcohol misuse and alcohol use disorders (AUDs).
METHODS:Participants (N= 4834) completed a baseline assessment battery. A subsample of
participants completed the battery at 1, 2, and 3 years follow up.
RESULTS:Of the 2209 participants assigned to up, 1611 (73%) completed a 1-year
follow-up, 1591 (72%) completed a 2-year follow-follow-up, and 1377 (62%) completed a 3-year follow-up. The differences in AUDs between baseline NIAAA screen nondrinkers and lower-risk drinkers were statistically significant at 1 year (P= .0002), 2 years (P,.0001), and 3 years (P= .0005),
as were the differences between moderate- and highest-risk drinkers at 1 and 2 years (P,
.0001 andP= .0088, respectively) but not at 3 years (P= .0758). The best combined score for
sensitivity (86.2% at 1 year, 75.6% at 2 years, and 60.0% at 3 years) and specificity (78.1% at
1 year, 79.2% at 2 years, and 80.0% at 3 years) was achieved by using“lower risk”and higher
as a cutoff for the prediction of aDiagnostic and Statistical Manual of Mental Disorders, Fifth Editiondiagnosis.
CONCLUSIONS:The NIAAA 2-question screen can accurately characterize adolescent risk for future
AUDs. Future studies are needed to determine optimaluse of the screen.
WHAT’S KNOWN ON THIS SUBJECT:The early
identification of youth with alcohol problems is strongly recommended and the pediatric emergency department is one avenue to identify and intervene. The National Institute on Alcohol Abuse and Alcoholism 2-question screen is 1 brief and valid tool.
WHAT THIS STUDY ADDS:In this study, we determine the predictive value of the National Institute on Alcohol Abuse and Alcoholism 2-question screen. In this article, we report on the 1-, 2-, and 3-year predictive validity of the screen for alcohol use and alcohol use disorders.
To cite: Linakis JG, Bromberg JR, Casper TC, et al. Predictive Validity of a 2-Question Alcohol Screen at 1-, 2-, and 3-Year Follow-up.Pediatrics. 2019;143(3):e20182001
a
The Warren Alpert Medical School, Brown University, Providence, Rhode Island;bRhode Island Hospital, Providence, Rhode Island;cUniversity of Utah, Salt Lake City, Utah;dNemours/Alfred I. duPont Hospital for Children,
Wilmington, Delaware;eSidney Kimmel Medical College, Thomas Jefferson University, Philadelphia, Pennsylvania;
fTexas Children’s Hospital and College of Medicine, Baylor University, Houston, Texas;gUniversity of California,
Davis, Davis, California;hSt Louis Children’s Hospital and School of Medicine, Washington University in St Louis, St Louis, Missouri;iChildren’s Hospital Colorado, Aurora, Colorado;jChildren’s National Medical Center,
Washington, District of Columbia;kColumbia University Irving Medical Center, New York City, New York; lNationwide Children’s Hospital, Columbus, Ohio;mChildren’s Hospital of Philadelphia, Philadelphia, Pennsylvania; nLos Angeles Biomedical Research Institute, Torrance, California;oMedical College of Wisconsin, Milwaukee,
Wisconsin;pUniversity of Pittsburg Medical Center Children’s Hospital of Pittsburgh and School of Medicine,
University of Pittsburgh, Pittsburgh, Pennsylvania;qBoston Children’s Hospital, Boston, Massachusetts; r
The early identification of adolescents who are at high risk may be an important step in preventing the escalation of adolescent alcohol use and misuse and the eventual
development of alcohol use disorders (AUDs) and their sequelae.1
Screening, brief intervention, and referral to treatment (SBIRT) is awell-recognized strategy for addressing this problem and is widely recommended by federal and professional organizations.2–6 Although a number of alcohol screening tools exist,7the National Institute on Alcohol Abuse and Alcoholism (NIAAA) recommends the use of a brief adolescent alcohol screen that is used to ask about a patient’s drinking frequency and their friends’drinking.1The authors and others have previously reported that this NIAAA 2-question screen is a valid approach to alcohol screening that is briefer than most comparable screens.8–10Categorizing youth as moderate or higher risk on the NIAAA 2-question screen had high sensitivity and specificity for determining concurrent mild-to-severe AUDs as defined bythe Diagnostic and Statistical Manual of Mental Disorders, Fifth Edition(DSM-5). The DSM-5 can be used to specifically query for 11 alcohol abuse criteria, and the presence of$2 of these criteria indicates an AUD. The DSM-5 is generally considered the gold standard for the diagnosis of substance use disorders and was used as such in our present and earlier studies. A positive response to 1 item (drinker versus nondrinker) on the NIAAA 2-question screen for middle school students and, for high school students, to$2 drinking days over the past year also had high sensitivity and specificity for an Alcohol Use Disorders Identification Test11–13score of 4, which is a frequently used cutoff for diagnosing adolescent AUDs. In our earlier study,8we used the Alcohol Use Disorders Identification Test
(AUDIT) to evaluate the convergent validity of the NIAAA 2-question screen.
Existing psychometric data on the NIAAA 2-question screen are encouraging, and preliminary analyses of the individual questions revealed that the screen may be an effective predictor of future alcohol problems.14,15The purpose of this study was to determine the predictive validity of the NIAAA 2-question screen with respect to future alcohol use and misuse in adolescents who present to the pediatric emergency department (PED). Specifically, we investigated predictions of the number of adolescent drinking days
and DSM-5–based AUDs at 1, 2, and
3 years after the screen’s
administration during a PED visit.
METHODS
Enrollment took place across a 25-month period from May 2013 to June 2015. A criterion assessment battery was self-administered on a tablet computer by participants 12 to 17 years of age who were treated for a nonlife-threatening injury, illness, or mental health condition in 1 of 16 PEDs that belonged to the Pediatric Emergency Care Applied Research Network (PECARN). Institutional review board approval was obtained at all sites before beginning study enrollment. After obtaining informed parental consent and adolescent assent, participants completed the assessment battery that consisted of
the NIAAA 2-question screen16and
other measures of substance use and risk behavior, including the number of drinking days in the past year and the Diagnostic Interview Schedule for Children (DISC),17which is
a structured, DSM-5–based interview used to determine alcohol-use diagnoses. For adolescents who report not drinking alcohol, the DISC
can be administered in,1 minute;
however, depending on the amount of drinking and the scope of
drinking-based problems, it can take$20 minutes. The questions on the NIAAA 2-question screen differ slightly for middle school and high school students and are used to categorize patients as nondrinkers, lower risk, moderate risk or highest risk.1For middle school ages, the participant is
asked,“Do you have any friends who
drank beer, wine, or any drink containing alcohol in the past year?” This is followed by,“How about you? In the past year, on how many days have you had more than a few sips of beer, wine, or any drink containing alcohol?”For high school ages, the participant isfirst asked,“In the past year, on how many days have you had more than a few sips of beer, wine, or any drink containing alcohol?”Then the participant is asked,“If your friends drink, how many drinks do they usually drink on an occasion?” Participants,16 years of age who consumed alcohol in the past year are classified as either moderate risk or highest risk, depending on their level of drinking, whereas participants
aged$16 years with past-year
drinking are classified as lower risk, moderate risk, or highest risk. A subsample of our original sample was randomly selected to be
readministered the criterion assessment battery at 1-, 2-, and 3-year follow-up to examine the predictive validity of the 2-question screen. Follow-up assessments were completed by March 2018.
Participants received a $10 gift card for the baseline survey and a $25 gift card for each annual follow-up survey. The original study
methodology is detailed in an earlier article.18
The sensitivity for predicting problematic alcohol use was used as the basis for our sample size requirements. We assumed a target sensitivity of 90%. For the 95% confidence intervals (CIs) around sensitivity to be within65%,∼1600 participants with outcome data would
30% attrition. All analyses were performed by using SAS Version 9.4 (SAS Institute, Inc, Cary, NC).
The number of drinking days in the past year at 1-, 2-, and 3-year follow-up was compared across baseline NIAAA risk categories by using the Kruskal-Wallis test. Predictive validity was examined via a logistic regression model that we used to compare the odds of a DISC diagnosis against a baseline risk category on the NIAAA 2-question screen. Differences in DISC diagnosis of AUD19(yes or no) between levels that represented a single change in baseline NIAAA risk categorization (nondrinker versus low risk, low versus moderate risk, and moderate versus high risk) were tested with the Wald test. The Cochran-Armitage test was used to examine the trend to receive a DISC diagnosis across all of the screen categories. Receiver operating characteristic (ROC) curve methods were then used to examine the characteristics of the baseline NIAAA 2-question screen for predicting a DISC diagnosis at 1-, 2-, or 3-year follow-up by using various cut points. With this methodology, sensitivity measured the probability that the 2-question screen appropriately categorized participants with a DISC diagnosis of an AUD, whereas specificity measured the probability that the 2-question screen
appropriately categorized participants who did not have a DISC diagnosis of an AUD. We defined the optimal cut point as the point at which the sum of sensitivity and specificity was
maximized. Test characteristics were calculated at each potential cut point, and the area under the curve (AUC) was used to provide an assessment of the overall accuracy of the screen in predicting DISC diagnoses. These analyses were performed for 1-, 2-, and 3-year follow-up time points.
RESULTS
Out of our original baseline sample of 4834 participants, a total of 2209
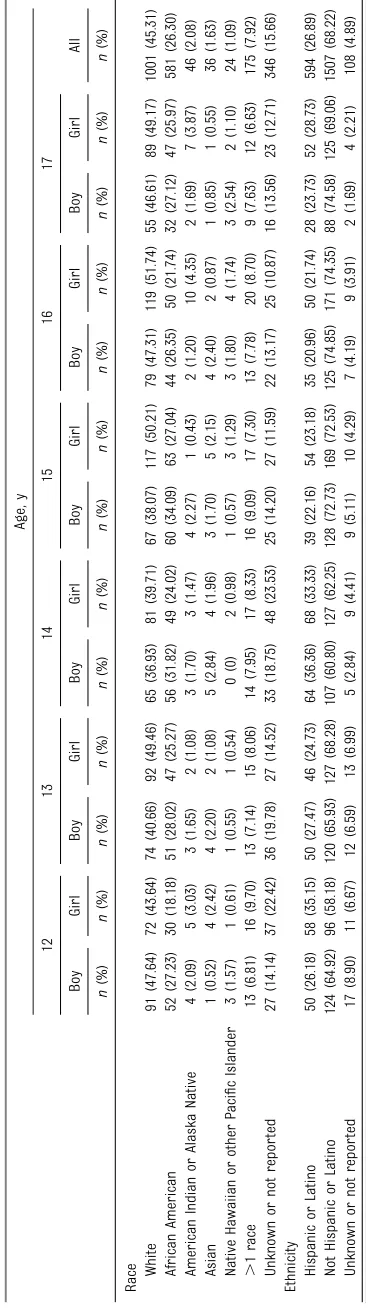
participants were randomly selected for 1-, 2-, and 3-year follow-up. Of those 2209 participants, 1611 (73%) completed a 1-year follow-up, 1591 (72%) completed a 2-year follow-up, and 1377 (62%) completed a 3-year follow-up. The race and ethnicity of participants at baseline (broken down by age and sex) are shown in Table 1. Participants were equally distributed across sex and age. Demographic characteristics are nearly identical to those of the previously reported full
cohort.18We were able to determine
DISC AUD diagnoses for 1549 participants at 1-year follow-up, 1524 participants at 2-year follow-up, and 1314 participants at 3-year follow-up. Demographics of the follow-up sample were significantly different for biological sex (P= .009) and race (P,.001). Female
participants were more likely than male participants to complete follow-up, and white and Asian American participants were more likely to complete follow-up
compared with those of other races.
NIAAA Assessment and Past-Year Drinking
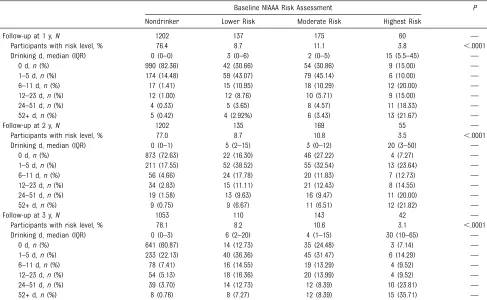
A comparison of the baseline NIAAA risk level of each participant and their reported number of past-year drinking days at 1-, 2-, and 3-year follow-up is shown in Table 2. Those participants who were classified as nondrinkers at baseline had the fewest drinking days at 1-, 2-, and 3-year follow-up, whereas those who were assessed to be at highest risk at baseline had the highest number of drinking days at 1-, 2-, and 3-year follow-up. Participants who were at lower and moderate risk reported a distribution of drinking days that fell between nondrinkers and those at highest risk, but there was little difference between participants who were at lower and moderate risk. In general, the number of drinking days was higher at 2 years than at 1 year across all groups, and it was higher yet at 3 years.
Predictive Validity
In Table 3, we summarize the DSM-5 diagnoses of AUD on the DISC at 1-, 2-, and 3-year follow-up by categories of the NIAAA risk level at baseline. The differences between both
nondrinkers and participants who were at lower risk and between those at moderate risk and highest risk were statistically significant at 1 year (P= .0002), 2 years (P,.0001), and 3 years (P= .0005), whereas the rate of diagnoses of AUD on the DISC was similar between lower and moderate risk. The differences between the moderate-risk group and the highest-risk group were significant at 1-year
follow-up (P,.0001) and 2-year
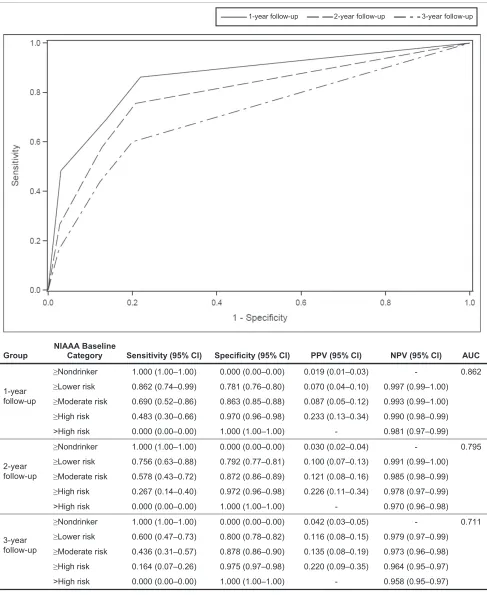
follow-up (P= .0088) but not at 3-year follow-up (P= .0758). In Fig 1, we demonstrate the predictive ability of the 2-question screen with reference to DSM-5 diagnoses in ROC format. The best combined sensitivity and specificity score was achieved by using“lower risk”and higher as a cutoff for all 3 years. This resulted in a sensitivity score of 86% (95% CI:
74%–99%) at 1 year, 76% (95% CI:
63%–88%) at 2 years, and 60% (95%
CI: 47%–73%) at 3 years, and it resulted in a specificity score of 78%
(95% CI: 76%–80%) at 1 year, 79%
(95% CI: 77%–81%) at 2 years, and
80% (95% CI: 78%–82%) at 3 years.
Overall, the predictive characteristics were comparable for 1-year AUD diagnoses (AUC 0.862) and 2-year AUD diagnoses (AUC 0.795), with
a somewhat lowerfigure for 3 years
(AUC 0.711).
DISCUSSION
Both medical and federal
organizations have recommended screening and behavioral counseling interventions to reduce alcohol misuse and have developed resources to support the implementation of these services. In a recent study of US hospitals that treat injured
for their adolescent emergency department patients.20This same study revealed that 31% of the US hospitals that were surveyed did not use a standardized screening instrument but rather incorporated alcohol questions into their general hospital assessments. A brief screen, such as the NIAAA 2-question screen, might significantly contribute to a more widespread adoption of screening.
This multisite assessment study of the predictive validity of the NIAAA 2-question screen revealed that the screen had acceptable sensitivity and specificity with respect to a DSM-5 diagnosis of AUD 1, 2, and 3 years after its original administration. The unique contribution of this study was the 3-year follow-up period and our ability to examine long-term prediction in this sample. The best combined sensitivity and specificity scores were achieved by using
“lower risk”and higher as a cutoff for the prediction of a DSM-5 diagnosis at 1 year (sensitivity = 86.2%; specificity = 78.1%), 2 years (sensitivity = 75.6%; specificity = 79.2%), and 3 years (sensitivity = 60.0%;
specificity = 80.0%). The areas under the curve of the DSM-5 diagnosis ROC at 1- and 2-year follow-up compared favorably to those we found for an AUD diagnosis cross-sectionally18; the
ROCfindings were weaker by 3 years.
Although prediction at 1 year might be of most interest to the primary care physician because screening is typically repeated at annual visits, the fact that the NIAAA 2-question screener has comparable relevance for prediction over 2 years adds to our understanding of the use of alcohol-use screening in the PED.
Adolescents who initially screened as being at highest risk on the NIAAA 2-question screen were shown to be more likely to have a higher number of drinking days and to be at higher risk for AUD at 1, 2, and 3 years. However, it is noteworthy that the
predictive ability of the 2-question screen does not differentiate between those who initially screen as being at lower risk and those who screen as being at moderate risk. It appears that at lower numbers of drinking days, the screen is less effective in estimating future risk level. This may be related to the fact that the risk assessment algorithm for the NIAAA 2-question screen1is based on age, and for 12- to 15-year-old
adolescents, any drinking is
categorized as at least moderate risk (ie, there is no possibility of being categorized as lower risk in this age group). Because a significant portion of our sample fell into this younger age group, this reduced the likelihood of discerning differences between the lower- and moderate-risk groups even if they existed.
Research has revealed that over the course of adolescence, the proportion of individuals who report past-year
alcohol use increases dramatically, from 17.6% of eighth-graders to 56% of 12th-graders nationwide.21In our study, at 3-year follow-up, many participants in the lower-risk baseline group would have been at least 18 years of age and might“normally” be expected to be engaged in riskier drinking. This also likely explains the
finding that the number of drinking
days increased from 1- to 3-year follow-up for all of the baseline risk groups because this appears to
TABLE 2Baseline NIAAA Risk Assessment Versus Drinking Days at Follow-up
Baseline NIAAA Risk Assessment P
Nondrinker Lower Risk Moderate Risk Highest Risk
Follow-up at 1 y,N 1202 137 175 60 —
Participants with risk level, % 76.4 8.7 11.1 3.8 ,.0001
Drinking d, median (IQR) 0 (0–0) 3 (0–6) 2 (0–5) 15 (5.5–45) —
0 d,n(%) 990 (82.36) 42 (30.66) 54 (30.86) 9 (15.00) —
1–5 d,n(%) 174 (14.48) 59 (43.07) 79 (45.14) 6 (10.00) — 6–11 d,n(%) 17 (1.41) 15 (10.95) 18 (10.29) 12 (20.00) — 12–23 d,n(%) 12 (1.00) 12 (8.76) 10 (5.71) 9 (15.00) —
24–51 d,n(%) 4 (0.33) 5 (3.65) 8 (4.57) 11 (18.33) —
52+ d,n(%) 5 (0.42) 4 (2.92%) 6 (3.43) 13 (21.67) —
Follow-up at 2 y,N 1202 135 169 55 —
Participants with risk level, % 77.0 8.7 10.8 3.5 ,.0001
Drinking d, median (IQR) 0 (0–1) 5 (2–15) 3 (0–12) 20 (3–50) —
0 d,n(%) 873 (72.63) 22 (16.30) 46 (27.22) 4 (7.27) —
1–5 d,n(%) 211 (17.55) 52 (38.52) 55 (32.54) 13 (23.64) — 6–11 d,n(%) 56 (4.66) 24 (17.78) 20 (11.83) 7 (12.73) — 12–23 d,n(%) 34 (2.83) 15 (11.11) 21 (12.43) 8 (14.55) — 24–51 d,n(%) 19 (1.58) 13 (9.63) 16 (9.47) 11 (20.00) —
52+ d,n(%) 9 (0.75) 9 (6.67) 11 (6.51) 12 (21.82) —
Follow-up at 3 y,N 1053 110 143 42 —
Participants with risk level, % 78.1 8.2 10.6 3.1 ,.0001
Drinking d, median (IQR) 0 (0–3) 6 (2–20) 4 (1–15) 30 (10–65) —
0 d,n(%) 641 (60.87) 14 (12.73) 35 (24.48) 3 (7.14) —
1–5 d,n(%) 233 (22.13) 40 (36.36) 45 (31.47) 6 (14.29) — 6–11 d,n(%) 78 (7.41) 16 (14.55) 19 (13.29) 4 (9.52) — 12–23 d,n(%) 54 (5.13) 18 (16.36) 20 (13.99) 4 (9.52) — 24–51 d,n(%) 39 (3.70) 14 (12.73) 12 (8.39) 10 (23.81) —
52+ d,n(%) 8 (0.76) 8 (7.27) 12 (8.39) 15 (35.71) —
Kruskal-Wallis test: this categorization is what is used by the NIAAA in its risk assessment chart for the NIAAA 2-question screen.1IQR, interquartile range;—, not applicable.
TABLE 3Distribution of DSM-5 Diagnoses of AUD at Follow-up and NIAAA 2-Question Screen Risk Assessment at Baseline
Baseline NIAAA Risk DSM-5 AUD at 1 y DSM-5 AUD at 2 y DSM-5 AUD at 3 y
Yes (%) P Yes (%) P Yes (%) P
Nondrinker 4 of 1191 (0.34) — 11 of 1183 (0.93) — 22 of 1029 (2.14) — Participant who drank with lower risk 5 of 129 (3.88) .0002 8 of 126 (6.35) ,.0001 9 of 107 (8.41) .0005 Participant who drank with moderate risk 6 of 169 (3.55) .8826 14 of 162 (8.64) .4692 15 of 137 (10.95) .5101 Participant who drank with highest risk 14 of 60 (23.33) ,.0001 12 of 53 (22.64) .0088 9 of 41 (21.95) .0758
FIGURE 1
represent the“normal”age-based trajectory (ie, prevalence increases). Because we followed the same participants from the time of
enrollment through the 3-year follow-up contact, it would be expected that drinking rates would have increased over that time, and hence these data also contribute to our understanding of the natural history of adolescent alcohol use.
Ourfindings suggest that the
NIAAA 2-question screen may offer a viablefirst step for screening adolescents who may be at risk for the development of an AUD. In this study (and typically in clinical practice) most adolescents who are screened in this manner will screen with negative results, and, at least in the PED setting, further action would be unnecessary. By using our results as a starting point, an assessment of the consequences of screening can be estimated. For example, using the optimal cutoff from the ROC curve, we would expect about 20 false alarms (patients who have positive results on the screen but do not go on to develop an AUD within 3 years) out of every 100 patients who were screened. Stated another way, because 23% of our participants screened with positive results on the NIAAA screen and 11.6% of those participants exhibited an AUD at the 3-year follow-up, it would be expected that 38 adolescents would need to be screened to detect 1 participant with positive results. Although on first glance this appears to be a relatively modest return, the brevity of the screening process and the potential impact may argue in favor of screening.
Ourfindings differ somewhat from
those of a recent cross-sectional
study22 of adolescents who were
screened in primary care clinics, which found age differences in the cutoff score for risk of an AUD. The differentialfindings might be
related to the different settings and/or the cross-sectional versus longitudinal nature of the 2 studies. Nonetheless, the ideal approach for responding to positive results on a screen (lower-risk category or higher) remains to be determined and is likely to vary from 1 setting or 1 PED to another, depending on a number of factors, including the availability of resources. In some resource-intensive settings, a positive response might initiate a more in-depth investigation into the adolescent’s alcohol use either through direct questioning or a more thorough self-report assessment. Although this approach may vary by setting, the ultimate purpose would be to aid decisions about further evaluation and referral to treatment. In fact, researchers in a number of studies have evaluated brief interventions that could potentially be
administered in the PED
setting.23–30Additional studies will be required to determine the most effective means for screening, the best process for delivering a brief intervention in the PED when called for, and the circumstances in which referral to further treatment is appropriate.
There are a number of limitations to this study. First, although the sample was large and diverse, PECARN PEDs are generally based in urban medical centers and may not be representative of US PEDs. Similarly, it is conceivable that those who refused participation in the study differed in some
systematic way from those who agreed to participate. Follow-up rates were in the 70% range, thereby allowing for the possibility that those who did not respond to follow-up may systematically differ from the group reported here. Also, measures in the current study were self-administered, and thus we do not know whether the screen would perform differently if
administered directly by a health care provider. Importantly, however, self-administered screening for sensitive questions has been shown to be more accurate than face-to-face
screening31,32and should be
considered in clinical practice. In addition, because the study required parental permission, adolescent reports of substance use may have been affected despite our reassurances that responses were confidential. Finally (as noted above), the 2-question screen is used to risk stratify the number of drinks in the past year
differently for younger adolescents than for older adolescents. This presents some challenges when adolescents are followed longitudinally.
CONCLUSIONS
promote both preventive
interventions and intervention for those who are identified as being at risk.
ACKNOWLEDGMENTS
We acknowledge PECARN, PECARN Steering Committee members, staff at the Data Coordinating Center, and the participating PECARN sites, which include the following: Baylor College of Medicine and Texas Children’s Hospital; Boston Children’s Hospital; Children’s Hospital of Philadelphia; Children’s National Health System; Cincinnati Children’s Hospital Medical Center; Columbia University and Morgan Stanley Children’s Hospital of New York-Presbyterian; Hasbro Children’s Hospital; Ann & Robert H.
Lurie Children's Hospital of Chicago; Medical College of Wisconsin; Nationwide Children’s Hospital; Sidney Kimmel Medical College and Nemours/Alfred I. duPont Hospital for Children; St. Louis Children’s Hospital and Washington University in St Louis; University of California, Davis; Children’s Hospital Colorado; Michigan Medicine and the University of Michigan; and the University of Pittsburgh and University of
Pittsburgh Medical Center Children’s Hospital of Pittsburgh. Our efforts would not have been possible without the commitment of the investigators and research coordinators from these sites. Lastly, the authors thank the participants and their parents for participating in this study.
ABBREVIATIONS
AUC: area under the curve AUD: alcohol use disorder CI: confidence interval DISC: Diagnostic Interview
Schedule for Children DSM-5:Diagnostic and Statistical
Manual of Mental Disorders, Fifth Edition
NIAAA: National Institute on Alcohol Abuse and Alcoholism
PECARN: Pediatric Emergency Care Applied Research Network
PED: pediatric emergency department
ROC: receiver operating characteristic
Dr Linakis contributed to the study design, formulated the manuscript concept, and drafted the initial manuscript; Ms Bromberg and Drs Chun and Mello contributed to the design of the study and critically reviewed and edited the manuscript; Dr Casper contributed to the design of the study, supervised the analyses, and reviewed and revised the manuscript; Dr Dean contributed to the design of the study and reviewed and edited the manuscript; Ms Richards contributed to the design of the study, performed data analyses, and reviewed and revised the manuscript; Drs Mull, Shenoi, Vance, Ahmad, Bajaj, Brown, Chernick, Cohen, Fein, Horeczko, Levas, McAninch, Grupp-Phelan, Powell, Rogers, and Suffoletto and Mr Monuteaux contributed to the acquisition of data and revised the article critically for important intellectual content; Dr Spirito contributed to the design of the study, formulated the manuscript concept, and critically reviewed and edited the manuscript; and all authors approved thefinal manuscript as submitted and agree to be accountable for all aspects of the work.
DOI:https://doi.org/10.1542/peds.2018-2001
Accepted for publication Dec 13, 2018
Address correspondence to James G. Linakis, PhD, MD, Department of Emergency Medicine, Rhode Island Hospital, 55 Claverick St, 2nd Floor, Providence, RI 02903. E-mail: [email protected]
PEDIATRICS (ISSN Numbers: Print, 0031-4005; Online, 1098-4275). Copyright © 2019 by the American Academy of Pediatrics
FINANCIAL DISCLOSURE:The authors have indicated they have nofinancial relationships relevant to this article to disclose.
FUNDING:Supported in part by the National Institute on Alcohol Abuse and Alcoholism (1R01AA021900; Drs Spirito and Linakis). This project is supported in part by the Health Resources and Services Administration, the Maternal and Child Health Bureau, and the Emergency Medical Services for Children Network Development Demonstration Project under cooperative agreements U03MC00008, U03MC00001, U03MC00003, U03MC00006, U03MC00007, U03MC22684, and U03MC22685. This information and/or content and conclusions are those of the authors and should not be construed as the official position or policy of the Health Resources and Services Administration, the US Department of Health and Human Services, or the US government, nor should any endorsements from these entities be inferred. Funded by the National Institutes of Health (NIH).
POTENTIAL CONFLICT OF INTEREST:The authors have indicated they have no potential conflicts of interest to disclose.
COMPANION PAPER:A companion to this article can be found online at www.pediatrics.org/cgi/doi/10.1542/peds.2018-3654.
REFERENCES
1. National Institute on Alcohol Abuse and Alcoholism. Alcohol screening and brief intervention for youth: a practitioner’s guide. 2011. Available at: www.niaaa.nih.gov/YouthGuide.
Accessed December 15, 2017
2. Kokotailo PK; Committee on Substance Abuse. Alcohol use by youth and
adolescents: a pediatric concern. Pediatrics. 2010;125(5):1078–1087
emergency department policy statement. 2011. Available at: https:// www.acep.org/patient-care/policy- statements/alcohol-screening-in-the-emergency-department. Accessed January 13, 2019
4. American College of Surgeons Committee on Trauma. Resources for optimal care of the injured patient, Sixth Edition. 2014. Available at: www. facs.org/quality-programs/trauma/tqp/ center-programs/vrc. Accessed January 13, 2019
5. Substance Abuse and Mental Health Services Administration. Screening, brief intervention and referral to treatment. 2017. Available at: www. samhsa.gov/sbirt. Accessed January 13, 2019
6. Higgins-Biddle J, Hungerford D, Cates-Wessel K.Screening and Brief Intervention (SBI) for Unhealthy Alcohol Use: A Step-By-Step Implementation Guide for Trauma Centers. Atlanta, GA: Centers for Disease Control and Prevention, National Center for Injury Prevention and Control; 2009
7. Levy SJ, Williams JF; Committee on Substance Use and Prevention. Substance use screening, brief intervention, and referral to treatment. Pediatrics. 2016;138(1):e20161211
8. Spirito A, Bromberg JR, Casper TC, et al; Pediatric Emergency Care Applied Research Network. Reliability and validity of a two-question alcohol screen in the pediatric emergency department.Pediatrics. 2016;138(6): e20160691
9. D’Amico EJ, Parast L, Meredith LS, Ewing BA, Shadel WG, Stein BD. Screening in primary care: what is the best way to identify at-risk youth for substance use? Pediatrics. 2016;138(6):e20161717
10. Levy S, Dedeoglu F, Gaffin JM, et al. A screening tool for assessing alcohol use risk among medically vulnerable youth.PLoS One. 2016;11(5):e0156240
11. Chung T, Colby SM, Barnett NP, Monti PM. Alcohol use disorders identification test: factor structure in an adolescent emergency department sample.Alcohol Clin Exp Res. 2002;26(2):223–231
12. Chung T, Colby SM, Barnett NP, Rohsenow DJ, Spirito A, Monti PM. Screening adolescents for problem
drinking: performance of brief screens against DSM-IV alcohol diagnoses. J Stud Alcohol. 2000;61(4):579–587
13. Fairlie AM, Sindelar HA, Eaton CA, Spirito A. Utility of the AUDIT for screening adolescents for problematic alcohol use in the emergency department.Int J Adolesc Med Health. 2006;18(1):115–122
14. Chung T, Smith GT, Donovan JE, et al. Drinking frequency as a brief screen for adolescent alcohol problems. Pediatrics. 2012;129(2):205–212
15. Brown S, Donovan J, McGue M, Shulenberg J, Zucker R, Goldman M. Youth alcohol screening workgroup II: determining optimal secondary screening questions [abstract].Alcohol Clin Exp Res. 2010;34(suppl 2):267A
16. National Institute on Alcohol Abuse and Alcoholism.Alcohol Screening and Brief Intervention for Youth: A Practitioner’s Guide. Bethesda, MD: National Institutes of Health; 2011
17. Fisher PW, Shaffer D, Piacentini JC, et al. Sensitivity of the Diagnostic Interview Schedule for Children, 2nd edition (DISC-2.1) for specific diagnoses of children and adolescents.J Am Acad Child Adolesc Psychiatry. 1993;32(3): 666–673
18. Bromberg JR, Spirito A, Chun T, et al; Pediatric Emergency Care Applied Research Network. Methodology and demographics of a brief adolescent alcohol screen validation study [published online ahead of print July 3, 2017].Pediatr Emerg Care. doi:doi: 10.1097/PEC.0000000000001221
19. American Psychiatric Association. Diagnostic and Statistical Manual of Mental Disorders. 5th ed. Washington, DC: American Psychiatric Association Publishing; 2013
20. Schweer LH. Pediatric SBIRT: understanding the magnitude of the problem.J Trauma Nurs. 2009;16(3): 142–147
21. Johnston LD, O’Malley PM, Miech RA, Bachman JG, Schulenberg JE. Monitoring the Future National Survey Results on Drug Use, 1975-2016: Overview, Key Findings on Adolescent Drug Use. Ann Arbor, MI: Institute for Social Research, The University of Michigan; 2017
22. Parast L, Meredith LS, Stein BD, Shadel WG, D’Amico EJ. Identifying adolescents with alcohol use disorder: optimal screening using the National Institute on Alcohol Abuse and Alcoholism screening guide.Psychol Addict Behav. 2018;32(5):508–516
23. Bernstein E, Edwards E, Dorfman D, Heeren T, Bliss C, Bernstein J. Screening and brief intervention to reduce marijuana use among youth and young adults in a pediatric emergency department.Acad Emerg Med. 2009; 16(11):1174–1185
24. Monti PM, Colby SM, Barnett NP, et al. Brief intervention for harm reduction with alcohol-positive older adolescents in a hospital emergency department. J Consult Clin Psychol. 1999;67(6): 989–994
25. Spirito A, Monti PM, Barnett NP, et al. A randomized clinical trial of a brief motivational intervention for alcohol-positive adolescents treated in an emergency department.J Pediatr. 2004; 145(3):396–402
26. Walton MA, Chermack ST, Shope JT, et al. Effects of a brief intervention for reducing violence and alcohol misuse among adolescents: a randomized controlled trial.JAMA. 2010;304(5): 527–535
27. Newton AS, Dong K, Mabood N, et al. Brief emergency department interventions for youth who use alcohol and other drugs: a systematic review.Pediatr Emerg Care. 2013; 29(5):673–684
28. D’Amico EJ, Parast L, Shadel WG, Meredith LS, Seelam R, Stein BD. Brief motivational interviewing intervention to reduce alcohol and marijuana use for at-risk adolescents in primary care. J Consult Clin Psychol. 2018;86(9): 775–786
29. Walton MA, Bohnert K, Resko S, et al. Computer and therapist based brief interventions among cannabis-using adolescents presenting to primary care: one year outcomes.Drug Alcohol Depend. 2013;132(3):646–653
www.pediatrics.org/cgi/content/full/ 136/4/e783
31. Hussain N, Sprague S, Madden K, Hussain FN, Pindiprolu B, Bhandari M. A comparison of the types of screening
tool administration methods used for the detection of intimate partner violence: a systematic review and meta-analysis.Trauma Violence Abuse. 2015; 16(1):60–69
DOI: 10.1542/peds.2018-2001 originally published online February 19, 2019;
2019;143;
Pediatrics
Research Network
Michael Dean, Anthony Spirito and for the Pediatric Emergency Care Applied
Jackie Grupp-Phelan, Elizabeth C. Powell, Alexander Rogers, Brian Suffoletto, J.
Monuteaux,
Fein, Timothy Horeczko, Michael N. Levas, Brett McAninch, Michael C.
Ahmad, Lalit Bajaj, Kathleen M. Brown, Lauren S. Chernick, Daniel M. Cohen, Joel
Mello, Rachel Richards, Colette C. Mull, Rohit P. Shenoi, Cheryl Vance, Fahd
James G. Linakis, Julie R. Bromberg, T. Charles Casper, Thomas H. Chun, Michael J.
Follow-up
Predictive Validity of a 2-Question Alcohol Screen at 1-, 2-, and 3-Year
Services
Updated Information &
http://pediatrics.aappublications.org/content/143/3/e20182001 including high resolution figures, can be found at:
References
http://pediatrics.aappublications.org/content/143/3/e20182001#BIBL This article cites 24 articles, 6 of which you can access for free at:
Subspecialty Collections
http://www.aappublications.org/cgi/collection/substance_abuse_sub Substance Use
dicine_sub
http://www.aappublications.org/cgi/collection/adolescent_health:me Adolescent Health/Medicine
following collection(s):
This article, along with others on similar topics, appears in the
Permissions & Licensing
http://www.aappublications.org/site/misc/Permissions.xhtml in its entirety can be found online at:
Information about reproducing this article in parts (figures, tables) or
Reprints
DOI: 10.1542/peds.2018-2001 originally published online February 19, 2019;
2019;143;
Pediatrics
Research Network
Michael Dean, Anthony Spirito and for the Pediatric Emergency Care Applied
Jackie Grupp-Phelan, Elizabeth C. Powell, Alexander Rogers, Brian Suffoletto, J.
Monuteaux,
Fein, Timothy Horeczko, Michael N. Levas, Brett McAninch, Michael C.
Ahmad, Lalit Bajaj, Kathleen M. Brown, Lauren S. Chernick, Daniel M. Cohen, Joel
Mello, Rachel Richards, Colette C. Mull, Rohit P. Shenoi, Cheryl Vance, Fahd
James G. Linakis, Julie R. Bromberg, T. Charles Casper, Thomas H. Chun, Michael J.
Follow-up
Predictive Validity of a 2-Question Alcohol Screen at 1-, 2-, and 3-Year
http://pediatrics.aappublications.org/content/143/3/e20182001
located on the World Wide Web at:
The online version of this article, along with updated information and services, is
by the American Academy of Pediatrics. All rights reserved. Print ISSN: 1073-0397.