537 | P a g e
STUDY ON STRENGTH CHARACTERICTICS OF
CONCRETE CONTAINING GRANITE WASTE AS A
PARTIAL REPLACEMENT OF COARSE
AGGREGATE
Mr. Om Prakash Mahto
1, Miss. Nidhi Gupta
2 1Department of Civil Engineering, RKDF Institute of Science & Technology, (India)
2
Head of Department of Civil Engineering, RKDF Institute of Science & Technology, (India)
ABSTRACT
Granite industry has grown significantly in the last decades. Accordingly, the amount of mining and processing
waste has increased. Stone waste is generally a highly polluting waste due to both its highly alkaline nature,
and its manufacturing and processing techniques, which impose a health threat to the surroundings. In order to
utilize stone waste effectively and also find alternative for natural aggregate used in concrete is our aim to cured out the harmful effect of stone waste and it’s disposal it is necessary and also limited sources of natural
aggregates finding their alternatives is necessary because mining of natural resources in order to obtain natural
aggregates destroys natural balance and many state governments and their high-courts imposes ban on
excavation work of natural resources to obtain natural aggregates The problem of environmental pollution
caused by disposal of granite waste can be solved by using it as a partial replacement of natural aggregate and
also at same time it solves the problem of shortage of natural aggregate in construction industry. The objective
of this paper is to utilize granite waste as a partial replacement (10%, 20%, 30% & 40 %) of 20mm coarse
aggregate and test it for strength of such concrete.
Keywords
:
Granite, Aggregate, Compressive Strength,
Flexural Tensile Strength.
I. INTRODUCTION
Today industry’s disposal of stone waste is one of the environmental problems around the world. Presently in
India, about 960 million tonnes of solid waste is being generated annually as by-products during industrial,
mining, municipal, agricultural and other process out of this 350 million tonnes are organic waste from
agricultural sources; 290 million tonnes are inorganic waste of industrial and mining sectors and 4.5 million
tonnes are hazardous in nature. In India, stone dust is settled by sedimentation and then dumped away which
results in environmental pollution, in addition to forming dust into summer and threatening both agricultural and
public health. So it is necessary to use this stone waste in various industries especially the construction,
agriculture, glass and paper industries would help to protect the environment as this stone waste is used in any
manner also incorporation of this stone waste is economical also as it replaces the costly ingredients like
aggregates in concrete and comes almost free of cost In this study an effort has been made to explore the
538 | P a g e 1.1 Objective
The main objective of this study is to investigate the potential use of granite waste in concrete as replacement
for coarse aggregate and is to arrive at a suitable mix design for the application of discarded granite waste as a
partial replacement of coarse aggregate in concrete; and to test and analyze the workability, density of hardened
concrete, compressive and flexural strength, of concrete of grade M30.
II. LITERATURE SURVEY
Rania et al. (2011) studied the use of recycled marble and granite waste of different sizes in the manufacturing
of concrete bricks, with full replacement of conventional coarse and fine aggregates with marble waste scrapes
and slurry powder of content up to 40 percent by weight. Results on the physical and mechanical properties of
the bricks qualified them to be used in the building sector as non-load bearing spacing construction materials,
where all cement brick samples tested in this study complied with the Egyptian code requirement for structural
bricks.
Patel et al. (2013) investigated on design mix for M30 grade of concrete by partially replacing fine aggregate
with five different percentages by weight of powder(0%, 5%, 10%, 15%, and 20%) and he found that mean
strength of all concrete mixes with marble powder was 5-10% higher than references concrete conforming it
IS456-2000.
Roshan and kuldeep (2014) investigated on strength characteristics of concrete containing coarse aggregates
with partial replacement by marble and granite waste aggregates in three different percentage by weight of
coarse aggregates 20% (10% marble +10% granite), 30% (15% marble +15% granite), 40% (20% marble +20%
granite) and he found that Compressive strength, split-tensile strength and flexural strength are increased for
replacement of 20% and 30%.However for the 40% replacement of marble and granite waste aggregates with
coarse aggregates marginal decrease in compressive strength is recorded.
2.1 Methodology
The testing of the raw materials i.e. cement, fine aggregate(sand), coarse aggregate(10mm & 20mm) and granite
20mm aggregate as per relevant Indian Standard Codes of Practice .The physical properties of cement, sand,
coarse aggregate and granite aggregates used in this study are presented in Tables below:
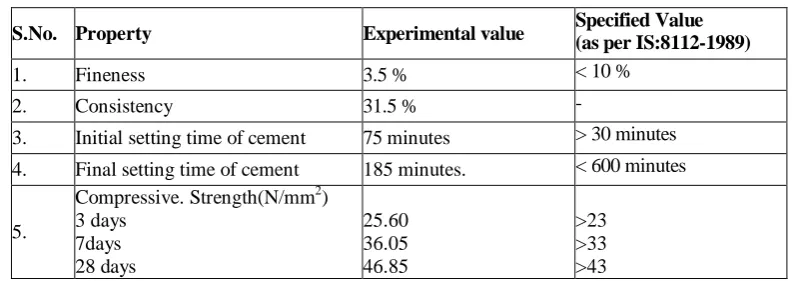
Table 1: Physical Properties of Cement.
S.No. Property Experimental value Specified Value (as per IS:8112-1989)
1. Fineness 3.5 % < 10 %
2. Consistency 31.5 % -
3. Initial setting time of cement 75 minutes > 30 minutes 4. Final setting time of cement 185 minutes. < 600 minutes
5.
Compressive. Strength(N/mm2) 3 days
7days 28 days
25.60 36.05 46.85
539 | P a g e
Table 2: Sieve Analysis of Fine Aggregates (Sand)
S.No Is Sieve
Size
Cumulative % wt. Retained
% passing
% passing as
per IS:383
Zone-II
Remarks
1 10 mm 0.00 100 100 Sum of Cumulative
% wt. retained =266.01
Fineness Modulus
(F.M.) = 266.01
/100 = 2.66
2 4.75mm 2.93 97.07 90-100
3 2.36mm 7.20 92.80 75-100
4 1.18mm 29.60 70.40 55-90
5 600µ 45.87 54.13 35-59
6 300µ 83.54 16.46 8-30
7 150µ 96.87 3.13 0-10
8 Pan 100 - -
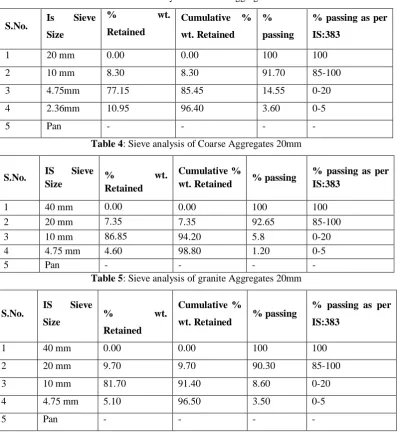
Table 3: Sieve analysis of Coarse Aggregates 10mm
S.No. Is Sieve
Size
% wt.
Retained
Cumulative %
wt. Retained
%
passing
% passing as per
IS:383
1 20 mm 0.00 0.00 100 100
2 10 mm 8.30 8.30 91.70 85-100
3 4.75mm 77.15 85.45 14.55 0-20
4 2.36mm 10.95 96.40 3.60 0-5
5 Pan - - - -
Table 4: Sieve analysis of Coarse Aggregates 20mm
S.No. IS Sieve
Size % Retained wt.
Cumulative %
wt. Retained % passing
% passing as per IS:383
1 40 mm 0.00 0.00 100 100
2 20 mm 7.35 7.35 92.65 85-100
3 10 mm 86.85 94.20 5.8 0-20
4 4.75 mm 4.60 98.80 1.20 0-5
5 Pan - - - -
Table 5: Sieve analysis of granite Aggregates 20mm
S.No. IS Sieve
Size % wt.
Retained
Cumulative %
wt. Retained % passing
% passing as per
IS:383
1 40 mm 0.00 0.00 100 100
2 20 mm 9.70 9.70 90.30 85-100
3 10 mm 81.70 91.40 8.60 0-20
4 4.75 mm 5.10 96.50 3.50 0-5
540 | P a g e
Table 6: Combined Sieve Analysis of Course Aggregate
S.No. IS Sieve
Size
% passing % of Different passing
10 mm 20 mm 10 mm
(50 %)
20 mm (50 %)
Combined (100 %)
% passing as per IS:383
1 40 mm 100 100 50.00 50.00 100 100
2 20 mm 100 92.65 50.00 46.32 96.32 95-100
3 10 mm 91.70 5.8 45.85 2.90 48.75 25-55
4 4.75 mm 14.55 1.20 7.27 0.60 7.87 0-10
5 Pan - - - -
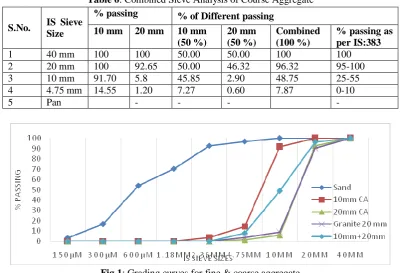
Fig 1: Grading curves for fine & coarse aggregate
Table-7: Specific gravity & water absorption of Aggregate
S.No. Material Specific Gravity Water Absorption
1 Fine aggregate(Sand) 2.57 1.10%
2 coarse aggregate (10mm) 2.70 0.60%
3 coarse aggregate (20mm) 2.64 0.41%
4 Granite 2.66 0.15%
Table 8:Detailed Mix Proportions for mix design as per IS: 10262-2009
Following tests are carried out on concrete as per their Indian Standards:
2.2 Workability
Each batch of concrete shall be tested for workability immediately after mixing as per IS: 1199–1959.
Workability is defined as the ease with which concrete can be mixed, handled, transported, placed in position and
compacted without excessive bleeding or segregation. In this study Compaction factor test was used to find out
the workability of the concrete mix.Compacting factor test is done to determine the workability of fresh concrete
as per IS: 1199–1959.The compacting factor test gives the behaviour of fresh concrete under the action of
Mix %Repla
cement
Cement (kg/m3)
Sand (kg/m3)
Coarse Aggregate( kg/m3) Water
(kg/m3)
Admixture ( kg/m3)
W/C Ratio
10mm 20mm Granite(20mm)
M0 0 373.0 679.0 593.75 593.75 0.0 164.0 4.85 0.44
M1 10 373.0 679.0 593.75 534.41 59.34 164.0 4.85 0.44
M2 20 373.0 679.0 593.75 475.0 118.75 164.0 4.85 0.44
M3 30 373.0 679.0 593.75 415.63 178.12 164.0 4.85 0.44
541 | P a g e external forces. This test is more accurate than slump test especially for concrete mixes of medium to low
workability.
In order to find compacting factor, sample of concrete is placed in the upper hopper up to the brim. The trap-door
is opened so that the concrete falls into the lower hopper. The trap-door of the lower hopper is opened and the
concrete is allowed to fall into the cylinder. The excess concrete remaining above the top level of the cylinder is
then cut off with the help of plane blades. The concrete in the cylinder is weighed. This is known as weight of
partially compacted concrete. The cylinder is filled with a fresh sample of concrete and vibrated to obtain full
compaction. The concrete in the cylinder is weighed again. This weight is known as the weight of fully
compacted concrete.
Compacting factor is calculated by the ratio of weight of partially compacted concrete to the weight of fully
compacted concrete.
Table 9:Compaction factor for Different types of workability
S.No. Degree of Workability Compaction factor
1. Low 0.85
2. Medium 0.92
3. Good workability 0.95
2.3 Density of Concrete
Density of hardened concrete is determined after 28 days of curing. In order to find density of concrete we take
out samples out of water tank and put them in oven for 24 hours at temperature 110°c after 24 hours. We take
weight of empty mould and weight of mould containing fully compacted concrete and their difference in weight
is determined. Density of concrete is calculated by the ratio of difference in weight of empty mould and weight
of mould containing fully compacted concrete to the volume of mould. Three samples of 150x150x150 mm
sizes was taken for this test.
2.4 Water Absorption Test
Water absorption of concrete specimen was determined after 28 days of curing as per IS: 1124-1974. Three
samples of 150x150x150 mm sizes was taken for this test. In order to find water absorption of concrete we take
out samples out of water tank and allowed to surface dried. When they get surface dried weight W1 is taken the
they are placed in oven for 24 hours at a temperature of 110°c and after 24 hours weight W2 is taken and then
water absorption is calculated by the formula given below.
2.5 Compressive Strength Test
Compressive strength test of concrete specimen is most widely used test to measure its compressive strength.
Two types of concrete specimens either cubes of 150 mm X 150 mm X 150 mm or 100 mm X 100 mm X 100
mm depending upon the size of aggregate are used for this purpose. In this study cubical moulds of size 15 mm
x 15mm x 15 mm are used. This test was performed as per IS: 516-1959 to find out the compressive strength of
542 | P a g e be tested at each replacement level. Concrete is poured in the mould and tempered properly so as not to have
any voids. After 24 hours these moulds are removed and test specimens are put in water for curing.
Specimens stored in water shall be tested immediately on removal from the water and while they are still in the
wet condition. Surface water and grit shall be wiped off the specimens and any projecting fins removed.
Specimens when received dry shall be kept in water for 24 hours before they are taken for testing. The
dimensions of the specimens to the nearest 0-2 mm and their weight shall be noted before testing. The load shall
be applied without shock and Increased continuously at a rate of approximately 140 kg/cm2/min until the
resistance of the specimen to the Increasing load breaks down and no greater load can be sustained. The
maximum load applied to the specimen shall then be recorded and the appearance of the concrete and any
unusual features in the type of failure shall be noted. The measured compressive strength of the specimen shall
be calculated by dividing the maximum load applied to the specimen during the test by the cross-sectional area.
Average of three values shall be taken as the representative of the batch provided the Individual variation is not
more than ± 15 percent of the average. Otherwise repeat tests shall be made.
2.6 Flexural Tensile Strength Test
Flexural strength test of concrete specimen is used to measure its tensile strength of concrete. Two types of
concrete specimens either of 150 mm X 150 mm X 700 mm or 100 mm X 100 mm X 500 mm depending upon
the size of aggregate are used for this purpose. In this study moulds of size 100 mm x 100mm x 500 mm are
used. This test was performed as per IS: 516-1959 to find out the tensile strength of concrete. At least three
specimen of 100x100x500 mm must be tested at each replacement level. Concrete is poured in the mould and
tempered properly so as not to have any voids. The load could be applied without shock and increasing
continuously at a rate such that the extreme fiber stress increases at approximately 0.7N/mm/min that was at a
rate of loading of 400kg/min for the 15.0 cm specimens and at a rate of 180kg/min for the 10.0 cm specimens.
The load was increased until the specimen fails and the maximum load applied to the specimen during the test
should be recorded. The appearance of the fractured faces of concrete and any unusual features in the type of
failure should be noted. The flexural strength of the specimen shall be expressed as the modulus of rupture and
shall be calculated by the formula given below:
Where, P = Maximum load applied on beam in Newton= Supported length of beam, B= Breadth of beam,
D= Depth of beam.
III. TEST RESULTS 3.1 Workability of Concrete
Table-10: Results of compaction factor Test
S.No. Mix
Designation % Replacement Compacting factor
1 M0 0 0.938
2 M1 10 0.940
3 M2 20 0.943
4 M3 30 0.945
543 | P a g e
0.92 0.94 0.96
M0 M1 M3 M4 M5
C
o
m
p
a
c
ti
o
n
F
a
c
to
r
Mix Designation
Figure 2: Comparison of Compaction factor for various Mix Designation
3.2 Density of Concrete
Table 11:Results of Density of ConcreteTest
S.No. Mix Designation % Replacement Density (Kg/M3)
1 M0 0 2335
2 M1 10 2348
3 M2 20 2359
4 M3 30 2375
5 M4 40 2391
2300 2350 2400
M0 M1 M2 M3 M4
D
e
n
si
ty
in
K
g/
M
3
Mix Designation
Figure 3: Comparison of Density of concrete for various Mix Designation
3.3 Water Absorption of Concrete
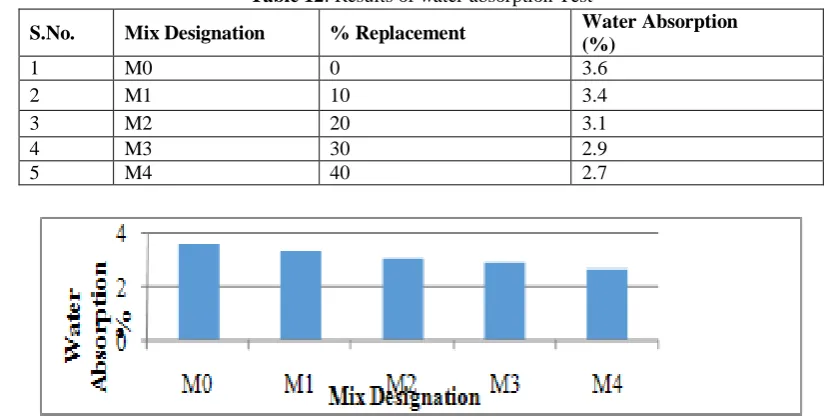
Table 12:Results of water absorption Test
S.No. Mix Designation % Replacement Water Absorption
(%)
1 M0 0 3.6
2 M1 10 3.4
3 M2 20 3.1
4 M3 30 2.9
5 M4 40 2.7
544 | P a g e 3.4 Compressive Strength
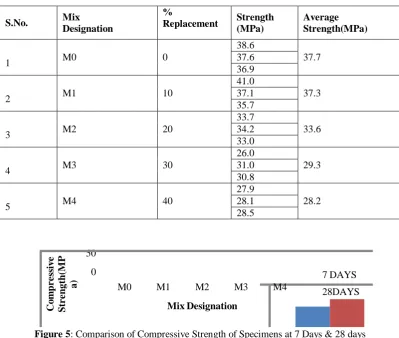
Table-13:Test Results of Compressive Strength of Specimens at 7 Days
Table-14:Test Results of Compressive Strength of Specimens at 28 Days
0 50
M0 M1 M2 M3 M4
Co m p r e ss iv e S tr e n gt h (M P a) Mix Designation 7 DAYS 28DAYS
Figure 5:Comparison of Compressive Strength of Specimens at 7 Days & 28 days
S.No. Mix Designation % Replacement Strength (MPa) Average Strength(MPa)
1 M0 0
32.2
31.7 31.5
31.4
2 M1 10
31.0
30.9 31.1
30.6
3 M2 20
27.8
28.1 28.7
27.8
4 M3 30
25.3
25.0 24.5
25.2
5 M4 40
22.2
21.3 21.1
20.5
S.No. Mix
Designation
%
Replacement Strength (MPa) Average Strength(MPa)
1 M0 0
38.6
37.7 37.6
36.9
2 M1 10
41.0
37.3 37.1
35.7
3 M2 20
33.7
33.6 34.2
33.0
4 M3 30
26.0
29.3 31.0
30.8
5 M4 40
27.9
28.2 28.1
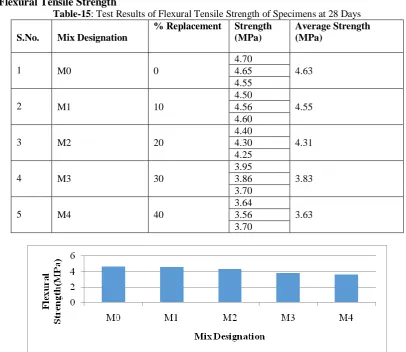
545 | P a g e 3.5 Flexural Tensile Strength
Table-15:Test Results of Flexural Tensile Strength of Specimens at 28 Days
S.No. Mix Designation
% Replacement Strength
(MPa)
Average Strength (MPa)
1 M0 0
4.70
4.63 4.65
4.55
2 M1 10
4.50
4.55 4.56
4.60
3 M2 20
4.40
4.31 4.30
4.25
4 M3 30
3.95
3.83 3.86
3.70
5 M4 40
3.64
3.63 3.56
3.70
Figure 6: Comparison of Flexural Strength of Specimens at 28 Days
IV. CONCLUSION
1. The workability of concrete is slightly increases as the percentage of granite aggregates increases due to
less water absorption of granite aggregates.
2. The density of hardened concrete is also increase proportionally to percentage of granite aggregates.
3. The water absorption decreases as granite content increases this is because as granite content increases
porosity decreases and hence absorbed water decreases.
4. The compressive strength of concrete at ages 7 and 28 days is decreasing as percentage of granite increases
this is because bond is not that much strong between the aggregates of concrete and bond failure occur and
strength decreases but decrease in strength is less at lower percentage of replacement it get significant when
replacement is up to 40%.
5. The flexural strength of specimens tested for mixes containing granite waste as replacement of 20 mm
coarse aggregate observed to be decreasing than control mixtures at all replacement level. However for the
10% replacement of granite waste aggregate with coarse aggregate a marginal decrease in flexural strength
546 | P a g e REFERENCES
[1] Rania A.Hamza, Salah El-Haggar, and safwan khedr, (2011). Marble and Granite waste characterization
and utilization in concrete bricks. International Journal of Biochemistry and Bioinformatics, Vol.1, No.4,
November 2011.
[2] Prof.Roshan Lal, Er.Kuldeep Kumar, (2014). Investigation on strength characteristics of concrete
containing recycled aggregates of Marble and granite waste. International Journal of progresses in civil
engineering (IJPCE)..
[3] V. Sai Krupa,M. K. M. V. Ratnam, V. V. S. Sarma,(2015). Study on Strength & Durability of Concrete by
Partial Replacement of Fine & Coarse Aggregates using Marble, Granite & Spent Fire Brick
Waste.International Journal of Scientific Research in Science, Engineering and Technology (ijsrset.com).
[4] Binici, H., Kaplan, H., & Yilmaz, S. Influence of marble and limestone dusts as additives on some
mechanical properties of concrete. Kahramanmaras, Turkey: Kahramanmaras Sutcu Imam University.
[5] Centre, M. M. (n.d.). Utilization of Marble Dust in Tiles. Jabalpur, M.P.: Macro Molecular Research
Centre, Rani Durgawati University.
[6] Demirel, B. (2010). The effect of the using waste granite dust as fine sand on the mechanical properties of
the concrete. International Journal of the Physical Science, Vol. 5(9).
[7] IS 10262:2009 Recommended Guidelines for concrete mix design, BIS, New Delhi.
[8] IS 456:2000 “Indian Standards Code of Practice for plain and reinforced concrete
[9] IS: 383-1970. “Gradation/Sieve Analysis of aggregate” BIS, New Delhi, 1997.
[10] IS: 4031-1988. “Method of physical tests for hydraulic cement” Bureau of Indian Standards, New Delhi,
198
[11] I.S. 2386- (Part 4) 1963, Methods of test of aggregate for concrete.
[12] I.S. 516: 1959, Methods of test for strength of concrete.
[13] Gupta, R. C., Missra, A., & Raisinghani, M. (2009). Flexural Strength and Creep Characterstics of Tiles
Containing Marble Powder. ARPN Journal of Engineering and Applied Sciences, 53-57