A c c r e tio n flow s
in c o m p a c t b in a r y s ta r s
C o e l H e llie r
M ullard Space Science Laboratory D e p a rtm en t of Physics and A s tr o n o m y
University College L ondon
A thesis su b m itted to the U niversity of London for th e degree of D octor of Philosophy
Septem ber 1989
ProQ uest N um ber: 10609790
All rights r e se r v e d
INFORMATION TO ALL USERS
The q u a lity of this r e p r o d u c tio n is d e p e n d e n t u p o n the q u a lity of the c o p y s u b m itte d .
In the unlikely e v e n t that the a u th o r did not sen d a c o m p l e t e m a n u scrip t
and there are m issing p a g e s , th e se will be n o t e d . Also, if m a teria l had to be r e m o v e d , a n o t e will in d ic a te the d e le t io n .
uest
P ro Q u est 10609790
Published by ProQ uest LLC(2017). C o p y rig h t of the Dissertation is held by the Author.
All rights r eserv ed .
This work is p r o te c te d a g a in s t u n a u th o riz ed c o p y in g under Title 17, United S ta tes C o d e M icroform Edition © ProQ uest LLC.
ProQ uest LLC.
7 8 9 East Eisenhow er Parkway P.O. Box 1346
S u m m a r y
T he thesis describes an observational stu d y of accretion flows occurring in close binary sta rs w here one b in ary com ponent is a degenerate sta r (w hite dw arf or n e u tro n s ta r). In p a rtic u la r it focuses upon the ‘interm ed iate p o la r’ sub-class in which th e com pact w hite dw arf possesses a s u b sta n tia l m agnetic field able to control th e accretion flow.
A fter an in tro d u c to ry ch apter, I rep o rt the analysis of spectroscopy of th e eclipsing in term ed iate p o lar EX Hya. To explain th e d a ta I propose a new m odel for th e optical m odulations a t th e spin period of the w hite dwarf.
T h e next c h a p te r contains the first sp ectra of EX Hya o b tain ed during one of its rare o u tb u rsts. T he analysis suggests th a t this o u tb u rst was caused by an increase in th e m ass tran sfer ra te from th e secondary sta r, ra th e r th a n by an in sta b ility in an accretion disc as in th e a lte rn a tiv e m odel for such o u tb u rsts.
I th en describe th e m ost extensive spectroscopic study of th e in te rm e d ia te p olar FO A qr to d a te . The d a ta confirm the m odel for th e spin period m odulations proposed for EX H ya, which suggests th e m odel’s applicability to th e whole in term ed iate p o lar class. T he d a ta show th a t this b in ary is also eclipsing, w hereas previously it had been th o u g h t to be at low inclination. I also rep o rt a unique ‘absorption S-wave’ feature in th e em ission lines which is blue-shifted by 200 k in s-1 from the line centers.
C o n te n ts
1 I n t r o d u c to r y 8
1.1 M ass tra n sfe r and accretion f l o w s ... 8
1.2 T he in te rm e d ia te p o l a r s ...10
1.2.1 T h e light curves and s p e c t r u m ... 11
1.2.2 T h e m agnetic field and th e accretion f l o w ... 14
1.3 Low M ass X -ray B inaries ... 16
l.A T he b in ary o r b i t ... 18
2 S p e c t r o s c o p y o f E X H y d r a e 21 2.1 I n tr o d u c tio n ...21
2.2 O bservations ...22
2.3 A n a l y s i s ... 23
2.3.1 P eriodic variation of the emission l i n e s ... 24
2.3.2 Line profile v a r i a t i o n s ...29
2.3.3 O rb ita l rad ial velocity c u r v e ...35
2.4 D is c u s s io n ... 39
2.4.1 D ouble-P eaked E m is s io n ... 40
2.4.2 T h e S - w a v e ... 42
2.4.3 67-m in pulsed emission ... 43
2.5 C o n c lu s io n s ... 45
3 E X H y d r a e in o u tb u r s t 46 3.1 I n tr o d u c tio n ... 46
3.2 O bservations ... 46
3.3 T h e visual lig h t c u r v e s ...47
3.4 P h o t o m e t r y ... 47
3.5 S p e c t r o s c o p y ... 49
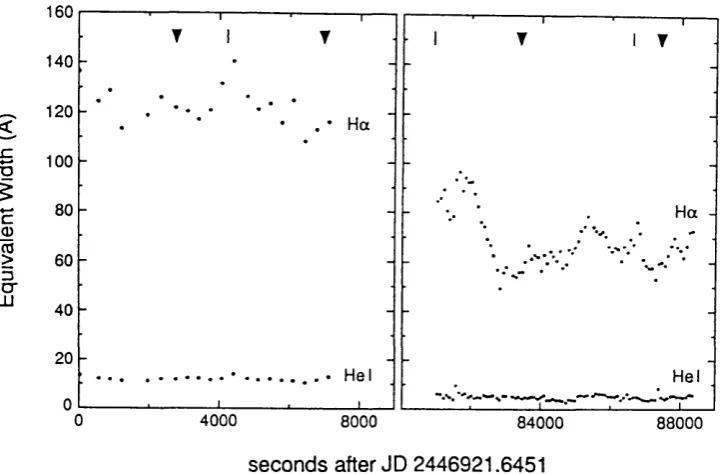
3.5.1 T im e v ariation of equivalent w idths ...50
3.5.2 T h e line profiles ... 53
3.6 D is c u s s io n ... 59
3.7 C o n c lu s io n s ...62
4
4 S p e c t r o s c o p y o f F O A q u a r ii 63
4.1 I n tr o d u c tio n ... 63
4.2 O b s e r v a t i o n s ... 64
4.3 A n a l y s is ... 64
4.3.1 Periodic variatio n of the emission l i n e s ... 64
4.3.2 O rb ital p h e n o m e n a ... 65
4.3.3 Spin period p h e n o m e n a ... 74
4.3.4 B eat period p h e n o m e n a ... 76
4.4 D is c u s s io n ... 76
4.4.1 T he e c l i p s e ... 76
4.4.2 T he orb ital v a r i a t i o n s ... 80
4.4.3 Spin b e h a v i o u r ... 85
4.4.4 T h e b e a t p e r i o d s ... 86
4.5 C o n c lu s io n s ... 88
5 E X O SA T o b s e r v a tio n s o f X 1 8 2 2 —371 90 5.1 I n tr o d u c tio n ... 90
5.2 O b s e r v a t i o n s ... 90
5.2.1 T h e light curves ... 91
5.2.2 X -ray sp ectral a n a ly s is ... 95
5.3 M odelling the light curve ... 99
5.3.1 M odelling the e c lip s e ...101
5.3.2 M odelling th e accretion disc r i m ...101
5.3.3 R esults ...102
5.4 D is c u s s io n ... 108
5.5 C o n c lu s io n s ... 113
6 O v e r v ie w 11 4
A V 4 2 6 O ph: a n in te r m e d ia t e p o la r? 118
A c k n o w le d g m e n ts 12 4
P u b lic a tio n s 125
L ist o f F ig u r e s
1.1 T ypical in te rm e d ia te p olar light c u r v e s ... 13
1.2 T he optical spectru m of BG C M i ... 14
1.3 X -ray light curve of EXO 0748-676 ... 17
2.1 Phases of EX H ya s p e c t r a ... 23
2.2 Sum m ed EX H ya s p e c t r u m ... 24
2.3 Power sp ectru m of equivalent w idths and V /R r a t i o s ... 25
2.4 Spin cycle variations of equivalent w idths ...26
2.5 O rb ital variations of emission l i n e s ...28
2.6 H/? and H7 line profiles ...30
2.7 H(3 and H7 line profiles ...31
2.8 M odulated em ission c o m p o n e n t ... 33
2.9 V /R spin variatio n s of th e H7 line w in g s ... 35
2.10 R adial velocity m e a s u r e m e n ts ...36
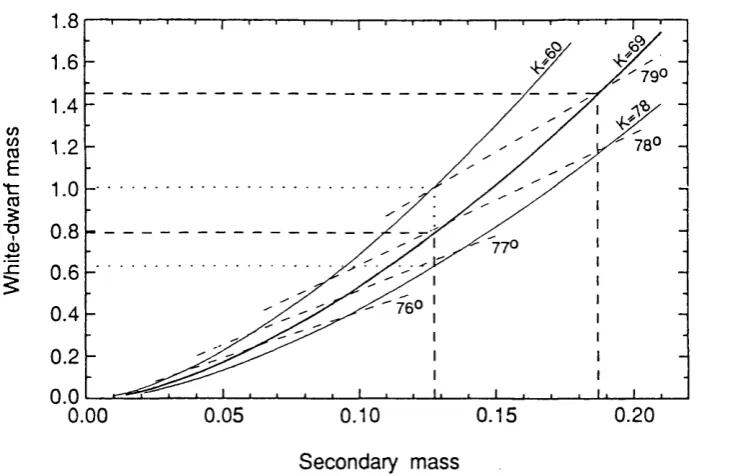
2.11 M asses of th e com ponent stars of EX H y a ...38
2.12 Schem atic scale-draw ing of EX H y a ... 41
2.13 T he H/3 V /R d a ta around e c l i p s e ...42
3.1 V isual light curves of EX H ya o u t b u r s t s ... 48
3.2 P h o to m e try of EX Hya in o u t b u r s t ... 49
3.3 Sum m ed o u tb u rst sp ectra of EX H y a ... 50
3.4 Superim posed o u tb u rst s p e c t r a ... 51
3.5 E quivalent w idths of H a and He I A 6678 l i n e s ... 52
3.6 H a profiles from the first o u tb u rs t n i g h t ... 54
3.7 H a profiles from the second o u tb u rs t night ... 55
3.8 O u tb u rst profiles of the He 1 A 6678 l i n e ...56
3.9 Greyscale plots of EX H ya o u tb u rst s p e c t r a ... 57
3.10 Schem atic p ictu re of EX H ya during o u t b u r s t ... 61
4.1 T he phase averaged sp ectrum of FO A q r ... 65
4.2 Fourier transform s of equivalent w idths and V /R ratios in F O A q r ...66
4.3 O rb ital variations of equivalent w idths and V /R r a t i o s ... 67
6
4.4 V /R d a ta for the He II A 4686 line folded on the o rb ita l c y c le ...68
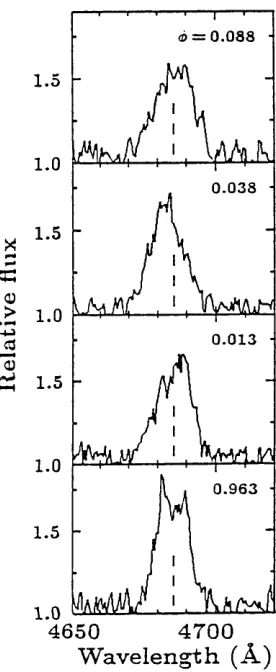
4.5 Profiles of the H e ll A4686 line around e c l i p s e ... 69
4.6 O rb ita l variations of the FO A qr line p r o f i l e s ... 71
4.7 O rb ita l phase-binned line p r o f i le s ... 72
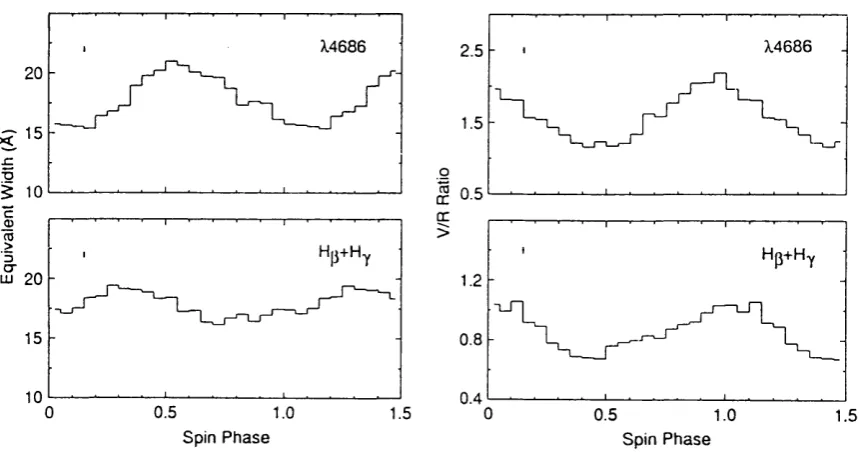
4.8 Spin period variations of equivalent w idths and V /R ratio s ... 74
4.9 Spin cycle variations of FO A qr line p r o f i le s ... 75
4.10 B eat period variations of equivalent w idths and V /R r a t i o s ... 77
4.11 B eat period variations of FO A qr line p r o f i l e s ... 78
4.12 O ptical light curves of FO A q r ... 79
4.13 Illu stra tio n of the FO Aqr s y s te m ... 84
5.1 X -ray light curves of X 1822-371 ... 91
5.2 O p tical light curve of X 1822-371 ... 92
5.3 R esiduals to th e eclipse t i m i n g s ... 95
5.4 Folded X -ray light curves of X 1822-371 ... 96
5.5 M od u latio n depths as a function of e n e r g y ... 97
5.6 X -ray sp e ctra of X 1822-371 ... 100
5.7 M odel fits to 1984 X 1822-371 d a t a ...103
5.8 M odel fits to 1985 X 1822-371 d a t a ...105
5.9 A three-dim ensional view of the X 1822-371 binary s y s te m ... 108
6.1 In te rm e d ia te polar accretion g e o m e t r y ... 115
A .l Fourier transform s of V426 Oph d a t a ...120
A.2 P h o to m e try of V426 O p h ...121
L ist o f T a b les
1.1 P ro p erties of in te rm e d ia te p o lars... 12
2.1 Spin cycle variations of EX H ya line equivalent w i d t h s ...27
2.2 EX H ya o rb ita l rad ia l velocity v a ria tio n s ... 37
2.3 O rb ita l p aram eters of EX H ya... 39
4.1 FO A qr orb ital 5-w ave p a r a m e t e r s ... 70
5.1 Eclipse tim es of X 1822-371... 94
5.2 M odulation depths as a function of e n e r g y ... 97
5.3 Spectral analysis of X 1822-371... 98
5.4 X 1822-371 m odel fittin g p a r a m e t e r s ...104
C
h a p t e r1
I n tr o d u c to r y
T his thesis is concerned w ith com pact binary stars; system s in which at least one com po nent is a degenerate object (w hite dw arf or n eu tro n s ta r) or a black hole. In p a rtic u la r I discuss the "sem i-detached’ system s in which th e second s ta r has the lower m ass (usually a red dw arf) an d is losing m a tte r to the com pact sta r. System s of this type in w hich the com pact sta r (p rim a ry ) is a w hite dw arf are know n as C ataclysm ic V ariables (C V ) while those containing n eu tro n stars or black holes are th e Low M ass X-ray B inaries (LM X B ).
1.1
M a ss tr a n s fe r a n d a c c r e tio n flo w s
The eq u ip o ten tial surfaces in a binary system are nearly spherical close to a s ta r, b u t are su bstantially d isto rte d where the g rav itatio n al a ttra c tio n s of th e two stars are com parable. T he Roche-lobe is the p a rtic u la r equipotential surface w here the d istorted spheres from each sta r first m eet as their size is increased. T he ju n ctio n , called the inner L ag ran g ian p o in t, is thus th e boundary and the lowest energy p a th betw een the regions controlled by the two stars.
If the secondary s ta r overfills its Roche-lobe th en m a tte r will transfer th ro u g h the L agrangian p o in t and eventually accrete onto th e com pact prim ary. W hen th e secondary is the lower m ass sta r, m ass-transfer will cause th e Roche-lobe of the secondary to expand away from th e s ta r, ceasing the m ass transfer. Stable m ass transfer results only if e ith e r the secondary s ta r radius is increasing (because of in te rn al evolution, for in stan ce) or if the Roche-lobe is shrinking for o th er reasons. T he evolutionary tim e-scale for a low m ass s ta r, though, is longer th a n the age of th e Galaxy. It is generally believed th a t th e m echanism responsible for m ass transfer is a loss of o rb ita l an g u lar m om en tu m from th e b in a ry system causing the sep aratio n of the stars to decrease and so shrinking their Roche-lobes.
A t long periods, > 3 hours, the angular m om entum loss is believed to be caused by the m agnetic w ind of the secondary sta r coupling w ith th e in terstellar m edium (E g g leto n 1976). This is sufficient to drive m ass transfer rates of ~ 10-9 Mq y r " 1. As th e system
In tro d u c to r y 9
evolves to sh o rte r periods, th e secondary becomes sm aller and, a t ~ 3 hours, becomes fully convective and loses its m agnetic w ind. T he secondary, which is o u t of therm al equilibrium due to the m ass tran sfer, shrinks back to equilibrium and detaches from its R oche-lobe — th u s m ass tran sfer ceases (R a p p a p o rt, V erbunt & Joss 1983; Spruit Sz
R itte r 1983). A ngular m om entum is still dissipated by g rav itatio n a l ra d ia tio n and at a period o f ~ 2 hours the Roche-lobe has shrunk sufficiently for co n tact and m ass transfer to resum e. T h e g ra v itatio n a l rad ia tio n drives a lower ra te of ~ 10_1° Mq y r - 1 . M ass transfer
continues u n til a t a period of ~ 80 m ins, th e secondary dep arts from th e rm a l equilibrium and ev en tu ally becomes degenerate and so increases in size w ith fu rth e r m ass loss. This th eory w as largely developed to explain th e highly significant deficit in accreting binaries observed w ith periods betw een 2 and 3 hours and also th e lack of CVs w ith periods below 80 m ins. T h e evolution of com pact binaries has been recently reviewed by King (1988).
In considering the fate of m ate ria l passing th ro u g h th e L agrangian p o in t, it is useful to c o n te m p la te the p o ten tia l well in to w hich it has fallen. For a com pact s ta r of m ass M
and rad iu s R , th e p o ten tia l energy lib e rate d per u n it m ass by the tim e th e m ate ria l settles o nto th e surface of the sta r is approxim ately,
E = G M / R .
For a w h ite d w arf (M ~ 1Mq , R ~ 107 m ) this is 1013 J while for a n e u tro n s ta r (M 1Mq ,
R ~ 1 0 km ) it is 1016J; this energy will m ostly resu lt in electro-m agnetic rad iatio n . If th e g ra v ita tio n a l energy were entirely lib erated rad iativ ely then th e ra d ia tio n would be ch a ra c te rise d by
hu = k T ~ G M m p/ 3 k R , w here m p = p ro to n m ass.
T his te m p e ra tu re , 50 M eV for a n e u tro n s ta r and 100 keV for a w hite dw arf, is the upper lim it to th a t a tta in a b le in an accretion shock near th e surface of th e com pact sta r. The energy m ay, however, be lib e rate d over several shocks and by viscous in te ra c tio n , yielding lower te m p e ra tu re s.
10 C ha p ter 1
th a t th e m a te ria l o rb its w ith K eplerian velocity and simplify to an axi-sym m etric two- dim ensional flow. T he classical work of Shakura k Sunyaev (1973) suggests t h a t th e scale of tu rb u le n t viscosity is bounded by th e tu rb u le n t cell size being sm aller th a n th e vertical dim ension of th e disc (H) a n d by the in teractio n speed being sm aller th a n th e sound speed (cs). T h u s, th e viscosity, v — a c sH, where a has an upper lim it of 1 and form alises the u n c e rtain ty in th e viscosity.
T he viscous in te ra c tio n results in the dissipation of kinetic energy and h e a ts th e accre tion disc to produce strong optical and UV emission. This dom inates in CV discs w hereas in LM XBs, reprocessed X -ray energy dom inates. T he spectrum of a CV accretion disc can crudely be considered as the sum of a series of black-bodies, each characterised by the local effective te m p e ra tu re , ~ 4 0 0 0 K at the o uter edge to ~ 1 0 6 K in th e in n er regions. In the m id-range, these sum approxim ately to th e power-law spectrum , Fu cx z/1/ 3. For extensive discussions of accretion discs and accretion in b inary system s see F ra n k , King
k Raine (1985) a n d Shapiro k Teukolsky (1983).
T he sim ple p ictu re o utlined above, although in itself difficult enough for presen t theory, is in practice fu rth e r com plicated. T he outer region of th e disc is struck by th e stre a m of m ate ria l e m a n a tin g from the secondary. T he observational evidence shows th a t this results in m arked d ep a rtu re s from axi-sym m etry. T he observations also q u estion th e th in disc assum ption. A fu rth e r com plication arises if the com pact sta r possesses a m agnetic field sufficient to d isru p t th e K eplerian m otion and control th e accretion flow. T his thesis is largely an observational stu d y of the ad ditional com plications focussing on, firstly, the in term ed iate p o lar system s containing a m agnetic w hite dw arf, and, secondly, th e su b class of LMXB possessing an ‘accretion disc co rona’ which provides an X -ray e m ittin g back-cloth ag ain st which th e stru c tu re of the accretion disc can be viewed. I now tu rn , therefore, to an in tro d u c tio n of these two classes of in te rac tin g binary sta rs.
1.2
T h e in t e r m e d ia t e p o la r s
In tro d u c to ry 11
‘DQ Her s ta r s ’ and ‘interm ed iate p o lars’ respectively — alth o u g h o th er auth o rs use the term s synonym ously to refer to all objects. I shall use th e te rm ‘in te rm e d ia te p o la r’ to m ean th e longer period system s w ith which this thesis is p rim a rily concerned, ignoring the sh o rter period system s except insofar as their properties overlap.
T he reason why the spin period of th e w hite d w arf is d etected in IP s, and n ot in other CVs, is believed to be th a t th e w hite dw arf is strongly m agnetic. T h e m agnetic field controls th e la te r stages of accretion onto th e w hite dw arf, channelling m ate ria l o nto the m agnetic poles. As the m agnetic axis is in general offset from th e spin axis, th e resulting asym m etry produces spin period m odulations. In th e rela te d class of m agnetic CV, the polars or AM Her stars, the m agnetic field also dom inates th e accretion flow; however in these system s the spin period is synchronised w ith th e o rb ita l p eriod resulting in only one observed periodicity and very different properties (see C ro p p er 1989 for a review of polars).
1 . 2 .1 T h e l i g h t c u r v e s a n d s p e c t r u m
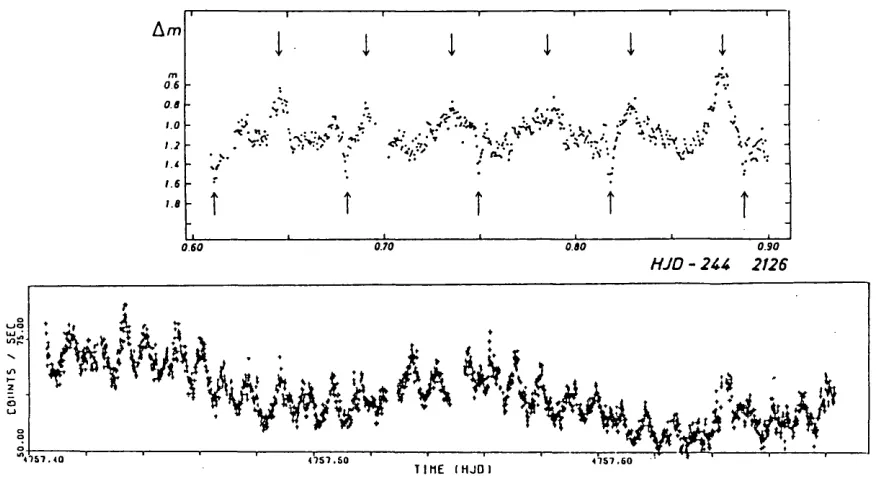
To illu stra te typical IP behaviour, I show in Fig. 1.1 sam ple lig h t curves of EX H ya and V1223 Sgr. T he o rb ita l cycle produces eclipses in a high in clin atio n system such as EX H ya, while m ore usually it is seen as a quasi-sinusoidal m o d u latio n (as in V1223 Sgr), possibly due to th e varying aspect of an X -ray heated face of th e secondary. In th e X -ray ban d the o rb ita l cycle som etim es appears as broad recurrent dips. T hese are m ost prom inent in the low energy X -ray light curves of EX Hya, where th ey precede th e narrow er X -ray eclipse. Such dips are believed to be due to photo-electric ab so rp tio n of th e cen tral X -ray flux by m ate ria l in the disc (e.g. Cordova, M ason & K ahn 1985). W here th e phasing of such dips has been determ ined, it suggests th a t the absorbing m ate ria l arises n ear th e im p act of the m ass-transfer stream w ith the disc.
P ro m in e n t in the light curves shown (Fig. 1.1) are the sh o rte r p eriod quasi-sinusoidal m odulations due to the spin cycle. In the optical b a n d the d o m in a n t v ariation m ay be at the spin period or alternatively at the beat period betw een th e o rb ita l and spin periods. T he spin period is identified from X -ray light curves w here it alw ays dom inates (although H 0542-407 also has a strong X -ray beat period m o d u latio n , T uohy etal. 1986). W hether the spin or b e a t period dom inates in the optical b an d is p ro bably re la te d to the inclination of th e system ; high inclination system s tend to show th e spin p e rio d while face on system s tend to show the beat period. T he cause of the spin period m o d u la tio n s will be extensively discussed in la te r chapters in the light of the observations p resen ted .
12 C hapter 1
Ta b l e 1.1: Properties of intermediate polars.
O bject Pspin Pother
(m ins)
P orb
(hr)
O ptical m ag.
X -ray flux /iJy 2-11 keV
D istance pc
Refs.
AE Aqr 0.55 9.88 11 0.5 60-140 1,2,3,4
V533 Her 1.06 6.7 14 < 0.0 1 1200 5,6,7
DQ Her 1.18 3.67 14 < 0.0 1 420 5,7,8,9
GK Per 5.85 47.9 10 -1 3 0 .5 -9 480 7,10,11
V1223 Sgr 12.4 13.2 3.37 13 2 600: 12,13,14,15
AO Psc 13.4 14.3 3.59 14 3 100-750 12,16,17,18
BG CMi 15.2 3.24 15 0.7 800: 19,20
SW UM at 15.9 1.36 1 2 -1 7 <0.3* 140: 7,21
FO Aqr 20.9 22.8 4.85 13 0.5 250: 3,7,15,22
T V Col 31.9 5.2hr 5.49 14 2 160-500 7,23,24,25
H 0542-407 32 35 6.2: 16 1.5 600: 26,27
V426 Oph* 60: 6.0: 1 2-13 4 100: 7,28
EX Hya 67.0 1.64 1 0-13 5 125: 3,4,29,30
KO Vel* 68.1 88.8 4.9 17 0 .2 -2 31,32
H 0 53 4-58 1t 126: 45: 6.5: 15 2 26,33
t sta tu s as in te rm e d ia te polar unconfirm ed. * detected at 0.1 p J y in 0 .5-2 keV band.
(1) Patterson 1979 (2) Patterson etal. 1980 (3) Berriman, Szkody k Capps 1985 (4) Warner 1987
(5) Cordova, Mason k Nelson 1981 (6) Robinson k Nather 1983 (7) Patterson 1984 (8) Young
k Schneider 1980 (9) Young k Schneider 1981 (10) Cordova k Mason 1984 (11) Watson, King
k Osborne 1985 (12) Penning 1985 (13) Watts etal. 1985 (14) Osborne etal. 1985 (15)
Bonnet-Bidaud, Mouchet k Motch 1982 (16) White k Marshall 1981 (17) Pietsch etal. 1987 (18) Hassall
etal. 1981 (19) McHardy etal. 1984 (20) McHardy etal. 1987 (21) Shafter, Szkody k Thorstenson
1986 (22) Cook, Watson k McHardy 1985 (23) Watts etal. 1982 (24) Schrijver, Brinkman k van
der Woerd 1987 (25) Bonnet-Bidaud, Motch k Mouchet 1985 (26) Tuohy etal. 1986 (27) Buckley
k Tuohy 1989 (28) Szkody 1986 (29) Jablonski k Busko 1985 (30) Rosen, Mason k Cordova 1988
In tro d u cto ry 13
A m
0 6
0.70 o.ao 0.90
0.60
HJD - 2 U 2126
Fi g u r e 1.1: Typical light curves of EX Hya (upper panel) and V1223 Sgr (lower
panel) displaying the twin periods characteristic of intermediate polars. From Vogt,
Krzeminski k. Sterken (1980) and Warner & Cropper (1984).
in in te rm e d ia te polars. He predicted th a t reprocessing of spin pulsed flux by stru c tu re fixed in th e o rb ita l fram e, to g eth er w ith o rb ita l period am p litude m o d u la tio n of th e spin and reprocessed m odulations, w ould produce m odulations at the 17 — 2u;, S7 — u and 17 + gj frequencies (ft = o rb ita l frequency and u = spin frequency).
On top of the periodic behaviour discussed, all IP light curves show considerable ra n dom flu ctu atio n s (flickering) on a range of tim escales. T his is often sufficient to ob literate the local o rb ita l and spin variations. T here have been no rep o rts of a quasi-periodic n a tu re to this flickering in IPs.
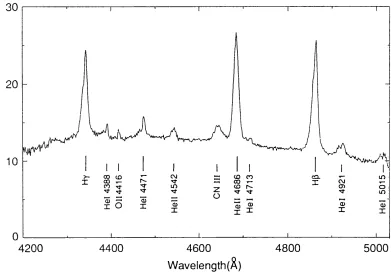
Fig. 1.2 shows the optical spectru m of BG CM i, which is ty pical of th e IP class. The hot accretion flow produces a very blue continuum to g eth er w ith stro n g doppler-broadened em ission lines. T he hydrogen B alm er series dom inates the sp ectru m while H ei and H e n lines are also visible. T he He II A 4686 line and CN III A 4640 blend is com m only very strong in m agnetic CVs and is a useful distinguishing feature. T he changes in th e em ission lines w ith th e spin, o rb ita l and b e a t cycles are the m ajo r topic of stu d y of this thesis. T he UV sp e c tra of IP s also show stro n g emission lines w ith lines due to carbon and silicon as well as those due to hydrogen and helium (e.g. V erbunt 1987).
14 C h a p ter 1
4 0 0 0 5 0 0 0 6 0 0 0 7 0 0 0
Wavelength (A)
Fi g u r e 1.2: The optical spectrum of BG CMi showing the blue continuum and strong
hydrogen and helium emission lines typical of intermediate polars.
post-shock region produces h a rd X -ray 10 keV) brem sstrahlung em ission. In IP s this radiation is usually seen th ro u g h cooler m aterial, fu rth e r o ut in the accretion flow, and so the sp ectra show s u b sta n tia l low energy ab sorption (colum ns 1022 — 1023 H a to m cm - 2 ). T his absorbative covering is p a rtia l and spin-phase dependant and so produces com plex, spin m odulated sp e ctra. For a d etailed discussion of the X -ray pro p erties of IP s, see W atson (1986), R osen, M ason & C ordova (1988) and N orton Sz W atson (1989).
1 . 2 .2 Th e m a g n e t i c f i e l d a n d t h e a c c r e t i o n f l o w
Except for the s ta r BG CM i, there is little direct evidence th a t IPs contain a m agnetic w hite dwarf. T his was first proposed, by analogy w ith the polars, as th e best e x p la n a tio n for the short perio d coherent optical m odulations. In polars th e m agnetic field is revealed by su b stan tial ( ~ 10%) circular: and linear polarization of th e optical lig h t, hence th e nam e. T his results from cyclotron ra d ia tio n e m itte d by electrons spiralling in th e m ag n e tic field. F u rther, cyclotron hum ps and Zeem an split features in th e sp ectra of polars confirm th e presence of a field, typically 10-50 M G auss (C ropper 1989).
In tro d u cto ry 15
o rb ita l periods of m agnetic CVs su p p o rts th e idea th a t IP s have field stre n g th s sim ilar to those of th e polars. P olars are strongly concentrated below th e p e rio d gap while IPs typically have longer periods above the gap. T he sum m ed d istrib u tio n of m agnetic CVs, however, is sim ilar to th a t of non-m agnetic CVs. A ssum ing th a t the tw o populations are the sam e, this suggests th a t IP s evolve in to polars (becom e synchronised) as th eir periods decrease. For a discussion of these issues see King (1986) and Lam b & M elia (1986).
In th e polars the narrow accretion stre a m e m an atin g from th e L i po in t falls on a ballistic tra je c to ry u n til th e energy density due to th e in te ra c tio n o f th e ions w ith the p rim a ry ’s m agnetic field becomes sim ilar to the m a te ria l’s kinetic energy (th e ‘threading region’) at which point the m ate ria l follows the field lines o n to th e w hite dw arf. As the spin an d o rb ita l periods are the sam e, th e only m otion w ith respect to th e binary fram e is th a t of th e accreting m aterial. Hence th e stream rem ains n arrow th ro u g h o u t.
In th e non-synchronous IP s th e stre a m approaches a m agnetic field which is r o ta t ing w ith respect to th e stream . T he n a tu re of th e accretion flow b etw een th e narrow stream phase and the m agnetically controlled final descent o n to th e w h ite dw arf depends on w h ether an interm ed iate disc stage occurs. H am eury, King & L a so ta (1986) suggested th a t if th e effective m agnetospheric radius is g reater th a n th e n a tu ra l circularization ra dius of th e stream , then no disc will form and the stream will im p a c t directly onto the m agnetosphere. T he stream will tend to break up (owing to R ayleigh-T aylor instabilities) in to large blobs which are n ot p e n e tra te d by the field and therefore continue on a ballistic (fixed in the o rb ita l fram e) tra je c to ry — perhaps as far as th e w hite d w a rf surface. T he blobs will be progressively strip p ed of m ate ria l (by K elvin-H elm holtz in sta b ilities) and the strip p ed m aterial will co -rotate w ith th e m agnetic field. T his m a te ria l m ay m im ic m any of th e observed characteristics of an accretion disc. H am eury etal. fu rth e r pointed out th a t if IP fields are sim ilar to p olar fields then this ‘discless’ accretion will occur in m ost IPs (all those w ith orb ital periods < 5 h r).
16 C h a p ter 1
radii. T hus th e stream m ay im pact on th e o u ter edge of th e ring, largely unaffected by the field, and in te ra c t to produce a K eplerian disc.
If a disc is present then the o u ter regions are likely to be sim ilar to those in non m agnetic CV. A fter tra n sitin g the disc th e accreting m ate ria l will encounter th e ‘b o u n d a ry layer’ betw een th e disc and the m agnetosphere. See Gosh & Lam b (1979) for a discussion of this complex region. Inside the m agnetosphere th e accretion flow will follow th e field lines onto the w hite dw arf, passing th ro u g h one or m ore shocks. T he details will depend on th e radial ex te n t of the in teractio n region and its distance form th e w hite dw arf, and therefore the fraction of field lines o n to which m ate ria l th read s. T his will be fu rth e r discussed la te r in th e thesis and is also considered in Rosen, M ason Sz C ordova (1988) and M ason, Rosen Sz Hellier (1988).
1.3
L ow M a s s X -r a y B in a r ie s
T he second class of in teractin g binary studied in this thesis is the Low M ass X -ray Bi naries (LM XB). These objects are m uch m ore X -ray lum inous th a n the CVs (ty p ic ally 1038 erg s 1 com pared w ith 1033 erg s *) and have higher L x / L opt ratios ( ~ 1000 com pared w ith ~ 1). T he difference is explained by the LMXB possessing a n e u tro n s ta r (or possibly a black hole) as the com pact object in stead of a less com pact w h ite dw arf. The optical light is produced p red o m in an tly by reprocessing of the intense X -ray flux in the accretion disc; this results in blue sp e c tra w ith high ex citatio n em ission lines, such as He IIA 4686, which are typically stronger th a n the Balm er lines, the reverse of th e s itu a tio n in CVs. D espite th e g reater optical lum inosity of LMXB th eir lower space d en sity places them , in general, at larger distances (typically a few K pc com pared w ith ~ 100 pc for CVs). They are therefore optically fain t (M v ~ 16 - 20) and so have been m ore intensively studied in the X -ray band where they are am ong th e b rig h te st objects in th e sky.
F u rth e r su p p o rt for th e idea th a t LM XB contain n e u tro n stars comes from th e obser vation of short d u ratio n (a few m inutes) bu rsts during which the X -ray flux m ay ty p ically double. Such events are believed to be the result of therm o-nuclear ignition o f accreted m aterial on th e n eu tro n s ta r surface. In ad d itio n , analogy can be m ade w ith th e X -ray pulsars where th e rates of change in th e period of the sh o rt period pu lsatio n s, th o u g h t to result from th e spin of th e com pact o b jec t, are incom patible w ith w hite d w a rf p rim a ries b u t consistent w ith n eu tro n stars. For reviews of LMXB see M cClintock Sz R a p p a p o rt (1985) and W h ite & M ason (1985).
In tro d u c to ry 17
C O
5 0
-C_J
1 9 8 5 FEBRUARY 15
Figure 1.3: X-ray light curve of EXO 0748-676 showing the regular eclipses and
more variable dipping behaviour. Note also the frequent sharp ‘bursts’ arising from
thermonuclear ignitions of accreted material. From Parmar etal. (1986).
th o u g h t th a t LMXB contain thick accretion discs w hich, when seen edge on, can hide the ce n tral X -ray source (M ilgrom 1978). Those LM XB which are seen a t high inclination provide direct evidence of thick discs and are th e source of m uch of ou r knowledge of disc stru c tu re . M aterial in the accretion flow m ay in terp o se in the line of sight to th e cen tral X- ray source, and p artially absorb th e X -ray flux, p roducing highly e rra tic ‘d ip p in g ’ activity. As an exam ple, I show in Fig. 1.3 an X -ray lig h t curve of th e source EX O 0748-676. Periodic, deep eclipses occur w hen the secondary blocks the X -ray flux while in addition there are rec u rre n t, shallower, highly variable dips. T h e dips are deepest a t lowest energies, confirm ing th a t they are caused by photo-electric ab sorption.
In th e dipping sources it is difficult to determ ine th e disc s tru c tu re due to th e point source n a tu re of th e X -rays. T he light curve of EX O 0748-676 show s, th o u g h , th a t not all of th e X -rays act as a po in t source. A t m id eclipse there rem ain s a residual flux of 4% of th e uneclipsed level. T his is th o u g h t to be X -rays sc a tte re d from an extended hot corona surrounding th e central n eu tro n sta r. T his ties in w ith th e ‘accretio n disc corona’ (A D C ) sources of which X 1822-371 is pro to -ty p ical. X 1822-371 is an eclipsing LMXB w ith a unusually low L x I L opt ratio ( ~20) and a sm ooth, alm ost sinusoidal X -ray light curve. Here the direct line to th e p rim ary is entirely obscured and we see only th e X-rays s c a tte re d by th e corona. T he corona acts as an exten d ed X -ray source a g a in st which the disc is p ro jected . V ariations in the disc alter th e p ro p o rtio n of th e co rona th a t is visible and so produce a sm ooth m o d u latio n of the X -ray flux — a s itu a tio n w hich provides an excellent diagnostic of accretion disc stru c tu re , exploited in C h a p te r 5.
18 C h a p ter 1
sically different from o th er LMXB (th e ir period d istrib u tio n s, for in stance, are sim ilar). T hus it is possible to co nstruct a unified m odel of LM XB in which those seen a t low incli n atio n (face on) show no o rb ita l p eriodicity while a t higher inclinations dipping a c tiv ity occurs and when edge on, an ADC source is seen. For a fuller account of X -ray o rb ita l variations in LMXB see P a rm a r &: W h ite (1988) and W h ite (1989).
A p p e n d ix
l . A
T h e b in a r y o r b it
I consider here th e situ a tio n of a higher m ass com pact s ta r (denoted by th e su b scrip t 1) and a lower m ass s ta r which fills its Roche-lobe (d enoted by the subscript 2) in o rbit around their com m on centre of m ass w ith a sep aration, a.
Spectral lines e m itte d by either s ta r will be D oppler shifted and, for a circular o rb it, undergo a sinusoidal m odulation in velocity w ith the o rb ita l period P . T h e observed am plitude of this v ariatio n , when viewed a t an in clination, z, is,
rr 27T
A i,2 = - a i i2si nt
where a ij2 denotes the s ta r ’s distance from the center of m ass. Now, K epler’s T h ird Law sta te s th a t,
G ( M X + M i ) ( 2-k\ 2
a3 V -P / ’
where M is the s ta r ’s m ass, and as,
M \ -(- M2
“ = ~ ~m2 Mu
we have,
(M2, i s i n2)3 _ P K\ t2
(M i + M2)2 ~ 2tx G '
T he q u an tity on th e right is a function of th e observables P and K only. T h e q u a n tity on the left is term ed the ‘m ass fu n ctio n ’. If b o th K \ and / i2 are m easured (see below ) th en the m ass ratio , q = M2/ M i, is know n and the individual masses are a fu n ctio n of the inclination alone. If, fu rth e r, the in clin atio n can be deduced from the light curves (eclipse profiles for instance) th en the b inary m asses and geom etry are fully d eterm in ed . T his, however, is a rare situ a tio n in the stu d y of com pact binaries.
In tro d u c to ry 19
is a fu n ctio n of th e m ass ra tio an d b inary se p ara tio n only. E ggleton (1983) approxim ates th e volum e averaged R oche-lobe radius w ith th e expression,
R 0 . 4 V / 3
L 0.6^2/ 3 + l n ( l + q2!z)
Now th e rad iu s and m ass of a s ta r are related by its in te rn al s tru c tu re . It is usually assum ed th a t th e low m ass s ta rs in com pact binaries are on the Zero Age M ain Sequence — a lth o u g h this is only for w ant of a b e tte r calib ratio n and is freq u en tly questioned. P a tte r s o n (1984) provides th e em pirical lower-ZAMS calibration,
R / R & ~ (M /A fgj) 0 '88
and hence, using the Roche geom etry,
M2/M0 = 0.380P41220, w here P4 is P / ( 4 h r).
W ith th e use of this form ula an d th e m easurem ent of either K \ or A'2, th e b inary geom etry is d e te rm in e d as a function of in clin atio n only.
In th e s itu a tio n where n e ith e r K \ or A’2 are know n it is necessary to fall back on m ore g en eral argum ents to c o n strain th e m ass of th e com pact s ta r. A w hite dw arf is lim ite d to M < 1.4Af0 (C h a n d ra se k h a r’s lim it) w hile a n eutron s ta r can be as m assive as
~ 3 Mq (depending on the e q u a tio n of s ta te ). A d d itio n al inform ation m ay be deduced from
th e D o p p ler broadening of sp e ctral lines and th e velocity am plitudes of 5 - wave features in th e sp e ctru m . By assum ing th a t th e m a tte r is in a K eplerian o rb it or in free-fall, a know ledge of th e distance of th e m ate ria l from the com pact sta r yields in fo rm atio n about th e s t a r ’s m ass and the inclination.
Me a s u r i n g Ki
T he p ro m in e n t emission lines in th e sp ectra of cataclysm ic variables arise in the accretion flow a ro u n d th e com pact s ta r. If this accretion flow is axi-sym m etric, th e n th e m ean veloc ity of th e em ission lines will equal th a t of the com pact sta r and th u s its o rb ita l variation,
20 C h apter 1
is axi-sym m etric. A com m on m eth o d is to m easure th e em ission line velocity by fittin g the profile w ith a G aussian or Lorentz function while assigning zero weight to th e cen tral regions of th e profile. A lternatively a technique suggested by Schneider & Y oung (1980) and developed by Shafter (1985) cross-correlates th e line profile w ith a tem p la te consist ing of p air of G aussians sep arated by an am ount com parable to the line w id th — th u s being sensitive only to the line wings. W ith b o th techniques m ore of the c e n tral regions of th e line are progressively excluded u n til the sta tistic a l q u ality of the result decreases unacceptably. T his ensures th a t th e m easurem ent is m ost sensitive to the highest velocity regions nearest the com pact s ta r which are m ost likely to tak e on the o rb ita l velocity of th a t sta r.
Me a s u r i n g K 2
C
h a p t e r2
S p e c tr o s c o p y o f E X H y d r a e
2 .1
I n t r o d u c t io n
EX H ydrae is an in te rm e d ia te polar with, an o rb ita l p eriod of 98 m ins and a w hite dw arf spin p erio d of 67 m ins. EX H ya is th e only known m em ber of th e class in which eclipses of X -ray em ission are observed, a factor which makes it p a rtic u la rly su itab le for studying the g eom etry of the accretion process in such a sta r. It is also th e in te rm e d ia te po lar in which the w hite dw arf ro ta tio n period and the o rbital period are m ost nearly equal and, w ith SW U M a (S hafter, Szkody & T horstensen 1986), is one of only tw o know n interm ed iate polars w ith an o rb ita l period below the 2-3 hour CV period gap.
EX H ya is a 13th m agnitude optical sta r, and an X -ray source w ith a flux of 4 fiJy in the 2-11 keV range. Its optical variability has been stu d ied recently by V ogt, Krzeminski & S te rk e n 1980, W a r n e r M c G r a w 1981, G illiland 1982, S terken etal. 1983, Cordova, M ason Sz K ahn 1985 (hereafter C M K ), and Jablonski & B usko 1985. T he X -ray emission of the s ta r has been exam ined by Kruszewski etal. 1981, CM K , B euerm ann 8z O sborne 1985, and R osen, M ason k. C ordova 1988. In b o th the op tical and X -ray bands the rad iatio n is m o d u la te d alm ost sinusoidally w ith th e 67-min w hite d w arf ro ta tio n period; th e pulse fra c tio n is 15% in the optical band, and is about 30% in th e X -ray ban d a t 1 keV, decreasing to zero above ab o u t 6 keV. The X -ray and optical m o d u latio n s are in phase. A narrow , p a rtia l eclipse of the optical and X -ray emission recurs every 98 m ins and is in te rp re te d as an o c c u ltatio n of th e w hite dw arf sta r and its environs by th e m ass-donating com panion. Jablonski & Busko (1985) found th a t the tim e of th e op tical eclipse moves back and forth depending on the phase in the 67-min cycle a t w hich it occurs. T h e full am p litude of th e v ariatio n is ~ 70 seconds, im plying th a t the center of eclipsed lig h t moves by about ± 2 x 109cm. T he eclipse is earliest at 067 = 0.75. T h e d e p th of the eclipse in the X-ray b an d depends on energy, being m ost pronounced above 3 keV (R osen, M ason & Cordova 1988). T h e lowest energy X -rays also (E < 2 keV) show a b ro ad dip every o rb ita l cycle, centered aro u n d phase 0.9 w ith respect to the n arrow eclipse (C M K ).
22 C ha p ter 2
T his ch ap ter describes tim e-resolved optical spectroscopy of EX H ya. T h e p rin c i pal optical spectroscopic features of the sta r are bro ad hydrogen em ission lines, show ing double-peaked s tru c tu re and a superim posed 5-w ave, to g eth er w ith weaker H ei an d H e n emission. S pectral studies of EX H ya have been published previously by B reysacher &: Vogt 1980 (BV); Cowley, H utchings & C ram p to n 1981 (C H C ) and G illiland 1982, b u t th e resu lts have not always been in agreem ent. G illiland confirmed B V ’s detection of equivalent w id th variations on th e 67-m in cycle although CHC saw no clear evidence for th em . G illiland gave a radial velocity half-am plitude K i = 5 8 ± 9 k m s -1 whereas BV found K j = 68 ± 9 and CHC K i = 90 ± 28. CHC saw rap id V /R line changes near eclipse b u t these w ere not confirmed by G illiland. G illiland did, however, rep o rt a v ariation on a new period of h alf the 67-min cycle. T h e present study, the m ost extensive to d ate, was u n d e rta k e n in an a tte m p t to resolve these issues and to fu rth er investigate the accretion geom etry in this object.
2.2
O b s e r v a tio n s
The d a ta were o b tain e d in the interval 1983 M arch 9th-2 2tl1 at th e S outh A frican A s tronom ical O bservatory using th e 1.9-m telescope w ith th e tw o detecto r (A ,B ) R eticon P hoton C ounting System . T he sta r was recorded in detector B while th e b ackground was m onitored w ith d e te c to r A. W avelength calibration was provided by regular exposures of C u /A r arc sp e c tra and flux calibration was obtained from sp e ctra of the sta n d a rd s ta r LTT4816 and d a ta published by Stone Sz Baldw in (1983).
A to ta l of 1083 sp e ctra were taken at a dispersion of 0.65
A
per channel; 90% were integ rated for 30 seconds, the rest in teg rated for 60 seconds. T h e useful w avelength range was 4200-5050A
an d the resolution was ~ 1A.
T he observations were m ade in relatively poor observing conditions when the prim ary program m e on fa in te r objects was n o t feasible. As a result the ab so lu te flux level in the individual sp ectra is unreliable and all sp e ctral analysis has been done relative to the continuum . In the sam e two week in te rv al during which spectroscopic observations of EX Hya were m ade w ith th e 1.9-m telescope, B -band CCD p h o to m e try of the sta r was obtained w ith the SAAO 1-m telescope. B o th EX H ya and a nearby s ta r were im aged sim ultaneously to provide accu rate relativ e m ag n itu d es for the variable desp ite th e poor conditions. By reference to th e CCD p h o to m e try , which is discussed a t g re a te r length by CM K, the m ean variation in the lines can be se p a ra te d from th a t of th e continuum .S pectroscopy o f E X H ydrae 23
0.8
0) o
>>
0 c 0.6 E
CD
1 0.4 CO CO
-C
CL
0.2
0 . 0 L
0.0 0.2 0.4 0.6 0.8 1.0
Phase on 98 min cycle
F i g u r e 2.1: Each 30-sec spectral observation of EX Hya is plotted according to its phase on the 67- and 98-min cycles. The incomplete phase-space coverage complicates
deconvolution of the orbital and spin periods.
(C M K ) shows th a t th e 67-min optical m axim a (defined as th e peak of the best fitting sinusoid) occurred 1.2 m ins (0.018 cycles) la te r th a n th e pred icted tim es. T he pulse profile in th e d a ta is asym m etric, however, so changes in th e shape of th e pulse m ay account for the discrepancy. As the long term beh av io u r of th e 98-m in o rb ita l cycle is unclear (Jablonski & Busko 1985) I have used M u m fo rd ’s (1967) linear ephem eris which p redicts eclipse tim es which are coincident w ith th e observed eclipses to w ithin the tim e resolution of the d ata.
EX H ya presents peculiar difficulties in th a t th e 67-m in period is only 2% different from tw o th ird s of the o rb ita l period while b o th periods are nearly com m ensurate w ith one day. A given phase in the 67-min cycle will recu r to w ithin 3.3% of th e sam e U .T . every 2 days, while th e 98-min cycle repeats w ith sim ilar accuracy every 3 days. This m eans th a t the 2 week observing run does not uniform ly fill th e phase space betw een these periods (see Fig. 2.1) com plicating the in te rp re ta tio n of th e d a ta . P resu m ab ly all previously published d a ta will be sim ilarly affected.
2 .3
A n a ly s is
24 C hapter 2
30
i
N
n
CMI
E £
CD CMI
O
CO CM
CD ■M" CO
CO
O (/) c 13
4 2 0 0 4 4 0 0 46 0 0 4 8 0 0 5 0 0 0
W avelength
(A)
Figure 2.2: The phase averaged spectrum of EX Hya. Owing to the poor observing
conditions the absolute flux calibration is unreliable.
He I A 4471 and He II A 4686. All the lines are broad, w ith a full-w idth a t base of order 7000 km s _1. T he B alm er and He I lines have a double peaked profile while th e He II A 4686 line is single peak ed , clearly different from th e others.
2 . 3 .1 ' P e r i o d i c v a r i a t i o n o f t h e e m i s s i o n l i n e s
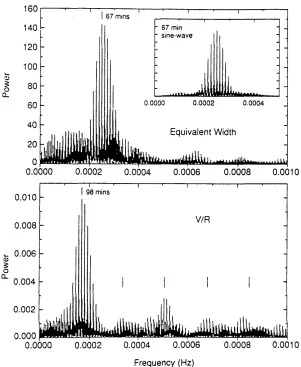
To exam ine how th e gross properties of the lines vary w ith tim e I have calculated th eir equivalent w id th a n d V /R ratio in each spectrum . Power sp ectru m analysis was used to search for periodic variability in these quantities. T he V /R ra tio was d eterm ined by dividing each line a b o u t th e centroid w avelength, calculating th e equivalent w idths of the red and violet halves separately and taking the ratio of these values.
Equivalent widths
Spectroscopy o f E X H ydrae 25
67 mins
67 mm sine-wave
0.0002 0.0004
0.0000
Equivalent Width
0.0006 0.0008 0.0010
0.0000 0.0002 0.0004
98 mins
0.010
0.008
0.006
0.004
0.002
0.000
0.0000 0.0002 0.0004 0.0006 0.0008 0.0010
Frequency (Hz)
FIGURE 2.3: Power spectrum of the equivalent widths (upper panel) and V /R data (lower panel) for the H/3 line. The window function, caused primarily by diurnal
sampling, is illustrated by the inset which shows the power spectrum of a pure sinusoid
sampled in the same way as the data. The tick marks in the V /R plot correspond to
the harmonics of the 98-min period.
26 Chapter 2 3.0
^ 2.0
a>>
12 1.0
03
HI
0.0
i — i— i— i— i— i— r i — i— i— i— i— r
B-Band
i i i i i i i i i
75 00
75 50 25 0
60 l i i i i i i i i i i i r
Hel j
15
10
5
0L_
0.0 0.5 1.0 1.5
67 Minute Phase
Fi g u r e 2.4: Equivalent widths of the spectral lines of EX Hya folded on the 67-min
cycle together with the B-band photometric data (top panel). The ephemeris used is that of Gilliland (1982); ET= 2, 437, 699.8900 + 0.046546549 E - 1.05 x 10~12E 2 (E = cycle no.).
im plying th a t th e pulse fractions of the A 4471 and A 4686 line fluxes are 0 .48± 0.05 and 0.24± 0.07 respectively.
V /R ratio
Spectroscopy o f E X Hydrae 27
Ta b l e 2.1: Equivalent width modulations with the 67-min cycle.
Line M ean Half-Am p. Pulse F ra ctio n <fimax
(A)
(A)
H 0 67.6 ± 0.4 12.2 ± 0.7 0.18 ± 0 .0 1 1.01
h7 37.0 ± 0.4 9.1 ± 0.5 0.25 ± 0 .0 1 1.00
He I 8.6 ± 0.2 3.0 ± 0.3 0.35 ± 0.04 0.99
H e ll 7.1 ± 0.3 0.6 ± 0.4 0.09 ± 0.06 1.02
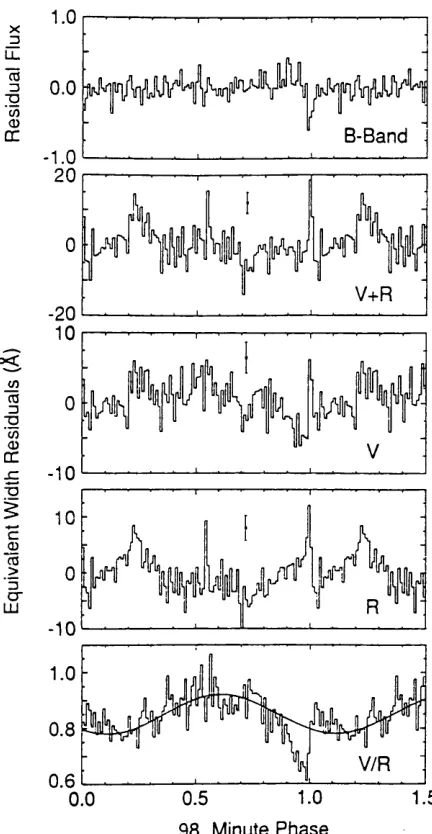
of the V and R halves separately, and th e B -band p h o to m etry , all folded on th e 98-min period. Because there is a strong m odulation of th e equivalent w id th a t th e 67-m in period, as discussed above, and because th e 67-min and 98-m in cycles are n early com m ensurate, a sinusoid w ith the p aram eters of th e 67-min cycle was s u b tra c te d from the equivalent w idth d a ta before they were folded on the 98-min period.
T h e to ta l equivalent w idth of th e line shows little m o d u la tio n w ith th e 98-m in cycle, in agreem ent w ith the results of th e power spectrum analysis (Fig. 2.3). However there is a significant sharp peak in the to ta l equivalent w id th , and also in th e equivalent w idths of the se p ara te V and R com ponents ( F ig .2.5), exactly coincident w ith th e narrow , B- b a n d -co n tin u u m eclipse a t phase 0.0. T he m ag n itu d e of th e peak in th e equivalent w idth is consistent w ith there being no narrow eclipse of th e em ission line flux.
T he folded V /R d a ta show an approxim ately sinusoidal v a ria tio n w ith th e 98-min period except for a region approxim ately a te n th of a cycle eith er side of th e B -band eclipse (phase 0.0) where significant deviations from the best fit sinusoid occur. F ittin g a sine- wave to this v ariation, excluding the eclipse region (phase 0.8 -1 .2 ), yields an am p litude of 0.07 ± 0.02 for the H/3 line and 0.04 ± 0.02 for the H7 line w ith m ean offsets of 0.85 ± 0.02 and 0.87 ± 0.02 respectively. In b o th lines the m axim um of th e sine wave occurs a t phase 0.61 dh 0.05.
28 Chapter 2
X
_D
LL.
1 0 0
C/3 <U CC B-Band 20 V+R -20 o< JO nj d ■g 'co 03 □C 10 -10 V •g £ c _03 03 > 'Z2 cr LU -10 0.8 V/R 0.6 1.0 1.5 0.5 0.0
98 Minute Phase
FIGURE 2.5: Orbital cycle variations; from top to bottom: B-band data; equivalent width of the H(3 line; equivalent width of the violet (V) side of the H/3 line; equivalent width of the red (R) side of the H/? line; V /R ratio for the H(3 line. The best fit sinusoid (Section 2.3.1) is shown superimposed on the V /R data. In all cases the 67-min variation has been subtracted out before folding on the orbital cycle. Ephemeris;
Tmin = J E D q 2 437699.94179 -f 0.068233846 E (Jablonski & Busko (1985)).
Spectroscopy o f E X H y d rae 29
eclipsing cataclysm ic binaries, e.g. DQ Her (Young & Schneider 1980; G reenstein h K raft 1959), H T Cas (Young, Schneider & Shectm an 1981) and Z C ha (M arsh , H orne &: Shipm an 1987), a n d is usually tak e n to be indicative of an accretion disc.
A n eclipse effect in th e V /R d a ta of EX H ya was also rep o rted by CH C, although in m uch sparser m easurem ents. G illiland (1982) did not in te rp re t his d a ta in this way, alth o u g h I believe his d a ta to be consistent w ith th e effect. In ste a d G illiland in terp reted th e residuals from th e m ean sinusoidal variation in V /R in term s of a n o th er periodic variatio n a t 33.6-m ins (i.e. |6 7 m ins). T he am p litu d e of th e 98-m in and the 33.6-min variations he m easured to be 0.094 and 0.052 respectively, th e eclipse effect contributing to th e a m p litu d e of th e 33.6-m in variation.
M y d a ta are m ore extensive th a n those of G illiland, and th e eclipse effect m easured cannot be fit in a satisfactory m anner by a sinusoid w ith a 33.6-m in perio d — the variation is clearly n ot sinusoidal and G illiland’s in te rp re ta tio n does n o t explain th e deficits in the individual V and R equivalent w idth plots th a t m ake up th e effect. I have nevertheless searched for o th er evidence of a 33.6-min period in m y d a ta . Such a periodicity would be obscured in th e pow er sp ectrum of all the V /R d a ta (F ig. 2.3) because it is coincident w ith a window p eak of th e m uch stronger second h arm o n ic of th e 98-m in variatio n (a consequence of th e near com m ensurability of th e 67-m in and 98-m in periods w ith one day). In ste a d I co n structed th e power spectrum of th e V /R residuals from the best fit 98-m in sine-wave, after excluding all d a ta w ithin a phase in terv al of 0.2 either side of eclipse. T h ere are no significant peaks in the resulting sp ectru m w hilst th e noise level near th e 33.6-m in period corresponds to an am p litu d e of ~ 0.01. To confirm this I folded th e residuals on the 33.6-m in period. T he best fit sine wave to th e folded d a ta had an am p litu d e of 0.011 ± 0 .0 1 7 (lcr). My results are therefore consistent w ith no m odulation a t 33.6- (^67) m ins, while a v ariation at the level rep o rted by G illiland can be excluded w ith 95% confidence.
2 . 3 . 2 Li n e p r o f i l e v a r i a t i o n s
30 Chapter 2
4910 4930 4050 4870 4890 4910
-4000
R el at iv e Li ne Fl ux R el at iv e Li ne F lu x
Spectroscopy o f E X H yd rae
1.0 0.5 0.0 1.0 0.5 0.0 1.0 0.5 0.0 1.0 0.5 0.0 1.0 0.5 0.0 1.0 0.5 0.0 1.0 0.5 0.0 1.0 0.5 0.0
Figure 2.7: Hf3 line profile changes — the same data as in Fig. 2.6 plotted to show intensity against wavelength for each phase-bin. The data have been normalized to the continuum so that zero corresponds to the continuum level and one to twice the continuum level. The upper panel shows the 67-min cycle variations and the lower panel variations on the orbital cycle.
0.825 0.625 "
0.425 ” 0.225
0.025
0.875 0 .6 7 5 "
0 .4 7 5 " 0.275
0.075 "
0.925 0 .7 2 5 "
0 .5 2 5 " 0 .3 2 5 "
0.125 "
0.975 0.775"
0.375 0 .5 7 5 ” 0.175 "
4830 4890 4830 4890 4830 4890 4830 4890 4830 4890
Wavelength (A)
0.825 0.425 ' 0.625
0.225 " 0.025
0.875 0.675 "
0.275 ”
0.075 0.475
0.125 " 0.325 0.525 0.725 0.925
0 .7 7 5 ” 0.975 0.175 " 0.375 ” 0 .5 7 5 "
4830 4890 4830 4890 4830 4890 4830 4890 4830 4890
32 Chapter 2
67-min cycle
T he grey-scale plot shows clearly th e double peaked n a tu re of th e B alm er lines, and th e m arked variatio n in th eir stre n g th as a function of 67-min phase. T he relativ e stre n g th of the violet and red peaks appears to change w ith phase. However I believe this a p p a re n t effect is caused by co n tam in atio n from the o rb ita l (98-m in) cycle 5-w ave. T he 5-w ave is b rightest and reddest a t phase </5>gs~ 0.2 w hich, as can be seen from Fig. 2.1, occurs on the 67-min cycle a t phases <f>Q7 ~ 0.2 and 0.7 in th e d a ta . These are th e 67-m in phases
where th e red peak ap p ears to be stronger th a n th e blue peak in Fig. 2.6. I have tested this conclusion q u a n tita tiv e ly by generating a p seudo-dataset in which each individual sp ectrum was replaced by the folded sp ectru m w ith the ap p ro p riate value of th e 98-min phase. T he p se u d o -d a ta were then folded on th e 67-min cycle in exactly th e sam e way as the real d a ta . T he resulting grey-scale plot showed changes in th e relativ e b rightness of the V and R peaks which were indistinguishable from those in the real d a ta . T h u s there is no evidence th a t there are large in trin sic changes in th e relative height of th e V and R peaks w ith th e 67-m in cycle, confirming th e pow er sp ectrum analysis of th e V / R ratio discussed in Section 2.3.1 (b u t see Section 2.3.2).
T he m ost strik in g aspect of the grey-scale p lo t, confirmed by the detailed line profiles in Fig. 2.7, is th e m arked variation in the w idth of th e lines w ith 67-m in phase. T his im plies th a t th e wings of th e lines are m o d u lated m ore strongly th a n the core. To verify this I have calculated th e equivalent w idths of the core and wing regions of th e lines separately. The variatio n is sinusoidal in b o th cases, b u t th e pulse fractions differ. For th e H(5 line the pulse fraction of the equivalent w idth variatio n for absolute velocities less th a n 1000 k m s-1 is 0.14 ± 0.03 w hereas for velocities g rea ter th a n 1000 k m s"1 it is 0.25 ± 0.04. For the H7 line th e values are 0.21 ± 0.03 and 0.34 ± 0.05 respectively.
Spectroscopy o f E X Hydrae 33
30
20
10
Hel
0
10 T T
U.
4200 4400 4600 4800 5000 Wavelength (A)
Figure 2.8: Modulated emission component. The upper panel shows the spectrum
averaged over the brighter half of the 67-min cycle ( 0 6 7 = 0.75-1.25) together with
the mean spectrum from the fainter half ( 0 6 7 = 0.25-0.75). The lower panel shows
the difference between the upper curves i.e. the relative flux distribution in the mod
ulated component of the emission. The raised line profiles in the lower panel show
the modulated component after correcting for the orbital 5-wave contamination (see
Section 2.3.2); for clarity these profiles are offset by 3 flux units.
effect of applying this correction to the lines. T he corrected profiles are significantly more sym m etric th a n th e original. T hus a consistent in te rp re ta tio n of th e d a ta is th a t the emission lines in EX H ya are m ade up of a steady, double-peaked com ponent together w ith a b ro ad com ponent whose flux is m o d u lated w ith the 67-m in cycle.
34 C hapter 2
th a t th e broad line em ittin g region is not point-like. This is consistent w ith th e absence of any detectable n arro w eclipse in th e lines (Section 2.3.1).
T he He I A 4471 line shows variations sim ilar to th e B alm er lines, as far as can be judged
given its m uch p o o rer sta tistic a l quality. T he He II A 4686 line shows a slight in te n sity enhancem ent a t phase ~ 0.0, in agreem ent w ith the results in Table 2.1, b u t no o ther detectable s tru c tu re or variation.
Profile variations o f the line wings
In Section 2.3.1 I exam ined the variability of th e V /R ra tio in th e lines in EX Hya. Given th a t the analysis of Section 2.3.2 indicates th a t the pulsed com ponent of th e lines dom inates a t high velocities, I have rep eated the V /R ratio analysis calculating th e ratio from th e wings of th e line only (absolute velocity > 1200 km s- 1 ) in order to have m axim um sensitivity to v ariatio n s in th e profile of th e pulsed emission. T his was done for b o th the H/3 and H7 lines, b u t the results for H/3 were not useful because of c o n ta m in a tio n of the red wing of th e line by He I A4S21.
T he power sp ectru m of V /R variations in the wings of H7 is com plicated because of the large num ber of window peaks associated w ith th e diurnal sam pling. However, it shows V /R m od u latio n in the line wings a t b o th th e 67-min and 98-m in periods. T h e 98-m in variations are such th a t th e m axim um V /R occurs a t phase 0.25, and this m o d u la tio n is, I believe, due to o rb ita l m otion of th e b in ary which is discussed m ore fully in Section 2.3.3. T he d a ta folded on th e 67-min period are shown in Fig. 2.9 and are well fit by a sinusoid w ith an am p litu d e of 0.10 ± 0.02. M axim um V /R ra tio occurs a t phase 0.04 ± 0.03, alm ost coincident w ith th e photom etric m axim um in the 67-min cycle.
Orbital (98-m in) cycle
Spectroscopy o f E X H ydrae 35
0.9
cc >
0.8
0.7 L.
0.0 0.5 1.0 1.5
67 Minute Phase
F i g u r e 2.9: V /R variations of the H7 line wings with the 67-min cycle. The mean
error is shown. Line regions with velocities greater than 1200 k m s- 1 were included.
(half o rb ita l) period reported by CMK.
T here is an enhancem ent in th e equivalent w id th of th e lines a t ex actly phase 0.0 due to th e narrow photom etric eclipse as discussed in Section 2.3.1, a lth o u g h this is not properly resolved in Figs. 2.6 &: 2.7. T he disc eclipse which causes th e ‘eclipse effect’ in the V /R d a ta is clearly seen in the grey-scale plot as a fading of th e blue wing around phase 0.93 followed by the p a rtia l o bscuration of th e red wing aro u n d phase 1.02. As is evident from Fig. 2.7b, the 5-w ave is occulted ju st a fte r th e narrow eclipse. T h e behaviour of the He I A 4471 line appears sim ilar to the B alm er lines in showing an 5-w ave. No such
v ariation is detectable in the He 11A 4686 line.
2 . 3 . 3 Or b i t a l r a d i a l v e l o c i t y c u r v e