ISSN Print: 2160-6919
DOI: 10.4236/wjcmp.2018.84011 Oct. 10, 2018 162 World Journal of Condensed Matter Physics
Model of Cubic Cell for Description of Some
Phase Transitions in Crystals
Vladimir Kh. Kozlovskiy
Scientific Society Berlin, WIGB, Berlin, Germany
Abstract
The purpose of the research is to develop a dynamical theory of phase transi-tions in crystalline structures, when except for temperature, the pressure is acting. So, the phase diagram temperature-pressure (dimensions) must be constructed. In general case, it is a complicated question, which can be solved for simple models of crystal, as three atomic models, introduced in the work of Frenkel [1]. In this model, three identical atoms are placed on the straight line and interact with the forces, which can be described by the expression, given in the article of Lennard-Jones [2]. Such simple model may have suc-cess, when the crystalline structure is simple, which consists of one type of atoms, for example: carbon. The model was generalized to cubic cell model with a moving atom in the inner part of the cell. The rigorous calculation of phase diagram for transition graphite-diamond shows some similarity with results of numerous experimental investigations (which are not discussed here). So, the way of phase diagram calculation may attract attention.
Keywords
Cubic Cell, Phase Transitions, Influence of Temperature, Influence of Pressure
1. Introduction
As was mentioned in the work of Max Born, the linear or harmonic theory of crystalline lattice is insufficient to describe some properties of solid corps: struc-tural transitions, flow, mechanical strength [3]. In order to develop the theory of these properties, introduction of anharmonic forces is necessary. The virial theorem, proved by Clausius, was used for investigation of transition in solid corps. But this theorem is insufficient for description of solid corps and behavior of atoms and must be generalized to receive more equations determining the
How to cite this paper: Kozlovskiy, V.Kh. (2018) Model of Cubic Cell for Description of Some Phase Transitions in Crystals. World Journal of Condensed Matter Phys-ics, 8, 162-170.
https://doi.org/10.4236/wjcmp.2018.84011
Received: August 1, 2018 Accepted: October 7, 2018 Published: October 10, 2018 Copyright © 2018 by author and Scientific Research Publishing Inc. This work is licensed under the Creative Commons Attribution International License (CC BY 4.0).
DOI: 10.4236/wjcmp.2018.84011 163 World Journal of Condensed Matter Physics
atomic positions and parameters of atoms moving. This theorem was also proved in the work [4], where authors used mechanical variation principle, in-troducing one variation number. Inin-troducing more variation numbers and mi-nimizing mechanical action respective all variation numbers, gives possibility to receive a system of equations (“theorem”), which describe the behavior of atoms with sufficient accuracy. This procedure of calculation is presented in article [5]. For considering the action of high pressure (or interatomic distance) on phase transitions, Frenkel elaborated a three-atomic model, built from three identical atoms, placed on a straight line. The forces, connecting the atoms, may be con-sidered as described by expression given in the work of Lennard-Jones. The model of Frenkel may be generalized and transformed into a cubic model, where the summits occupy immovable atoms and the atom in the inner part of the cube can occupy the centre of cube or the centre of the facet. In the first case, the cubic structure is represented, and in the second, it is flaky. At high enough temperature, an amorphous structure can arise, but for determining the place of this structure on the diagram, additions in expression of energy must be intro-duced. The calculated diagram can be compared with results, gained in numer-ous experimental investigations (which are not considered) of the transition among graphite, diamond and liquid phase of carbon. Some similarity between calculated phase diagram and constructed on the basis of experimental results can be marked, so theoretical model can be useful in research about this subject. The model of Frenkel was used in some works for examination of the phase transitions
[6] [7] [8]. The present article is established on these works and is the most perfect.
2. The Cubic Cell Model
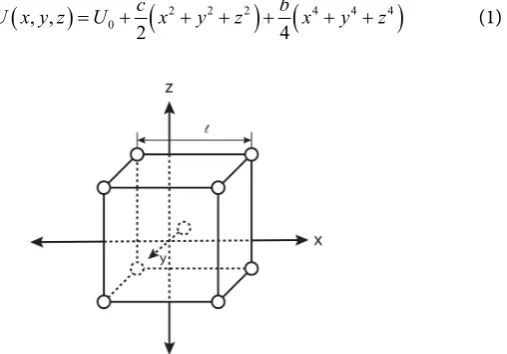
In Figure 1 a cubic cell model with immobile atoms in the summits and mobile atom in the inner part of the cell is shown. The origin is placed in the centre of the cell, and the coordinate axis x, y, z are directed normal to the facets. The po-tential energy of moving atom in the inner part of the cell is represented by means of fourth power polynom of coordinates
(
)
(
2 2 2) (
4 4 4)
0 , ,
2 4
c b
[image:2.595.287.541.525.702.2]U x y z =U + x +y +z + x +y +z (1)
DOI: 10.4236/wjcmp.2018.84011 164 World Journal of Condensed Matter Physics
with the cell edge length l. The form of potential energy is reproduced in neigh-boring cells, so in two points on the x-axis, symmetrical placed relative to the facet, the energy has the same value, so according to Roll theorem the derivative of the energy on the facet must be zero
2 2 0 2 4 l x
U l c bl
x = ∂ = + = ∂
(2)
So
2 4c b
l
= − (3)
Now we mark the values of potential energies in the centre of the cell UC and in the centre of facet UF. They have values
0
C
U =U (4)
2 2
0 8 8
F l bl
U =U + c+
(5)
So it will be gained
(
)
2 16
F C
c U U
l
= − (6)
(
)
4 64
F C
b U U
l
= − − (7)
The dependence of the coefficients c, b from the cell dimensions is determined from the dependence of the Lennard-Jons potential from the distance between atoms. Taking into account only the nearest neighbors in the cell, it can be writ-ten
8
3 3
2 2
C m n
A B U l l = − + (8) 4 2 2 2 2
F m n
A B U l l = − + (9)
where, as it will be accepted, n = 2 m. From theses expressions it can be found
(
)
2 2 2 21 2 1 2 2 2 1 2 2
4 3 3
m m n n
F C m n
U U A B
l l − = − − + − (10)
DOI: 10.4236/wjcmp.2018.84011 165 World Journal of Condensed Matter Physics
anharmonic coefficients turns to zero, and the movement of the atom occurs unhampered (this question will be considered later). It can be put approximately
( )
d *(
*)
dc
c l l l
l
= − +
(11)
where the derivative here is negative. Further we consider the movement only along x-axis, because movements along all axes are identical. Taking into ac-count (1) and (3) we write the expression of atom energy in the form
2 4
0 2 2
c c
U U x x
l
= + − (12)
If the thermal movement is absent, the coordinate is not changed with the time and determined through the external influence. The condition of equili-brium
3 2
4 0
U cx cx
x l
∂ = − =
∂ (13)
leads to the values of coordinate
0
x= and 2 2 4 l
x = (14)
and these values correspond to the position in the centre of cell (cubic structure) and centre of facet (layered structure). The conditions of stability
2
2
2 2
12 0
U c cx
x l
∂ = − >
∂ (15)
for the position in the centre of the cell leads to inequality c > 0, and for the po-sition in the centre of facet to the inequality c < 0. We consider now the question in general case, when the change in structure occurs through the action of ther-mal motion and mechanical action. Then in expression (1) the coordinate as a function of time t is represented in the form
( )
x s u t= +
θ
(16)where vibrations are described by means of simple function of time.
After the elevation of the coordinate in proper power and taking the mean time value the free energy is transformed to the form
(
2 2)
(
4 2 2 4 4)
40 2c 4b 6 ln , 3
F U= + s +u + s + s u +θ u −kT u θ = (17)
The general equations of state are
3 3 2 0
F cs bs bsu s
∂
= + + =
∂ (18)
2 3
3 3 0
F cu bs u bu kT
u u
∂
= + + − =
∂ (19)
The general conditions of stability
2
2 2
2
) F c bs bu3 3 0
s
α ∂ = + + >
DOI: 10.4236/wjcmp.2018.84011 166 World Journal of Condensed Matter Physics
2
2 2
2 2
) F c 3bs 9bu kT 0
u u
β ∂ = + + + >
∂ (21)
(
)
(
)
2
2 2 2
2
2 2 2 2
2 2 2
) F F F c 3bs 3bu c 3bs 9bu kT 6bsu 0
s u
s u u
γ ∂ ∂ −∂ = + + + + + − >
∂ ∂
∂ ∂ (22)
From equation (18), equation (19) follows two expressions, describing the states conditionally called symmetrical (s=0) and nonsymmetrical (s≠0). Taking the amplitude as independent variable, one can write the expressions of displacement and temperature
2 4
0, 3
s= kT cu= + bu (23)
2 3 2, 2 2 6 4
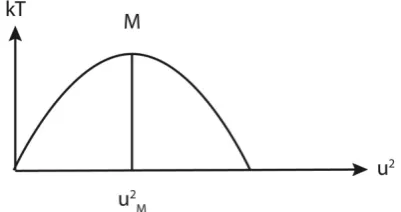
bs = − −c bu kT = − cu − bu (24) In Figure 2 and Figure 3 are shown the dependencies of temperatures from amplitude for both structures.
The coordinates of maximum in Figure 2 are the following (c > 0, b < 0)
2 2 2
2 ;
6 24 12 48
M c l M c сl
u kT
b b
= − = = − = (25)
The conditions of stability (20) and (21) are formulated as
2 ; 2
3 6
c c
u u
b b
< − < − (26)
[image:5.595.263.476.455.560.2]From these inequalities essential is the second that marks the part of the curve to the left side of maximum as stable one and the inequality (22) is a conse-quence of precedents. The coordinates of maximum in Figure 3 are the follow-ing (c < 0, b > 0)
Figure 2. The dependence of temperature from amplitude for symmetrical structure.
[image:5.595.273.474.598.704.2]DOI: 10.4236/wjcmp.2018.84011 167 World Journal of Condensed Matter Physics
2 2 2 2
2 ; ; 2
6 24 6 24 2 8
M c l M c сl M c l
u kT s
b b b
= − = = = − = − = (27)
Excluding the displacement and reducing we receive the conditions of stability for non symmetrical structure in the form
2
3 0
c bu
− − > (28)
2
2c 3bu 0
− − > (29)
(
− −c 3bu2)(
− −c 6bu2)
>0 (30)So the inequality shown in formula (31) 2
6 c u
b
< − (31)
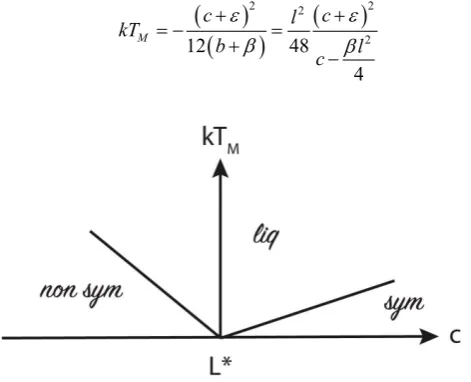
denotes the stable part of the curve. It is possible to express the temperature of maximum TM through cell dimension l, which is affected to the action of pressure. This temperature is the highest temperature, which can exist in consi-dered structure without transition in the other state (it is possible a transition in the liquid state). In Figure 4, the graph of functions describing transitions for symmetrical and non symmetrical structures is shown (phase diagram).
According to diagram it can be concluded that when c is zero the liquid state exists at zero temperature. But such result is a consequence of simplifications in choice of model, where some potential barriers are not taken into account, but can be caused by defects of the structure. Their presence may be taken into ac-count phenomenological through introducing additional terms in the energy and instead of (12) now will be written more general expression
2 4
* c2 b4 , 0, 0
U U= + +εx + +β x ε> β< (32)
without any relation between new constants
ε β
, . The following calculations will be the same, and for temperature of transition may be taken the expression (25), where for symmetrical state c > 0(
)
(
)
(
)
2 2 2
2
12 48
4
M
c l c
kT
b c l
ε ε
β β
+ +
= − =
[image:6.595.255.491.516.707.2]+ − (33)
DOI: 10.4236/wjcmp.2018.84011 168 World Journal of Condensed Matter Physics
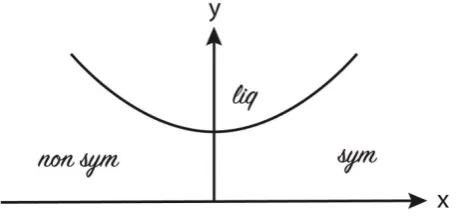
The dependence of kTM from c is reproduced by means of mathematical function y(x) of the form
(
)
2, 0, 0
x p
y p q
x q
+
= > >
+ (34)
graph of which is shown in Figure 5. The value in the origin is non zero but p2 q and may be equal to the corresponding value for non symmetric state through the choice of new constants. For non symmetrical state (c < 0) according to (27), we receive (new constants may have now opposite sign)
(
)
(
)
(
)
2 2 2
2
6 24
4
M
c l c
kT
b c l
ε ε
β β
+ − −
= =
+ − + (35)
[image:7.595.260.489.447.555.2]Very schematic diagram with marked regions of diamond, graphite and liquid carbon existence is represented in Figure 6. This diagram is received on the base of experimental synthesis of diamond from graphite, and some resemblance with calculated one may be marked [9]-[22]. It is essential, that the line of transition diamond-graphite is not a vertical line perpendicular to the line of pressure, but is banded to the line of pressure and shows conjointly increase of temperature and pressure. Such behavior is characteristic for melting phenomenon and has its reason in increase of barrier heights for jump of an atom through the interval between the neighbors. Graphite in relation to diamond behaves like a liquid and for such behavior are reasons. The density of graphite is less, than the den-sity of diamond, the carbon nets in graphite are far removed one from another,
[image:7.595.260.483.595.702.2]Figure 5. Mathematical graph of phase line.
DOI: 10.4236/wjcmp.2018.84011 169 World Journal of Condensed Matter Physics
their mutual interaction is week, so they glide relative one another like mole-cules. But graphite in relation to liquid carbon behaves like a crystalline corps, which temperature of melting falls with increase of pressure. Graphite is a soft material and may be changed under the action of pressure. It exist an explora-tion, where graphite was exposed to γ radiation before utilization for diamond synthesis [23]. His structure was changed and the quantity of diamond dimi-nished. It can be marked, that in article [24] the line of equilibrium between two solid phases is shown as nearly normal to the line of pressure.
3. Concluding Remarks
The result of calculations on the basis of dynamical theory of phase transitions is the phase diagram temperature-pressure (or cell dimensions) for elaborated here cubic model of Frenkel. Comparison with diagrams, constructed on the basis of numerous experimental investigations of phase transition graphite-diamond shows some resemblance between calculated and experimental diagrams. So, the model of Frenkel can serve not only as illustration possibility of phase transi-tions, but can be used in researches. It can be supposed that a combination of such models in linear chain can give possibility to come near to such phenome-non as rupture and some other anharmonic effects.
Conflicts of Interest
The author declares no conflicts of interest regarding the publication of this pa-per.
References
[1] Frenkel, J. (1935) The Liquid State and the Theory of Fusion. Acta Physicochimica URSS, 3, 633-648.
[2] Jones, J.E. and Ingham, A.G. (1925) On the Calculation of Certain Crystal Potential Constants, and of a Cubic Crystal of Least Potential Energy. Proceedings of the Royal Society of London A,107, 636-653. https://doi.org/10.1098/rspa.1925.0047 [3] Born, M. (1951) The Limit of Ideal Crystal Theory Applicability and Their
Over-coming. Ceremonial Assay to the Celebration of Two Hundred Years Creation Academy of Sciences in Goettingen, Springer Publishing, Berlin.
[4] Fock, V. and Krutkow, G. (1932) Remarks to the Virial Theorem of Classical Me-chanic. Physical Magazine of USSR, 1, 756-758.
[5] Kozlovskiy, V.Ch. (1991) Dynamical Equations for Time-Averaged Coordinates at Thermal Equilibrium. Soviet Physics Journal, 34, 353-359.
https://doi.org/10.1007/BF00898103
[6] Kozlovskiy, V.Ch. (1969) Phase Diagram Length-Temperature for Three Atomic Model of a Crystal. Mechanism and Kinetic of Crystallization. Science and Technic, Minsk, 154-163.
DOI: 10.4236/wjcmp.2018.84011 170 World Journal of Condensed Matter Physics [8] Kozlovskiy, V.Ch. (2003) Vibration-Diffusion Model of Melting. Transactions of VI International Conference “Crystals: Growth, Properties, Real Structure, Applica-tions”, 579-594.
[9] Leipunskij, O.I. (1939) About Imitation of Diamonds. Progress in Chemistry, 8, 1519-1531.
[10] Sobolew, W.S. (1960) Condition of Diamonds Layer Formation. Vol. 1, Institute of Geology and Geophysics, Siberia Department of Science Academy USSR, 7-22. [11] Bundy, F.P., Bovenkerk, H.F., Strong, H.M. and Wentorf, R.H. (1961)
Di-amond-Graphite Equilibrium Line from Growth and Graphitization of Diamond. The Journal of Chemical Physics, 35, 383-391. https://doi.org/10.1063/1.1731938 [12] Bundy, F.P. (1962) Melting Point of Graphite at High Pressure. Heat of Fusion.
Science,137, 1055-1057. https://doi.org/10.1126/science.137.3535.1055
[13] Bundy, F.P. (1962) Direct Conversion of Graphite to Diamond in Static Pressure Apparatus. Science,137, 1057-1058. https://doi.org/10.1126/science.137.3535.1057 [14] Bundy, F.P. (1963) Melting of Graphite at Very High Pressure. Journal of Chemical
Physics,38, 618-630. https://doi.org/10.1063/1.1733715
[15] Bundy, F.P. (1963) Direct Conversion of Graphite to Diamond in Static Pressure Apparatus. Journal of Chemical Physics,38, 631-643.
https://doi.org/10.1063/1.1733716
[16] Wasiliew, W.G., Kowaljskij, W.W. and Tcherskij, N.W. (1961) Problem of Di-amond Origin. Yakut Publishing House, Yakutsk.
[17] Wereshtshagin, L.F. and Fateewa, N.S. (1971) To the Question about the Curve of Graphite to 90 kbar Melting. Lettersw to the Journal of Experimental and Theoreti-cal Physics,13, 157-159.
[18] Tonkow, E.J. (1979) Phase Diagrams of Elements at High Pressure. 38-41.
[19] Nowikow, N.W., Fedoseew, D.W., Shulgenko, A.A. and Bogatirewa, G.P. (1987) Synthesis of Diamond. Scientific Meditations, Kiev, 10-32.
[20] Andreew, B.D. and Malik, W.R. (1985) Method of Calculation Thermodynamically Functions and Graphite-Diamond Equilibrium Curve in Wide Range of Tempera-tures. Influence of High Pressure on Structure and Properties Super Hard Materials. Collection of Scientific Works. Kiev, 12-19.
[21] Digonskiy, W.W. and Digonskiy, S.W. (1992) Regularities of Diamond Formation. Sankt-Peterburg. “Entrails”.
[22] Sawwatimskiy, A.I. (2003) Melting of Graphite and Liquid Carbon. Successes in Physics Sciences,173, 1372-1379.
[23] Dutow, A.G., Asarko, I.I., Koslova, E.I., Komar, W.A., Kurilowitsh, N.F., Shipilo, W.B. and Shipilo, N.W. (2006) Spontaneous Synthesis of Diamond Crystals from Graphite Irradiated by Means of γ-Quants. Crystallography,51, 130-135.