Final Report
National Strawberry Varietal Improvement
Program
Project leader: Mark Herrington
Delivery partner:
Queensland Department of Agriculture and Fisheries
Project:
National Strawberry Varietal Improvement Program – BS12021
Disclaimer:
Horticulture Innovation Australia Limited (Hort Innovation) makes no representations and expressly disclaims all warranties (to the extent permitted by law) about the accuracy, completeness, or currency of information in this Final Report.
Users of this Final Report should take independent action to confirm any information in this Final Report before relying on that information in any way.
Reliance on any information provided by Hort Innovation is entirely at your own risk. Hort Innovation is not responsible for, and will not be liable for, any loss, damage, claim, expense, cost (including legal costs) or other liability arising in any way (including from Hort Innovation or any other person’s negligence or otherwise) from your use or non‐use of the Final Report or from reliance on information contained in the Final Report or that Hort Innovation provides to you by any other means.
Funding statement:
This project has been funded by Hort Innovation, using the strawberry research and development levy and contributions from the Australian Government. Hort Innovation is the grower‐owned, not‐for‐profit research and development corporation for Australian horticulture.
Publishing details: ISBN 978 0 7341 4441 6
Published and distributed by: Hort Innovation
Level 8
1 Chifley Square Sydney NSW 2000
Telephone: (02) 8295 2300
www.horticulture.com.au
Hort Innovation – Final Report: National Strawberry Varietal Improvement Program
3
Content
Summary 6
Keywords 7
1. Introduction 8
2. Subtropical trials and selection 9
2.1. Introduction 9
2.2. Methods 9
2.3. Results and discussion 13
2.4. Conclusions 16
2.5. References 16
3. Temperate trials and selection 17
3.1. Introduction 17
3.2. Methods 17
3.3. Results and discussion 20
3.4. Conclusions 22
3.5. References 22
4. Mediterranean trials and selection 23
4.1. Introduction 23
4.2. Methods 23
4.3. Results and discussion 24
4.4. References 24
5. Screening for resistance to Colletotrichum gloeosporioides 25
5.1. Introduction 25
5.2. Methods 25
5.3. Results 29
5.4. Discussion 32
5.5. References 33
6. Genetic variation in Fusarium oxysporum f. sp. fragariae 35
6.1. Introduction 35
6.2. Methods 36
6.3. Results and discussion 38
6.4. Summary 40
6.5. Recommendations 40
6.6. Refereed scientific publications 40
6.7. References 40
7. Cultivar responses to Fusarium oxysporum f. sp. fragariae 42
7.1. Introduction 42
7.2. Methods 42
7.3. Results and discussion 42
4
7.5. Recommendations 44
7.6. Refereed scientific publications 45
8. Screening for Fusarium wilt resistance 46
8.1. Introduction 46
8.2. Methods 46
8.3. Results 48
8.4. Discussion 53
8.5. Refereed scientific publications 53
8.6. References 53
9. A review and evaluation of methods to screen strawberry plants against charcoal rot 54
9.1. Introduction 54
9.2. Review of M. phaseolina inoculum production and inoculation methods in strawberry 56
9.3. Methods 57
9.4. Results 58
9.5. Discussion 60
9.6. Conclusions 60
9.7. References 61
10. Response of strawberry genotypes inoculated with Macrophomina phaseolina 63
10.1. Introduction 63
10.2. Methods 63
10.3. Results 66
10.4. Discussion 75
10.5. Conclusions 76
10.6. References 76
11. Evaluating pathogenicity of Macrophomina phaseolina isolates against strawberry 77
11.1. Introduction 77
11.2. Methods 77
11.3. Results 79
11.4. Discussion 81
11.5. Conclusions 82
11.6. References 82
12. Container experiment for seed germination in-vitro 83
12.1. Introduction 83
12.2. Methods 84
12.3. Results and discussion 85
12.4. Summary 86
12.5. Recommendations 87
13. Outputs 88
13.1. Commercialised varieties 88
13.2. Peer reviewed scientific publications 88
Hort Innovation – Final Report: National Strawberry Varietal Improvement Program
5
13.4. Industry publications 89
13.5. On-line survey 89
13.6. Presentations 89
13.7. Breeding program field days and site tours 90
13.8. Media coverage 90
14. Outcomes 92
15. Monitoring and evaluation 93
16. Recommendations 94
16.1. Increase market size and value 94
16.2. Focus for export 94
16.3. Focus for higher value product type 94
16.4. Develop variety benchmarking data 94
16.5. Increase focus on substrate culture 94
16.6. Expand disease resistance focus 95
16.7. Incorporate DNA based selection into the breeding program 95
16.8. Increase industry and consumer involvement 95
16.9. Investigate a permanent temperate trial site 95
16.10.Expand international seed exchange and linkages 96
17. Refereed scientific publications 97
18. Intellectual property, commercialisation and confidentiality 98
Acknowledgements 99
Appendix 1 100
6
Summary
The Australian strawberry industry has an estimated farm gate value of $420 million, with approximately 200 commercial producers and 60 opportunistic producers (Hort Innovation, 2017). For the national industry to remain profitable the ongoing development and availability of improved strawberry varieties is required. Opportunities exist for locally adapted varieties with superior production and consumer traits.
This project (BS12021) was initially established in 2013 to develop and commercially release superior strawberry varieties adapted for production in subtropical climatic regions in Australia. In 2015 the scope of the project was expanded to additionally include the development of improved strawberry varieties for Australian temperate and Mediterranean production regions. As part of this expansion we began management of the existing Victorian Strawberry Breeding Program at this time. Individual breeding targets for each production region were defined in consultation with local industry in each area with an overall goal of supporting a sustainable and profitable national strawberry industry. Traits included, among other targets, developing varieties with improved resistance to the crown wilt diseases Macrophomina phaseolina (charcoal rot), Colletotrichum gloeosporioides and Fusarium
oxysporum f. sp. fragariae. The general breeding strategy built upon the successful pipeline developed in the
previous iteration of the project (BS09013) and was further enhanced by the incorporation of quantitative genetic analysis and economic modelling of fruit and plant traits to guide crossing and selection decisions.
The project developed and positioned for commercialisation 12 new strawberry varieties, locally adapted to Australia’s growing regions and satisfying Australian consumer expectations. These included six varieties targeted for subtropical production: ‘Red Rhapsody’, ‘Parisienne Kiss’, ‘Sundrench’, ‘Scarlet Rose-ASBP’, ‘Sunglow ASBP’, ‘Meadowsong’, and ‘Venus-ASBP’; two varieties targeted for temperate production: ‘Summer Song’, and ‘Scarlet-silk’; and three varieties targeted for Mediterranean production: ‘Rosalie-ASBP’, ‘Jubilee-ASBP’, and ‘Fanfare-ASBP’. Sixteen peer reviewed journal articles were published, along with four conference posters and eight publications in the national strawberry industry magazine Simply Red. Eighteen presentations were delivered at conferences, industry meetings and field days, and four breeding trial tours given. The project was also covered extensively in the media following the official release and outstanding success of its variety ‘Red Rhapsody’.
In 2017, varieties from the Australian Strawberry Breeding Program (ASBP) captured 44% of the subtropical market, and 19% of the national market. These plantings had a farm gate value of approximately $78 million and contributed ~2700 jobs in production. Indications from runner growers suggest that 2018 sales of ASBP varieties will be substantially higher than 2017 levels.
Hort Innovation – Final Report: National Strawberry Varietal Improvement Program
7
Keywords
8
1.
Introduction
The Australian strawberry industry has an estimated farm gate value of $420 million, with approximately 200 commercial producers and 60 opportunistic producers (Strawberry Strategic Investment Plan 2017-2021). For the national industry to remain profitable the ongoing development and availability of improved strawberry varieties is required. This feeds into Outcome 3 in the Strawberry Strategic Investment Plan 2017-2021, of increased farm productivity (marketable yield per hectare) by an average of 10 per cent by 2021. New varieties need to be locally adapted to each of Australia’s growing regions and satisfy Australian consumer expectations. Furthermore, these need to be developed through a pipeline that can adapt to changing market and environmental demands.
Under project BS12021, the Australian Strawberry Breeding Program (ASBP) aimed to develop and commercially release superior strawberry varieties adapted for production in temperate, subtropical and Mediterranean climatic regions in Australia. Initially instigated as a breeding program for the subtropical production region only, a
variation to project BS12021 was implemented in December 2014. This variation aligned the existing Southern (temperate) Strawberries Australia Inc. and Hort Innovation breeding program with the subtropical program managed by the Queensland Department of Agriculture and Fisheries. At this time some breeding additionally commenced targeting the Mediterranean production region in Western Australia, in order to provide a national scope covering all major Australian production regions.
The new national focus of this project allowed the optimisation of breeding targets to encourage a more unified, profitable national strawberry industry. Breeding targets were defined in consultation with local industry in each region with an overall goal of supporting a sustainable and profitable national strawberry industry. Traits included, among other targets, suitability for substrate culture and improved disease resistance.
Over the course of the project, 12 varieties catering for subtropical, temperate and Mediterranean production regions were commercialised. In 2017 ASBP varieties captured 19% of the national industry, and 44% of the subtropical industry. These plantings had a farm gate value of approximately $78 million and contributed ~2700 jobs in production alone. The number of plants from this project grown across Australia is predicted to increase substantially in 2018.
This report covers the outputs from project BS12021, specifically in regard to breeding trials undertaken for all three targeted production regions and varieties commercialised, and findings from disease screening trials conducted for three major crown wilt diseases: Colletotrichum gloeosporioides, Fusarium oxysporum f. sp.
Hort Innovation – Final Report: National Strawberry Varietal Improvement Program
9
2.
Subtropical trials and selection
Jodi Neal and Mark Herrington
2.1. Introduction
The subtropical production region is primarily located in South East Queensland, Bundaberg, and northern New South Wales. Of these, production is concentrated in the Beerwah and Sunshine Coast regions in Queensland (Strawberry Strategic Investment Plan 2017-2021). The subtropical production season runs each year from approximately May to October. Specific challenges for this region include typically good punnet prices early in the season but low prices late season, and decreasing punnet prices overall due to increasing fruit production - driven largely by greater plant numbers - with relatively static demand. The number of subtropical strawberry plants planted rose from approximately 35 million to over 50 million between 2016 and 2017 seasons. As with all targeted productions regions, the overall aim of the subtropical breeding program is to provide varieties that encourage a profitable and environmentally, economically and socially sustainable strawberry industry.
2.2. Methods
The breeding methodology applied for the subtropical production region is outlined below (Sections 2.2.1 to 2.2.8). All stages of this process were undertaken simultaneously each year for seedlings and clonal selections at each phase.
2.2.1. Breeding objectives
Definition of breeding objectives for the subtropical production region was undertaken in consultation with the subtropical strawberry industry and Strawberry Variety Steering Committee (SVSC). The process was ongoing over the life of the project, with breeding objectives refined and adapted as necessary to ensure that they were in line with any changes in environmental or market forces. The general breeding objective for the subtropical production region has been to develop and make available varieties that provide increased profitability for producers while satisfying consumer and market expectations. Each of these two objectives are discussed in more detail below.
The traits important for increasing production profitability were estimated using an economic model developed by Mark Herrington in consultation with industry. The model allowed informed selection decisions to be made, weighting the value of plant and fruit traits to estimate the profitability of each selection as a variety. Taken into account were the effects of traits such as fruit size, bruise resistance, and ease of picking on the time expended to pick and pack fruit, and therefore labour cost. Also predicted were punnet prices each month based on yield quantity and yield distribution over the season, thereby estimating income.
Consumer expectations were also weighted heavily in developing subtropical breeding objectives, in order to help create the demand necessary to support the growing industry. Among the traits deemed important for consumer acceptance and repeat purchasing were: reliable good flavour (lower acid), good shelf life, and attractive
appearance.
Pre-breeding objectives were also defined for resistance to the diseases Macrophomina (charcoal rot), Fusarium and Colletotrichum, as well as specific flavour traits and specialty fruit colours: white/pale pink and very dark red.
2.2.2. Generating genetic variation
Parents with desirable traits as defined by the breeding objectives were selected using breeding values calculated from quantitative genetic analysis of trial data. Crosses were generally designed to improve specific traits whilst maintaining overall acceptability of underlying traits. Cross design in 2017 was additionally informed using estimated maximum and minimum profitability of offspring from each potential parent pair, based on combining the best and worst traits from each in an economic model. Prior to their use in crosses, all parents were
10 seedling families (unique parent pairs) and constituent parents planted in trials each season are shown in Table 2.1.
Table 2.1 For each subtropical production season: the number of seedling genotypes planted, number of seedling families and parents used, and the number of clones tested in early, advanced, and on-farm trials.
Location Season Seedlings Families Parents Early clones
Advanced clones
1st stage on-farm
clones
2nd stage on-farm
clones
Nambour 2013 3626 121 80 104 97 2 6
2014 7885 66 66 69 44 6 2
2015 8027 84 41 146 23 01 01
2016 7657 67 52 127 31 6 2
2017 6084 73 51 216 13 3 2
Bundaberg 2013 924 5 4 02 0 0 0
2014 1410 18 13 02 0 0 0
2015 1491 18 19 02 0 0 0
2016 3219 21 18 02 0 0 0
2017 4334 34 28 02 0 0 0
Substrate 2015 0 0 0 0 5 0 0
2016 0 0 0 0 5 0 0
2017 152 7 4 12 6 0 0
1 No 2015 on-farm trials due to disease.
2 Bundaberg seedling selections retrieved annually for clonal testing at Nambour.
Crosses were conducted in insect-free glasshouse conditions, using a paint brush to apply pollen from dehisced anthers of the pollen parent to emasculated flowers of the maternal parent (Figure 2.1). Fruit were harvested once mature, blended with water in a blender, and then strained to separate out the seed. Due to recurrent issues with low germination success of seeds from the subtropical germplasm, seed was germinated in-vitro in tissue culture (see Section 12.2) in October each year. In December the germinated seedlings were transferred into 60 cell plug plant trays in 50/50, peat /vermiculite (size 3) mix and grown on under misters in a glasshouse for one month. Following this time they were transferred to a shadehouse for sun-toughening until being planted out in trials.
Hort Innovation – Final Report: National Strawberry Varietal Improvement Program
11
2.2.3. Assessment of genetic variation and selection of seedlings
Seedlings were planted into field trials each year at the Maroochy Research Facility, Nambour, Queensland (Figure 2.2), and Bundaberg Research Facility, Bundaberg, Queensland. In 2017 seedlings were also included in a small substrate (soilless culture) trial established at the Maroochy Research Facility. Approximately 10,000 seedlings were planted each year across all subtropical locations, with two plots per family per location. Seedling numbers planted in each trial in each season are shown in Table 2.1. Planting was undertaken in early March each year in Bundaberg, and mid-March for both field and substrate trials in Nambour. These timings are earlier than commercial plantings in order to drive the breeding objective of varieties with earlier fruit production.
Figure 2.2 Newly planted seedlings at Maroochy Research Facility, March 2018.
Assessment of seedling performance was undertaken via individual plant assessments in the field for highly heritable traits. These traits included fruit colour, firmness, shape, and display. Field assessments were conducted at three to four weekly intervals to allow a snapshot of current and future yield (via flower and bud production) for that time period to be estimated. At each assessment time plants thought to be performing well were flagged with a pin tag. At the end of the season plants with multiple pin tags were likely to have performed well across the season and were considered for further testing in early-stage clonal trials. Approximately 100-200 seedlings were selected each year.
In 2017, 152 seedlings were additionally planted in a small protected substrate trial at the Maroochy Research Facility. These were assessed similarly to the field trials described above.
2.2.4. Evaluation of progeny in early-stage clonal trials
The 100-200 seedlings selected for further testing each year across all subtropical trials were clonally propagated via runners in December/January each year. These were planted out as plugs into early-stage clonal trials at Nambour in mid-March of each year. Trials were randomised and replicated, with two reps of six plant plots per selection.
12 Table 2.2 Flower, fruit and plant traits assessed in field trials, and number of times traits were assessed per season for early and advanced stage clonal trials.
Trait
group Trait Description Unit
Approx. times assessed per season
Early clonal trials
Advanced clonal trials Flower
traits
Flower angle Angle of flower emergence Score 1-91 1 1 Flower display Position (extension) of flowers relative
to foliage
Score 1-91 1 1
Fruit traits
Plot yield Weight of harvested fruit per plot g Weekly Weekly Plot fruit count Count of harvested fruit per plot Count Weekly Weekly
Sugar (Brix) Soluble sucrose content ͦBrix 2 3
Acid Acid measurement % Citric acid
equivalent2
2 3
Flavour Flavour rating Score 1-91 3 3
Appearance Fruit appearance acceptability Score 1-91 4 4
Fruit shape Fruit shape code Score 1-91 2 2
External colour External colour rating (light to dark) Score 1-91 3 3 Internal colour Internal colour rating (light to dark) Score 1-91 2 3
Gloss External gloss rating Score 1-91 2 1
Impact Score of good visual impact after 2 days storage at room temperature
Score 1-91 Weekly Weekly
Cull Score of poor visual impact after 2 days storage at room temperature
Score 1-91 Weekly Weekly
Bruise resistance Fruit firmness measurement 0-1003 3 3 Abrasion
resistance
Abrasion resistance rating Score 1-91 3 3
Rain damage resistance
Proportion of fruit undamaged by rain Proportion As available As available
Black spot resistance
Proportion of fruit unaffected by black spot
Proportion As available As available
Sunburn resistance
Proportion of fruit undamaged by sunburn4
Proportion As available As available
Ease of pick (roll) Ease of fruit detachment using roll technique
Score 1-91 1 1
Fruit display Position (extension) of fruit relative to foliage
Score 1-91 1 1
Truss type Truss branching rating Score 1-91 1 1
Plant traits
Bush size Bush size rating Score 1-91 1 1
Leaf disease Leaf disease rating Score 1-91 As available As available
Mite tolerance Mite severity rating Score 1-91 As available As available
Runner number Runner number rating Score 1-91 1 1
Plant counts Count of plants per plot Count 4 4
1 1 = low/poor, 9 = high/good 2 pH end point = 8.1
Hort Innovation – Final Report: National Strawberry Varietal Improvement Program
13 Data was analysed using a Quantitative Genetic approach to estimate breeding and clonal values. This approach incorporates plant pedigree, so that shared genetics between selections can be used to more accurately predict performance. It also removes small-scale environmental effects across the field that may obscure estimation of genetic potential. This technique allows the assessment of a selection’s performance both as a clone (variety) and as a parent (the genetics it can contribute to its offspring) for each trait. Thresholds were established for each trait comparative to leading commercial varieties, and clonal values for each selection were run through the economic model to identify those most likely to have increased profitability for producers. Using this approach, 10-20 selections were chosen each year to progress to advanced-stage clonal trials.
2.2.5. Evaluation of progeny in advanced-stage clonal trials
Plant material for 10-20 selections from early-stage clonal trials were clonally propagated via runners in
December/January each year. These were planted out into advanced-stage clonal trials at Nambour in mid-March of each year. Trials were randomised and replicated, with three reps of six plant plots per selection. Data collection and selection decisions were made as described in Section 2.2.4 and in Table 2.2.
2.2.6. ‘On-farm’ evaluation
Virus free plant material of selections from advanced-stage clonal trials (1-10 selections) were supplied most years to two producers to assess in first-stage on-farm trials (see Table 2.1). Based on these evaluations, plants of one to five of these selections were subsequently supplied to four to five producers the following year for second-stage on-farm trialling. Data was collected by producers on total and marketable yield per harvest (fruit number and weight), plant habit, fruit quality traits, and growing conditions. At the end of the season the breeding team provided all involved producers with a report anonymously summarising the results and outcomes from all collaborating farms.
2.2.7. Pre-commercialisation
A major barrier to the rapid release of new varieties is the time needed to certify disease-free status, requiring a minimum of three years before material can be distributed to runner growers. To reduce the time needed we routinely undertook molecular and biological virus indexing of all new advanced selections and established them in tissue culture prior to sending to Agribio for testing and certification. This substantially reduced the amount of testing and time required in the system before commercial deployment - from three years down to two - and presented significant cost savings. Virus indexing occurred simultaneously with the preparation of selections for testing in on-farm trials. Indexed material at the pre-commercialisation stage was also distributed to runner growers under Material Transfer Agreements (MTAs) for early bulking of plant numbers to speed commercial deployment.
2.2.8. International germplasm exchange
For the ASBP to remain cutting edge, collaboration and information exchange with international strawberry breeding programs and scientists is essential. In 2003 a seed exchange agreement was established between the Department of Agriculture and Fisheries and the University of Florida Strawberry Breeding Program. Each year approximately 1,000 seed are exchanged between the two breeding programs. This agreement has been extremely beneficial for maintaining genetic variation within our subtropical breeding program.
2.3. Results and discussion
Over the course of project BS12021 five subtropical strawberry varieties were commercially released. These were ‘Red Rhapsody’, ‘Parisienne Kiss’, ‘Sundrench’, ‘Scarlet Rose-ASBP’, and ‘Sunglow ASBP’. Four additional varieties were accepted for PBR (Part I) in March 2018: ‘Meadowsong’, ‘Venus-ASBP’, ‘Summer Song’ and ‘Scarlet-silk’.
14 Rhapsody’ were first available in substantial numbers from runner growers and all plants were sold out. Plants of ‘Red Rhapsody’ represented 24% of all subtropical varieties grown in Australia in 2017. In 2018 this proportion is expected to further increase. This variety was the first to be selected using economic modelling of plant and fruit traits, and its success suggests that this approach is useful for selecting varieties with a profitable balance of production traits.
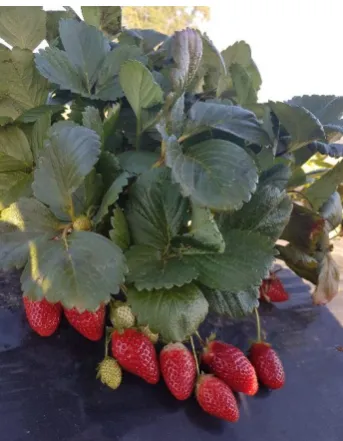
Figure 2.3 Fruit of commercialised variety Red Rhapsody.
There was initially some concern that the external fruit colour of ‘Red Rhapsody’ would be too dark to gain consumer acceptance. In June 2017 project co-lead Jodi Neal, Subtropical Industry Development Officer Jennifer Rowling and Queensland Strawberry Growers Association (QSGA) president Luigi Coco met with Woolworths representatives to discuss retailer and consumer education on the darker colour of ‘Red Rhapsody’ fruit. Despite some early concerns, Woolworths reported no issues with the variety over the course of the season, and were very pleased with its performance. They reported discard losses of only 1% for ‘Red Rhapsody’ compared with an internationally expected 7% for strawberries generally.
In 2015 the varieties Parisienne Kiss and Sundrench (breeding IDs 2011-049 and 2011-214, Figure 2.4) were accepted for PBR (Part I), and PBR was granted in 2016. At the current time these varieties have only been available with runner growers in small numbers, however uptake by industry, particularly of ‘Parisienne Kiss’, has been encouraging. In 2017 approximately 1,090,000 plants of ‘Parisienne Kiss’ were planted, and 360,000 plants of ‘Sundrench’.
Figure 2.4 Plants and fruit of commercialised varieties Parisienne Kiss (left) and Sundrench (right).
Hort Innovation – Final Report: National Strawberry Varietal Improvement Program
15 Figure 2.5 Fruit of commercialised varieties Scarlet Rose-ASBP (left) and Sunglow ASBP (right).
In March 2018 the varieties Meadowsong (breeding ID 2014-162), Venus-ASBP (2014-167), Summer Song (2015-237), and Scarlet-silk (2015-240) were submitted for Part I PBR (Figure 2.6). The latter two varieties were produced from crosses of subtropical germplasm and selected from a small trial at Applethorpe Research Facility,
Applethorpe, Queensland. These two varieties also possess good resistance to charcoal rot (Macrophomina
phaseolina). Small numbers of all four varieties are currently with runner growers and will be available in greater
numbers over the next few years.
16 In 2016 the University of Florida Strawberry Breeding Program released the variety Florida Beauty (Whitaker et al., 2017) (Appendix 1). This variety originated as seed produced at the Maroochy Research Facility and sent to Florida under the seed exchange agreement. ‘Florida Beauty’ has demonstrated adaptation to early planting, with excellent fruit quality.
2.4. Conclusions
This project has produced excellent outcomes for the subtropical production region. Variety uptake from the project is extremely high, with 44% of all commercial subtropical plantings being ASBP varieties. Similarly Queensland strawberry industry support for the project is very high. In an email dated 24/10/2017 QSGA wrote: “QSGA congratulates the DAF breeding team, yourself [Mark] and Jodi on producing world class varieties for strawberry growers in Queensland and Australia. We doubt that there is any other adapted material available globally which can now match the top shelf varieties coming out of the ASBP subtropical node. We look forward to seeing the next tranche of genotypes, but are aware the bar has been set extremely high.”
2.5. References
Strawberry Strategic Investment Plan 2017-2021. Horticulture Innovation Australia, Sydney, Australia.
Hort Innovation – Final Report: National Strawberry Varietal Improvement Program
17
3.
Temperate trials and selection
Jodi Neal and Mark Herrington
3.1. Introduction
Temperate strawberry production is concentrated in the Yarra Valley in Victoria, the Adelaide Hills region in South Australia, Albany in Western Australia, and the Stanthorpe region in Queensland. Victoria has the highest
production of these, contributing around 36% of national production in 2014/15 (Strawberry Strategic Investment Plan 2017-2021). The temperate season runs from approximately October to May each year. Specific challenges for temperate production include high summer temperatures, especially in Victoria, and a high incidence of plant deaths in the field from charcoal rot (Macrophomina phaseolina). The latter of these is exacerbated by susceptibility of the dominant commercial variety Albion to this disease (see Chapter 9). With the absence of effective disease control since the deregistration of the fungicide methyl bromide, a small but growing number of producers have been moving to production in substrate on tabletops.
In 2015 the Australian Strawberry Breeding Program (ASBP) began management of the existing Victorian Strawberry Breeding Program based at the Wandin Strawberry Research Centre, Victoria. This merging involved fusing the staff capacity, skills and germplasm of the Strawberries Australia Inc. (SAI) and Hort Innovation program centred in Victoria with the staff capacity, skills and germplasm of the subtropical program centred in Queensland and led by Queensland Department of Agriculture and Fisheries (DAF). Merging the programs has increased capability and efficiency, and built on the strong foundations laid by the Victorian program and its grower collaborators in Victoria, South Australia, Tasmania, Western Australia, and New South Wales/Australia Capital Territory.
3.2. Methods
The methods employed in the temperate breeding program were very similar to those described in Chapter 2. The strategy undertaken is outlined in Sections 3.2.1 to 3.2.7 below.
3.2.1. Streamlining the breeding cycle
From observations and discussions with the temperate industry we identified that the key requirement to ensure that advanced and advantageous germplasm from the temperate breeding program gets competitively into commerce, was to shorten the cycle from selection to deployment into commercial availability. The main constraint to reducing the time was identified as an extremely high level of virus infection among selections. In 2015 94% of plants tested were virus infected, and 50% of these had dual infections of Strawberry mild yellow edge virus (SMYEV) plus Strawberry mottle virus (SMoV). All nucleus plants made available to runner growers must first be certified as disease-free (including virus), and cleaning up of virus infected material can add up to five years to the time from selection to commercial deployment as well as significant expense. Limiting new virus infections within the breeding populations therefore became a key focus of the temperate breeding activities.
The key strategy employed to reduce virus incidence in the breeding population was to break the infection cycle across generations. Specific activities included the following:
Removal of possible sources of infection (i.e. any plants from previous generations) from the field environment.
Isolation (via quarantine into a screen house) of all known virus infected but required plants. Elimination of virus vectors i.e. transmitting insects.
Rapid removal of non-selected plants and poor performing clonal selections from field trials throughout the trial season.
Increased spacing of field plants to allow better spray penetration. This reduced the total number of plants that could be assessed but made evaluation more efficient.
18 Molecular virus screening of selections, and disposal of infected plants or isolation in vector-proof cages.
Historic germplasm was maintained, as much as possible, with the assumption that the previous program’s more recently developed germplasm would be more advanced and desirable than older germplasm. Additionally all on-farm trials were initially suspended to avoid distributing virus to commercial on-farms in trial plants.
3.2.2. Breeding objectives
Breeding objectives for the temperate production region were developed based on consultation with the temperate industry and Strawberry Variety Steering Committee (SVSC). These discussions were ongoing over the course of the project to ensure that breeding objectives remained relevant to any changes in production
environment or consumer expectations. Similar to the subtropical production region, the major aim for the temperate region was the development and availability of new varieties with increased profitability of production that met consumer needs.
Many of the traits identified as important for profitability in the subtropical economic model (Section 2.2.1) are also relevant for production under temperate conditions, however in discussion with industry some differences were identified. For in-ground production in Victoria especially, increased heat tolerance and fruit sunburn resistance are likely to have a large impact on yield and fruit quality, and so have been incorporated into the breeding strategy. Additionally, a number of temperate producers, particularly in Tasmania, have changed from in-ground production to substrate culture on tabletops. Plant and fruit requirements for this environment is subtly different to those for in-ground production (e.g. longer trusses and a more pressing need for high bruise resistance). These have now been accounted for in breeding objectives.
3.2.3. Generating genetic variation
Parents were selected each year based on breeding values for each trait generated through Quantitative Genetic Analysis of trial data. High performing parents were combined in crossing strategies aimed at producing offspring with traits matching the temperate breeding objectives. Seed was produced using the method described in Section 2.2.2. Seeds were soaked in 98% technical grade sulphuric acid for eight minutes, then rinsed in water and sown into shallow trays of seedling mix (sand with some peat moss and brown coal). Once germinated, seedlings were transferred to potting mix in 42 cell plug plant trays (Figure 3.1). The number of families and parents used in crosses each year are shown in Table 3.1.
Hort Innovation – Final Report: National Strawberry Varietal Improvement Program
19 Table 3.1 For each temperate production season: the number of seedling genotypes planted at the Wandin Strawberry Research Centre, number of seedling families and parents used, and the number of clones tested in early, advanced, and on-farm trials. On-farm trials were suspended until 2017 to avoid distributing virus to commercial farms in trial plants.
Season Seedlings Families Parents Early clones
Advanced clones
1st stage on-farm clones
2nd stage on-farm
clones
2015-16 12069 89 21 115 11 0 0
2016-17 13739 23 12 127 4 0 0
2017-18 12979 21 15 85 11 14 0
3.2.4. Assessment of genetic variation and selection of seedlings
In April to May each year 12,000-14,000 seedlings from 20-90 families were planted into a seedling trial at the Wandin Research Centre (Table 3.1, Figure 3.2). Both short day and day neutral plants were planted at the same time, but slightly earlier than day neutrals are planted in commercial farms. This was done to drive selection for plants that have both the early yield of short day varieties as well as the consistent production of day neutral varieties. Families were randomised and planted into two replicate plots per trial.
Assessment of seedling trials began in October each year and continued until the end of February. While the commercial production season continues until May, the selection of trial material in early March allowed the strategic management of virus control and plant propagation. Selections were made using the strategy described in Section 2.2.3.
Figure 3.2 2016/17 seedling trial and early- and advanced-stage clonal trial (top right) at the Wandin Strawberry Research Centre.
3.2.5. Evaluation of early- and advanced-stage progeny in clonal trials
20
3.2.6. ‘On-farm’ evaluation
Evaluation of elite selections in on-farm trials was temporarily suspended in 2015 until virus-free material could be made available to distribute to commercial producers. In 2017, virus-free plants of 10 of the 14-series selections were distributed to four Victorian producers (the Temperate Node Reference Group).
In 2017 SAI also nationally distributed four earlier SAI/Hort Innovation selections for on-farm trials following ASBP’s positioning of plants to facilitate this. Three of these selections were from the 05-series and one from the 08-series, and are discussed in more detail in Section 3.3.2 below.
3.2.7. Pre-commercialisation
Pre-commercialisation activities for the temperate material were undertaken as described in Section 2.2.7.
3.3. Results and discussion
3.3.1. Virus management
Significant progress has been made in reducing new virus infections in the temperate plant material since
mitigation activities were first undertaken. In 2015, 94% of plants tested were infected, with 50% of these infected with two viruses (SMYEV plus SMoV). Under the strategies put in place, infections in 2016 were reduced to 33% and none of these were dual infections. In 2017 virus incidence was only 7%. Access to virus-free plants allowed on-farm trials to resume in 2017 for the 14-series selections, and this material is already positioned with runner growers and ready for commercialisation. By avoiding expensive virus clean-up the project has reduced the time from cross to potential commercial deployment from 10-13 years for the 05- and 08-series, to 4 years for the 14-series.
3.3.2. SAI/Hort innovation historic selections
Hort Innovation – Final Report: National Strawberry Varietal Improvement Program
21 Figure 3.3. Selection 08-042-022, one of the SAI and Hort Innovation Victorian Breeding Program temperate selections
positioned for commercialisation.
Following discussions with those familiar with SAI/Hort Innovation selections of the 07-series that were part way though virus testing, two of the three were withdrawn from the process ‘as not likely to give an advantage’. The continuing selection 07-012-17 (short day) was subsequently found to be virus positive on the final test, and withdrawn from the positioning process.
3.3.3. ASBP selections
Ten advanced, 14-series selections are currently being trialled on farms in the 2017/18 season for assessment by producers (Figure 3.4). These 10 selections were chosen in collaboration with the industry’s Temperate Node Reference Group, and feedback from producers collected at a field day at the Wandin Research Centre in November 2016. While trialling and selection decisions for the 14-series were made by ASBP, this material was crossed under the previous Victorian Breeding Program and is therefore the intellectual property of SAI and Hort Innovation. At present feedback from the Temperate Node Reference Group suggests that four of these selections may have some commercial potential. We have recommended that SAI and Hort Innovation pursue
commercialisation of these as soon as possible to make them commercially available for the 2019/20 season.
22 Eleven advanced selections were made from the 15-series in March 2018 (Figure 3.5). These selections are currently being clonally propagated for distribution for on-farm trialling in the 2018/19 season.
Figure 3.5 One of the 15-series selections to be included in on-farms trials in the 2018/19 season.
3.4. Conclusions
Through effective virus management, the project has been successful in reducing the time from cross to potential commercial deployment from 10-13 years for earlier selections to 4 years for the 14-series. This will allow advantageous material to be released competitively into commerce, and has significantly reduced the cost of commercialisation. The project has facilitated the progress of eight SAI/Hort Innovation varieties to the point of commercialisation, and have recommended that SAI and Hort Innovation commercialise these as soon as possible to have them available for sale by runner growers in the August 2018 plant order period.
3.5. References
Hort Innovation – Final Report: National Strawberry Varietal Improvement Program
23
4.
Mediterranean trials and selection
Jodi Neal and Mark Herrington
4.1. Introduction
Mediterranean strawberry production is primarily located in the Wanneroo/Bullsbrook region north of Perth, Western Australia. While international export of strawberries is only around 4% nationally, approximately 90% of this is from Western Australia (Strawberry Strategic Investment Plan 2017-2021). Given the existing expertise and markets for export in the Mediterranean region, breeding for this area focused on designing varieties for
international export. It was expected that this focus would allow capacity building and later inclusion of the subtropical and temperate production regions into a consolidated, integrated national export market.
The Australian Strawberry Breeding Program (ASBP) first began varietal development for the Mediterranean production region in 2015. The initial objective was to develop procedures for the successful establishment and assessment of seedling and clonal trials in the Wanneroo region, as well as retrieval and transport of selections back to the Maroochy Research Facility (MRF), Nambour, Queensland for virus testing, initiation into tissue culture, and potential distribution to runner growers and Agribio for disease-free certification.
4.2. Methods
4.2.1. Breeding objectives
The overarching breeding objective for the Mediterranean production region was to develop varieties suitable for international export. The traits necessary for this to be achieved were selected via discussion with Mediterranean industry members and the Strawberry Variety Steering Committee (SVSC), and included good shelf life, bruise resistance, and bright red fruit colour.
4.2.2. Generating genetic variation
High performing parents were combined in crossing strategies aimed at producing offspring with traits matching the Mediterranean breeding objectives. Seed and seedlings were produced at MRF using the method described in Section 2.2.2.
4.2.3. Assessment and selection of progeny from seedling and early-stage clonal trials
In 2015, 546 seedlings (Table 4.1) were transported from MRF to a producer’s farm in the Wanneroo region for assessment. Seedlings were inspected at approximately monthly intervals over the production season
(approximately April to October), and five selections made using the strategy described in Section 2.2.3. These selections all died subsequent to being transported back to MRF for clonal propagation, and an alternative strategy was devised for the 2016 season to avoid this issue.
The following season (2016), 1,054 seedlings were clonally duplicated prior to sending to Western Australia, and copies maintained at MRF for the duration of the season. Ten clonal selections from subtropical trials thought to have some potential for the Mediterranean region were also duplicated and sent to Western Australia (Table 4.1). Seedlings were assessed and selected as described above. Clonal plants were planted into two replicate plots of six plants each, and each plot harvested, weighed and fruit counted weekly. Fruit were also assessed on shape, firmness, flavour, and general commercial acceptability. At the end of the season 18 seedlings were selected to progress for further testing. None of the clones were deemed to have commercial potential and were therefore discontinued.
24 to an advanced clonal trial and on-farm trials in 2018.
Table 4.1 For each Mediterranean production season: the number of seedling genotypes planted in Wanneroo, number of seedling families and parents used, and the number of clones tested in early, advanced, and on-farm trials. Due to issues with plant retrieval following selection, 2018 will be the first year that on-farm trials of Mediterranean selections will be conducted.
Season Seedlings Families Parents Early clones
Advanced clones
1st stage on-farm clones
2nd stage on-farm
clones
2015 5461 18 13 0 0 0 0
2016 1054 7 9 10 0 0 0
2017 1893 17 15 18 0 0 0
1 Selections from this trial died following transit back to the Maroochy Research Facility for clonal propagation.
While clonal duplication of seedling plants worked well the previous year, the resources required for this approach were prohibitive, and so a third alternative strategy was trialled. Seedling and clonal selections from the 2017 Mediterranean trials were retrieved and sent to a new Western Australia runner grower, Trandos Hydroponic Growers (THG), for clonal propagation for 2018 trials.
4.2.4. Pre-commercialisation
Pre-commercialisation activities for the three selections from the 2017 Mediterranean clonal trial were undertaken as described in Section 2.2.7.
4.3. Results and discussion
In order to provide an early outcome for the Mediterranean production region, the three clonal selections from the 2017 clonal trial were fast-tracked to 2018 on-farm trialling, and also submitted and accepted for PBR (Part I) in March 2018. These selections were ‘Rosalie-ASBP’, ‘Jubilee-ASBP’ and ‘Fanfare-ASBP’ (Figure 4.1). Small numbers of these varieties are currently with runner growers and will be available in greater numbers over the next few years.
Figure 4.1 Mediterranean varieties Fanfare-ASBP (left), Jubilee-ASBP (top right), and Rosalie-ASBP (bottom right).
4.4. References
Hort Innovation – Final Report: National Strawberry Varietal Improvement Program
25
5.
Screening for resistance to Colletotrichum gloeosporioides
Jodi Neal, Hian-Lien Ko, Apollo Gomez, Joanne De Faveri and Mark Herrington
5.1. Introduction
Anthracnose crown rot caused by the pathogen Colletotrichum is a major disease in strawberry (Fragaria
×ananassa Duch.) production worldwide, resulting in crown collapse and death of strawberry plants (Lewers et al., 2007, Mangandi et al., 2015). While several Colletotrichum species are known to cause anthracnose crown rot, the most common species observed infecting strawberry plants in Australia in recent years is C. gloeosporioides (Penz) (Cg) (Gomez et al., 2011, Mackenzie et al., 2009).
Cg is often referred to by its teleomorph name Glomerella cingulata (Gc), which indicates a sexual stage of Cg, and Gc2 is the sub-group responsible for most of the recent infections in Australia (Gomez et al., 2012, Mackenzie et
al., 2009). For simplicity both stages will be referred to as Cg in this report. In the field the source of this fungal disease is commonly other infected strawberry plants, however it has a broad host range including various commercially grown fruit and nut crops (Freeman, 2008, Lewers et al., 2007, Xiao et al., 2004) and weed species (Neal et al., 2017). Early work suggests that at least some isolates from alternative hosts can also infect strawberry (Neal et al., 2017). The pathogen is typically splash-dispersed, and frequent rainfall and overhead irrigation are therefore regarded as exacerbating dispersion (Ntahimpera et al., 1999, Simpson et al., 1994).
Several cultural practices and chemical treatments are available to reduce losses in strawberry crops, however these are only partially effective, and options are limited due to the number of permitted sprays per season (Hutton et al., 2009). Large numbers of plant deaths can occur in the field if susceptible cultivars are planted, potentially causing devastating economic losses (Hutton et al., 2010). The development and availability of strawberry cultivars with increased resistance to Cg is therefore desirable.
Several sources of resistance to Colletotrichum have been identified and reported, including a wild F. virginiana ssp. grayana genotype ‘NC95-19-1’ (Lewers et al., 2007) and several breeding lines from Mississippi, USA (Galletta et al., 1993). High levels of crown rot resistance in the early Australian cultivar Phenomenal has also been observed (Neal et al., 2017). None of these lines are suitable for cultivation under today’s standards, however they may represent a valuable resource for incorporating resistance into breeding programs.
Different strains of Cg with varying levels of pathogenicity have been found in different parts of the world. A local isolate may not have the same level of pathogenicity to a local cultivar compared to a different genotype under different conditions (Mackenzie et al., 2009).
The response of various strawberry genotypes, including commercial cultivars, clonal breeding lines, and seedling families resulting from controlled crosses, to Australian Cg isolates was determined in a series of experiments undertaken over a period of six years. Variation in pathogenicity among isolates and the interaction of strawberry genotype × Cg isolate were also evaluated. Times to plant collapse and death, and survival rates of the plants were monitored for 5-10 weeks per experiment. Introducing Colletotrichum resistance through breeding programs is a long-term disease management strategy and sources of resistance are useful for improving genetic material.
5.2. Methods
5.2.1. Experimental design
A series of 22 glasshouse inoculation trials were conducted between 2012 and 2017. These trials included three separate categories of experiments, namely Cg resistance screening of clonal strawberry genotypes (experiments 1-19), Cg resistance screening of seedling families (experiments 4, 5, 7, 9, 20-22), and isolate pathogenicity assessment.
26 Table 5.1. Cg isolates used in the pathogenicity assays. All strawberry plants sampled were sourced from different runner farms.
Isolate no.
Host
Location of plants sampled
and year
3NA1473
Strawberry
1Cooroy, Qld 1990
4N17360
Strawberry
1Wamuran, Qld 2008
N18931
Strawberry
1Bellmere, Qld 2009
N19211
Strawberry
1Stanthorpe, Qld 2010
4N19276
Ozothamnus diosmifolius
2Stanthorpe, Qld 2010
4NTW 121a/92
Phyllanthus tenellus
2Chevallum, Qld 1992
41 Collected from crowns of symptomatic plant of Fragaria ×ananassa.
2 Weed species with symptomatic lesions, from which Colletotrichum was recovered in laboratory isolations. 3 Location of strawberry field from which plants were sampled.
4 Runner production farm
Disease resistance screening of strawberry genotypes for Cg isolate N19211 was conducted on 778 plants from 19 commercial cultivars currently or previously grown in Australia, as well as 4,046 plants from 258 breeding lines from the Australian Strawberry Breeding Program (ASBP). There were six to 40 replicate plants per genotype per experiment (Table 5.2). The cultivars Camarosa and Festival were used as susceptible controls, as they have previously been reported as highly susceptible to Cg (MacKenzie and Peres, 2007, MacKenzie et al., 2006, Peres and MacKenzie, 2012).
Within eight of the 22 experiments Cg resistance screening was also conducted on 1,594 seedlings from 34 families using isolate N19211 (Table 5.3). These plants were not clonally propagated and therefore were all genetically distinct. Seedling families were assessed in order to determine the most promising parent combinations/choices for Cg resistance. An additional 316 plants from 11 genotypes were included in the experiments and analysis as reference points for resistance.
5.2.2. Inoculation
Inoculum suspensions of six isolates of Cg (Table 5.1) were prepared at a spore concentration of 1 x 10⁶ spores/mL according to the method of Neal et al. (2017). All plants were grown in 1:1 sterile peat and sand in 100 mm Spacesaver pots for six to 12 months prior to inoculation. Approximately 2 mL of inoculum was sprayed directly onto the crowns of each plant using a 500 mL hand/garden sprayer, to simulate field infection of crowns by Cg spores. Following inoculation individual plants were covered with a clear plastic bag for five days, creating a high humidity environment to encourage infection, and placed under shade cloth in an evaporatively cooled glasshouse set to reach a maximum of 30°C. The pots were arranged on a horticultural capillary mat on top of a 200 micron black plastic sheet, which covered a thermostatically-controlled electronic heat mat (Adloheat) maintained at 28C and placed over a 25 mm Styrofoam sheet on the bench. Non-inoculated susceptible control plants of ‘Festival’ and ‘Camarosa’ were sprayed with sterile deionised water and subjected to the same conditions as the inoculated plants in the trial. Plant location within the glasshouse (experimental layout) and inoculation order was
27 Table 5.2 Details of cultivars, number of plants per cultivar, number of breeding line genotypes evaluated, and total number of breeding line plants in clonal disease resistance screening experiments (including isolate x genotype).
Cultivar / breeding line
Experiment number and month and year conducted1
Total
1 2 3 4 5 6 7 8 9 10 11 12 13 14 15 16 17 18 19
Mar 2012
Apr 2012
Sep 2012
Apr 2013
Aug 2013
Nov 2013
May 2014
Sep 2014
Apr 2015
May 2015
Jul 2015
Oct 2015
Jan 2014
Feb 2016
Jun 2016
Sep 2016
Oct 2016
Apr 2017
Apr 2017
Albion 12 12
Aussiegem 12 12
Camarosa 8 8 7 10 12 40 6 10 10 6 12 10 10 10 10 10 6 185
Earlibrite 12 12
Earlisweet 17 10 12 6 6 12 63
Festival 10 12 6 6 10 10 12 10 12 12 9 12 12 133
Florida Radiance 10 12 22
Kabarla 6 10 12 6 6 6 46
Majestic 14 14
Parisienne Belle 6 6
Parisienne Kiss 6 12 18
Phenomenal 20 17 10 12 6 6 71
Red Rhapsody 12 6 6 9 6 39
Redlands Crimson 20 10 12 23 65
Rubygem 10 12 6 12 40
Suncoast Delight 7 7
Sweet Charlie 8 8
Tioga 6 6
Treasure 7 12 19
Total no. cultivar plants 8 74 41 87 128 106 12 20 20 30 12 43 20 22 22 31 30 60 12 778 No. breeding line
genotypes 11 0 12 23 29 110 8 12 20 3 41 43 0 16 24 25 3 15 16 258
Total no. breeding line
plants 71 0 127 207 346 684 48 217 344 18 480 446 0 192 267 254 18 177 168 4046 Grand total no. plants 79 74 168 294 474 790 60 237 364 48 492 489 20 214 289 285 48 237 180 4824
1 19 of 22 experiment conducted between 2012-2017 included clonal evaluations. See Table 3 for additional family assessments in three additional
28 Table 5.3. Number of plants per family and per reference genotype evaluated in family disease resistance screening experiments using Cg isolate 19211. Genotypes are listed below the family totals.
Family/cultivar
Experiment
Total
4 5 7 9 20 21 22
Apr 2013 Aug 2013 May 2014 Apr 2015 Jun 2013 Oct 2013 Sep 2016
3058 8 8
3513 14 4 18
3519 21 9 30
3683 10 10 20
3685 26 19 45
3686 62 41 103
3689 5 3 8
3697 9 3 12
3701 15 14 29
3705 16 12 28
3715 3 3 6
3722 3 3 6
3726 7 6 13
3730 5 5 10
3733 5 3 8
3738 20 19 39
3740 8 2 10
3755 75 75
3756 48 48
3776 97 97
3782 67 67
3826 125 125
3827 89 89
3828 95 95
3830 171 171
3853 42 42
4110 73 73
4113 25 25
4118 237 237
4121 5 5
US 159-3499 8 8
US 292-3500 10 12 22
US 438-3501 10 10
US 70-3498 12 12
Total family plants 28 229 24 156 686 123 348 1594
Camarosa 10 27 12 10 6 10 10 85
Earlisweet 10 12 22
Festival 10 12 6 10 38
Florida Radiance 10 12 22
Kabarla 10 12 22
NC95-19-1 10 12 12 34
Phenomenal 10 12 22
Redlands Crimson 10 12 22
Rubygem 10 12 22
Sweet Charlie 8 8
Treasure 7 12 19
Total plants 28 229 24 156 686 123 347 1593
Hort Innovation – Final Report: National Strawberry Varietal Improvement Program
29
5.2.3. Statistical analysis
Genotype (cultivars and clonal breeding lines) and family data for isolate N19211 were analysed separately, as was the isolate pathogenicity data. A discrete time survival analysis based on Cox’s proportional hazards model was performed on the mortality data (Neal et al., 2017, Southey et al., 2003). The data was coded with 0 for each week alive and then 1 when a mortality event occurred. For example a plant that was alive for four weeks post
inoculation and then died in the fifth week would be coded as 0,0,0,0,1. Pedigree information which related the cultivars across the 22 experiments was included in the model for the genotype data so both additive and non-additive genetic effects could be predicted. Family data was analysed similarly but using a family model (with pedigree) rather than an individual model. Analyses were performed in ASReml-R using a binomial GLMM with complementary log log link function, and accounted for the different censoring times across experiments.
Hazard ratios were predicted for each genotype and family relative to the hazard of ‘Camarosa’. The hazard gives the rate at which mortality events happen for each genotype/family. The hazard function may change over time but the proportional hazards model assumes the hazard for one genotype is a constant proportion of the hazard in the other genotypes. This proportion is called the hazard ratio (Duerden, 2014). Genotype hazard ratios greater than one suggest a higher rate of death (lower survival) than ‘Camarosa’. Survival functions S(t), which is the probability a cultivar survives beyond time t, were also predicted for ‘Camarosa’ and the top five genotypes for disease resistance (Collett, 2003).
The isolate pathogenicity data was analysed using a discrete time survival analysis based on the proportional hazards model. The model included fixed effects for genotype, isolate, and genotype × isolate interaction.
5.3. Results
5.3.1. Isolate Pathogenicity
There was a significant (P<0.05) isolate effect and a significant (P<0.05) genotype effect but no significant interaction. Isolate N19276 had a significantly lower hazard (mortality) than the other isolates. The hazard ratios for each isolate with respect to isolate N19276 are shown in Figure 5.1. A hazard ratio of one suggests the same likelihood of mortality at any given time as N19276. One of the combinations (‘Phenomenal’ x isolate NA1473) showed no mortality over all plants. To avoid problems with predictions for this genotype and isolate, the predictions in Figure 5.1 are from the main effects model isolate + genotype.
Figure 5.1 Hazard ratios relative to isolate N19276 for the six Cg isolates tested on cultivars ‘Camarosa’, ‘Earlisweet’, ‘Kabarla’, ‘Phenomenal’, ‘Red Rhapsody’, ‘2008-054’, ‘3058-22-06’, and ‘NC95-19-1’. Higher values suggest higher pathogenicity. Hazard ratios with same subscript are not significantly different at the P = 0.05 level.
30
5.3.2. Genotype Screening
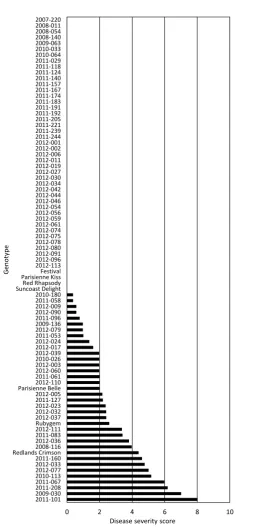
Significant additive genetic variance was detected in the genotype screening analysis. There was a small non-additive genetic variance component. Hazard ratios with the control ‘Camarosa’ are presented in Figure 5.2. These are based on the total genetic effects.
Narrow sense heritability for Cg resistance was relatively low at 0.23. Broad sense heritability is similar at 0.24, due to the limited non-additive genetic variance detected.
The five most resistant genotypes, from most resistant to least resistant, were: ‘3058-25M’, ‘US 438-3501(4)’, ‘3058-22-04’, ‘US 438-3501(14)’, ‘2014-243’ (Figure 5.3). These genotypes had observed hazard ratios with ‘Camarosa’ of between 0.07 and 0.14, suggesting likelihoods of mortality at any given time of 7% and 14% of that observed for ‘Camarosa’.
Parentage for the most resistant genotypes was strongly represented by progeny of open-pollinated ‘US 438’, resulting in the US 438-3501 population of which five of the ten most resistant genotypes were members. Also ranking well were offspring from ‘2013-001’ (from open-pollinated ‘NC95-19-1’) crossed with ‘Florida Radiance’, resulting in the advanced breeding line ‘2014-243’ and 12 of the top 25 genotypes for resistance.
The most resistant cultivars examined were ‘Phenomenal’, ‘Earlisweet’, ‘Kabarla’, and ‘Florida Radiance’. The least resistant included ‘Aussiegem’, ‘Treasure’, ‘Camarosa’, ‘Albion’, ‘Sweet Charlie’ and ‘Parisienne Belle’.
Figure 5.2 Hazard ratios with the control cultivar Camarosa for all genotypes assessed. All genotypes to the right of the asterisk have significantly lower hazard ratios than ‘Camarosa’. For ease of reading, the only non-cultivar genotypes labelled on Fig. 2 are: cultivars, ‘NC95-19-1’ [a wild genotype with known resistance to Cg (Lewers et al., 2007)], elite breeding line ‘2014-243’, and clones from the high performing family US 438-3051. The cultivars Treasure, Majestic, Tioga, Earlisweet and three members of family US 438-3501 are also not labelled for reasons of clarity. ‘Treasure’ is near ‘Aussiegem’, ‘Majestic’ is near ‘Camarosa’, ‘Tioga’ is near ‘Florida Radiance’, and ‘Earlisweet’ is near ‘NC-95-19-1’. The three additional members of family US 438-3501 are in the cluster to the far right of the graph.
Hort Innovation – Final Report: National Strawberry Varietal Improvement Program
31 Figure 5.3. Survival function S(t), (i.e. the predicted probability a cultivar survives beyond time t), for the control cultivar Camarosa and the best five genotypes for disease resistance.
5.3.3. Family Screening
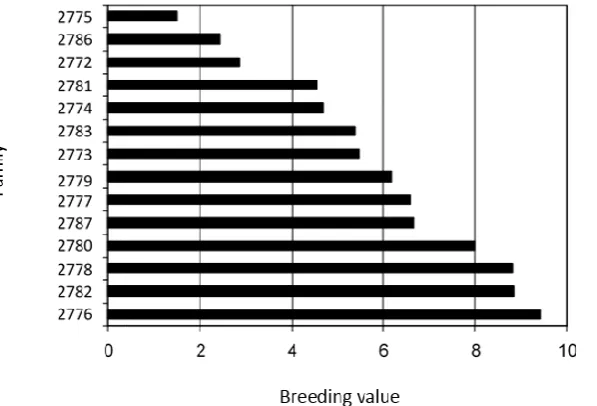
Hazard ratios of families with ‘Camarosa’ based on total genetic effects are presented in Figure 5.4. The most resistant family to Cg was 3726 (‘3058-16’ x ‘3058-16’), followed by 3738 (‘Florida Radiance’ x ‘3058-16’) and 3058 (open pollinated ‘NC95-19-1’, of which genotype ‘3058-25M’ is a member). Family US 438-3501 (open-pollinated ‘US 438’) ranked fourth.
Figure 5.4 Hazard ratios with the control cultivar Camarosa for all families (bold font) and reference genotypes (regular font) assessed. Asterisked families and genotypes have significantly lower hazard ratios than ‘Camarosa’ (P<0.05).
0 0.2 0.4 0.6 0.8 1 1.2 1.4 Fest ival Tr eas ur e Cam ar o sa 3 7 7 6 3 7 8 2 4 1 1 0 U S 7 0 -3 4 9 8 Swe et Cha rli e 3 8 2 8 3 8 5 3 3 8 2 7 3 8 2 6 U S 1 5 9 -3 4 9 9 3 7 5 5 3 6 9 7 Ru byg em 4 1 2 1 3 8 3 0 4 1 1 3 3 7 4 0 3 7 5 6 U S 2 9 2 -3 5 0 0 Ear lis w ee t 3 5 1 9 3 6 8 9 K abar la Re dl an ds Cr im so n Flo rid a R ad ia nc e 4 1 1 8 3 6 8 6 3 7 0 5 NC 9 5 -1 9 -1 3 6 8 5 3 7 3 0 3 6 8 3 3 5 1 3 3 7 0 1 3 7 3 3 3 7 1 5 3 7 2 2 P heno m ena l U S 4 3 8 -3 5 0 1 3 0 5 8 3 7 3 8 3 7 2 6 Ha za rd r ati o w ith C amaro sa Family/cultivar 0 0.2 0.4 0.6 0.8 1 1.2 1.4 Fe st iv a l Tre a su re C a m aro sa 3 7 7 6 3 7 8 2 4 1 1 0 U S 7 0 -3 4 9 8 Sw e e t C ha rli e 3 8 2 8 3 8 5 3 3 8 2 7 3 8 2 6 U S 1 5 9 -3 4 9 9 3 7 5 5 3 6 9 7 R uby
gem 412
1 3 8 3 0 4 1 1 3 3 7 4 0 3 7 5 6 U S 2 9 2 -3 5 0 0 Ea rl isw e e t 3 5 1 9 3 6 8 9 Ka ba rla R e dla nd s C rim so n Fl o ri da R adi
ance 411
8 3 6 8 6 3 7 0 5 NC 9 5 -1 9 -1 3 6 8 5 3 7 3 0 3 6 8 3 3 5 1 3 3 7 0 1 3 7 3 3 3 7 1 5 3 7 2 2 Phe no m e na l U S 4 3 8 -3 5 0 1 3 0 5 8 3 7 3 8 3 7 2 6 Ha za rd r ati o w ith C amaro sa Family/cultivar 0 0.2 0.4 0.6 0.8 1 1.2 1.4 Fe st iv a l Tre a su re C a m aro sa 3 7 7 6 3 7 8 2 4 1 1 0 U S 7 0 -3 4 9 8 Sw e e t C ha rli e 3 8 2 8 3 8 5 3 3 8 2 7 3 8 2 6 U S 1 5 9 -3 4 9 9 3 7 5 5 3 6 9 7 R uby
gem 412
1 3 8 3 0 4 1 1 3 3 <