http://www.sciencepublishinggroup.com/j/ajss doi: 10.11648/j.ajss.20190704.17
ISSN: 2330-8559 (Print); ISSN: 2330-8540 (Online)
Tracking Phenomenon in Physical Development During
Elementary School
Kohsuke Kasuya, Katsunori Fujii
Graduate School of Business Administration and Computer Science, Aichi Institute of Technology, Toyota City, Aichi, Japan
Email address:
To cite this article:
Kohsuke Kasuya, Katsunori Fujii. Tracking Phenomenon in Physical Development During Elementary School. American Journal of Sports Science. Vol. 7, No. 4, 2019, pp. 171-176. doi: 10.11648/j.ajss.20190704.17
Received: October 8, 2019; Accepted: November 8, 2019; Published: November 19, 2019
Abstract:
Ten-step assessments are generally used as means of assessing motor ability in school-age children. However, no method for assessing physical fitness and motor ability has been established that considers changes with age in young schoolchildren in the growth stage. In particular, no method has been constructed to evaluate physical longitudinal data for individuals. The purpose of this study was to establish a suitable method for evaluating this kind of physical longitudinal data, and examine motor ability tracking. Cohorts were established for physique and motor ability data published by the Ministry of Education, Culture, Sports, Science and Technology (MEXT) of Japan, and the wavelet interpolation model was applied to the mean values ± 0.5 SD and ± 1.5 SD from the first to the sixth grade of elementary school. A physical evaluation chart that included consideration of aging was then established. The longitudinal data for physique and motor ability from the first to sixth grade of elementary school were applied to this chart, and the physique and motor ability tracking status was analyzed. Physique was shown to track at high rates of greater than 95% for height and more than 70% of children for motor ability. This demonstrates that motor ability at the time of first grade in elementary school generally continues on the same course until the sixth grade. Given this tendency for evaluations of motor ability to follow the same trend line during the elementary school years, early educational attention may be necessary for children with poor motor ability.Keywords:
Preschool Children, Motor Abilities, Regression Evaluation, Fat-Slim Degree1. Introduction
There has been a fairly large number of reported evaluations of physical fitness and motor ability in schoolchildren in recent years. For example, Fujii [1] devised a method of assessment that includes consideration of physique using correlation analysis from the need for absolute assessment in sports tests. Bando et al. [2] measured vertical jump, sit-and-reach, and handball throw combined with a simple motion analysis system, and assessed physical fitness and motor ability. However, nearly all of these assessments were done with a cross-sectional approach. Other methods are to assess individual tasks from the mean value and standard deviation of physical fitness and motor ability in each school year, or to make assessments from a calculated T score if the overall total score is taken as a problem. These methods are useful in assessing current physical and motor fitness levels. However, as when assessing growth in physique, construction of a
developmental evaluation for physical fitness and motor ability requires construction of an evaluation chart for the developmental process. Unfortunately, no evaluation charts that include consideration of physical fitness and motor ability development have been devised because of the difficulty of smoothing for a smooth evaluation line.
constructed an evaluation chart. An advantage of these types of methods is that they can evaluate the motor ability development process with consideration of age. If a motor ability evaluation system could be constructed for all age periods in early childhood, motor ability could be assessed developmentally from early childhood even after children went into elementary school if a similar evaluation system were established for the elementary school years. The span of early childhood is already short, and attempts have been made to construct evaluation systems for motor ability development. This has not so far led to the establishment of a motor ability development evaluation system that covers age, although as mentioned above various systems for evaluation of children in each school year of elementary school have been developed.
Therefore, it is currently not possible to assess physical elements such as physique, physical fitness and motor ability longitudinally in the elementary school years with the changes that occur with age. For example, if one wants to examine the phenomenon called obesity tracking, one needs to be able to assess obesity as a child ages. In the field of medicine, Kori et al. [6] conducted a study to alert people to the risk of progressive obesity into adulthood. From the results of a comparison of the rates of change in BMI in an obese group and an average group from the first year of elementary school to the third year of middle school (grade 9), their study suggested that a marked rate of change in the obese group heightened the risk of adult obesity. Even so, it would be difficult to assert that an evaluation chart that includes considerations of age-related changes in BMI has been constructed for such assessments.
First, what needs to be done in constructing a development evaluation system for physical fitness and motor ability is to compose assessment ranges with smoothed curves, but so far only simple line graphs or, in very early childhood, percentile curves (exponential function) or the like have been applied. Spline smoothing methods have also been used in the past in smoothing, but there have been problems in the validity of the functions. Fujii [7-9] has proposed a wavelet interpolation model that makes it possible to construct an evaluation system for physical growth pattern analysis and delayed menarche. If this can be extended further to construct an evaluation system for physical fitness and motor ability development, assessments that include consideration of BMI with age would also be possible and the tracking phenomenon for obesity or leanness into adulthood could also be assessed. Of course, the motor ability tracking phenomenon could also be examined. Hasebe et al. [10] compared the motor ability of preschool and sixth grade boys, and conjectured that muscle strength, muscle endurance, and motor ability in running, jumping, and throwing in early childhood exerts a large effect up to the sixth grade. Kawasaki et al. [11] compared the motor ability of preschool and sixth grade girls, and conjectured that in running ability, flexibility, and muscle strength, the physical characteristics of early childhood exert a large influence in later childhood (elementary school years).
Utilizing the effectiveness of the wavelet interpolation model, in this study wavelet interpolation was first applied to
the mean growth distance values for physique and motor ability in elementary school based on a Survey of Physical Fitness and Motor Abilities reported by the Ministry of Education, Culture, Sports, Science and Technology (MEXT) of Japan. Next, wavelet interpolation was applied to the values of ±0.5 SD and ±1.5 SD of the national mean growth distance values, and an evaluation chart was constructed. Then, the obtained national mean evaluation chart was applied to the longitudinal motor ability development values obtained in this study. Investigations were then conducted on the type of evaluation that are derived, and the validity of the derived evaluation system for the elementary school years. The final aim of this study was to track motor ability. The longitudinal evaluation system of the motor ability process constructed in this study was applied to the level at each age of longitudinal motor ability data for individual children, and the tracking status with the development of motor ability was examined by making those determinations.
2. Methods
2.1. Subjects
The subjects were 30 boys and girls at one elementary school in Shizuoka Prefecture, Japan. The study and measurements involved were explained to the parents of the children in advance, and their informed consent was obtained. None of the subjects had any acute or chronic disease. To compose a time axis for these subjects in the first grade of elementary school, their precise ages at the time of the measurements was calculated from their date of birth.
2.2. Physique and Motor Ability Measurements
The motor ability measurements for the elementary school children in this study were taken from the new physical fitness test. The items on this test are measures of agility and endurance centered mainly on running, jumping, and throwing. They include height and weight as measures of physique and 50-meter run, standing long jump, softball throw, side steps, standing forward bend with legs straight, and shuttle run as measures of motor ability. In this study, we looked especially at the 50-meter run, standing long jump, and softball throw, which are measures of running, jumping, and throwing ability, as motor ability items. Longitudinal measurements were then made of physique (height, weight), 50-meter run, standing long jump, and softball throw twice a year in spring (April) and fall (October) from the first to sixth grades of elementary school. Thus, the physique and motor fitness data could be obtained as longitudinal growth and development data.
2.3. Analysis
From the reports on the results of surveys on physical fitness and motor abilities from 2008 to 2014 published by MEXT, growth and development data were obtained in cohort fashion, i.e., first grade students in 2008, second grade students in 2010 and so on, for physical fitness and motor abilities (50-meter run, standing long jump, softball throw) of sixth grade students in 2014. The wavelet interpolation model was applied to the mean growth and development distance values and mean ±0.5 SD and ±1.5 SD for those values, and a cohort growth and development evaluation chart was constructed. Then the individual longitudinal growth and development data for longitudinal height, weight, 50-meter run, standing long jump, and softball throw for the elementary school boys and girls obtained from the measurements were applied to the constructed evaluation chart. The trends in physical fitness and motor abilities from the first grade to the sixth grade determined in the evaluation were analyzed, and the motor fitness tracking status was investigated. Figure 3, Figure 4 shows the trends of the standing long jump assessment with sample data applied to the cohort evaluation chart constructed in this study. The assessment trends are clearly demonstrated.
2.4. Analytical Methods
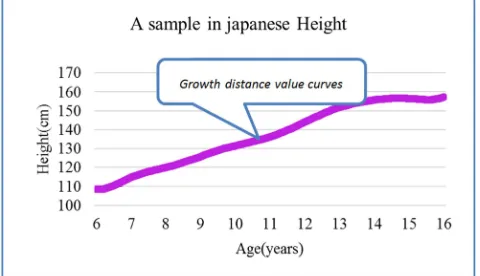
The wavelet interpolation method (WIM) is a method in which a growth distance curve is drawn with interpolation between data with a wavelet function (Meyer’s mother wavelet is the base function), the distance curve drawn is differentiated and the obtained growth velocity curve is derived. The growth distance values at the pubertal peak and the age of menarche were investigated in this study to approximately describe the true growth curve from the given growth data. The characteristics of the wavelet interpolation method are that local phenomena are read sensitively and the approximation accuracy is very high. The details of the theoretical background and the grounds for its effectiveness have already been described in Fujii's previous research [12-14], so the data analysis algorithm using the wavelet interpolation model is omitted here.
Figure 1. Growth distance value curves derived from wavelet interpolation method.
Figure 2. Growth velocity value curves derived from wavelet interpolation method.
2.5. Cohort
A cohort is a group of observed subjects with common factors. In demographics, it refers to a group born in the same year (or same time period). In this study, from the relationship in assessing longitudinal and growth data, the means and standard deviations shown in the reports on the results of surveys on physical fitness and motor abilities published by MEXT were applied to the growth and development data from the first to sixth grades of elementary school from 2008 to 2014 in cohort fashion (Tables 1, 2).
Table 1. Data number of boy’s.
Boy 6years 7years 8years 9years 10years 11years
2008 1118 1116 1106 1122 1111 1117
2009 1113 1116 1101 1111 1109 1114
2010 1097 1094 1107 1101 1102 1115
2011 1078 1097 1078 1101 1106 1094
2012 1110 1112 1122 1124 1118 1122
2013 1064 1068 1079 1080 1081 1062
2014 1119 1123 1120 1114 1119 1122
n 7699 7726 7713 7753 7746 7746
Table 2. Data number of girl’s.
Girl 6years 7years 8years 9years 10years 11years
2008 1123 1116 1102 1118 1102 1118
2009 1113 1115 1099 1112 1111 1117
2010 1098 1095 1113 1107 1099 1104
2011 1077 1092 1088 1089 1108 1087
2012 1113 1119 1110 1111 1119 1121
2013 1045 1040 1058 1045 1048 1043
2014 1124 1116 1123 1112 1125 1122
n 7693 7693 7693 7694 7712 7712
3. Results
entire school is obvious at a glance. Then, to analyze the tracking status, the assessment was given +5 points if the rate of subjects in each range remained the same, and decreased 1 point each for each change in rank. Figure 3, 4 shows the frequency distribution of the evaluation score from the first to sixth grades of elementary school, and the assessments determined from the national standards published by MEXT were derived from looking at this distribution chart. The data for individual children in this study were basically measured twice a year, and the evaluation score was calculated for each measurement. Hence, a fixation rate of +50 points or more through all school years was taken to show tracking. In this way, wavelet interpolation was applied to the values derived from MEXT physique and motor abilities statistics and an evaluation chart was constructed. The following results were then obtained in an evaluation of this chart from the first to sixth grade of elementary school for physique and motor abilities in the elementary school that was the subject of this study.
Figure 3. Male standing jump.
Figure 4. Female standing jump.
3.1. Physique Tracking
In the first grade of elementary school, the height assessment for boys and girls together was “short” for 5 children, “somewhat short” for 7 children, “average” for 15 children, “somewhat tall” for 2 children, and “tall” for 0 children. Each of these assessments was shown to trend with the same number of children until the sixth grade. Weight was “light” for 3 children, “somewhat light” for 9 children, “average” for 9 children, “somewhat heavy” for 5 children, and “heavy” for 3 children. With the exception of one of these
children, as with height the number children in each category was shown to remain unchanged through the sixth grade. Thus, tracking was seen from the first to the sixth grade in all of the children for height and in 97% of the children for weight.
3.2. Motor Ability Tracking
Figures 5 to 10 shows the tracking rate from the first to sixth grades in each measure of motor fitness for boys and girls. Referring to this Figure, it was determined that tracking of motor fitness for boys and girls together was seen in 70% of the children in the 50 -meter run, 79% in the standing long jump, and 86% in the softball throw. For boys and girls separately, there was judged to tracking in 78% of boys in the 50-meter run, 72% in the standing long jump, and 94% in the softball throw. Among girls, there was judged to be tracking in 73% in the 50-meter run, 91% in the standing long jump, and 73% in the softball throw. Thus, tracking was seen in motor fitness in more than 70% of boys and girls.
Figure 5. Tracking at Male 50m run.
Figure 6. Tracking at Female 50m run.
Figure 8. Tracking at Female standing jump.
Figure 9. Tracking at Male softball throw.
Figure 10. Tracking at Female softball throw.
4. Discussion
Reported assessments of physique and motor ability have used a wide range of findings, from those of Fujii [1] and Bando et al. [2] to findings derived from physical fitness survey reports issued each year by MEXT. However, while these are useful in assessing single years, no methods have been established for cases of deriving assessments that include changes with age. Moreover, no methods have been derived to assess longitudinal data. In this study, therefore, we investigated the establishment of a method to assess aging in longitudinal data in order to analyze the tracking phenomenon for physique and motor ability.
First, we applied wavelet interpolation to the mean growth and development distance values for physique and motor
ability from the first to sixth grade of elementary school published by MEXT. This was because it enables longitudinal assessments by smoothly interpolating the statistics showing the growth and development of physique and motor ability, and also because it can lead to the establishment of a strict assessment chart. By doing this a uniform method to assess longitudinal data is ensured. This study examined tracking status by uniformly assessing longitudinal data on physique and motor ability from the first to sixth grade of elementary school.
A declining trend in children’s physical fitness has been noted by many authors in recent years. Aside from the question of whether this is good or bad, it is been pointed out that if physical fitness and motor ability tracked consistently from early childhood, such tracking would obviously be seen in children with lower levels of physical fitness and motor ability. Examining the details of this tracking may yield hints to help solve the problem of poor physical fitness. It would not be limited to this issue, of course, but would also make it possible to show the developmental characteristics of children’s physical fitness and motor ability in recent years. The tracking of physique in this study showed that the number of children in the assessment cohorts in which both the height and weight of first grade boys and girls were evaluated continued unchanged to the sixth grade of elementary school. Genetic factors play a strong role in physique, especially height, and Fujii [1] stated that prior to puberty children’s height rank shows almost no change. Weight is also thought to track without much change. However, one can also imagine cases in which children migrate to another assessment cohort from differences in individual level of maturity. In any event, the development of physique in elementary school is thought to generally track along the same rank.
Motor ability was judged to track in more than 70% of both young boys and girls. Although the amount of subject data in this study was not large, the motor ability of 70% of elementary school children maintained roughly the same evaluation. These evaluations may be assumed to track at the same probability in cases of both good and poor motor ability. Thus, evaluations of motor ability in first grade elementary school students are nearly fixed. That much of motor ability is congenitally determined is clearly a major factor in this, but at the same time there are also thought to be large hidden factors from the effect of daily living environment. Thus, while children with outstanding motor skills are not a problem educationally, some kinds of measures may need to be taken for children with poor motor skills from the first grade of elementary school to curb this tracking. Judging from the results of this study, the motor ability assessment in the first grade seems to follow the same trend line with little change and so children with poor motor ability may need early educational attention.
The findings may be taken to show a significant possibility of tracking in obese adults. Kori et al. [6] applied BMI to Japanese subjects, and while they did not establish an evaluation chart clearly showing tracking, some points did suggest a tracking phenomenon in obesity. Thus, caution is needed for tracking in factors that carry risk of decreased physical fitness and motor ability or obesity. Fujii et al. [16] warned that decreased physical fitness starts from early childhood, but assuming that tracking occurs positively in the process from early childhood to the elementary school years, ways to deal with decreased physical fitness or obesity from early childhood may need to be considered.
5. Conclusion
The method generally used to assess motor ability in elementary school is the 10-step assessment in the new physical fitness test advocated by the by the Ministry of Education, Culture, Sports, Science and Technology (MEXT) of Japan. However, no method of assessing physical fitness and motor ability has been established that considers changes with age in schoolchildren, who are in the growth stage. Specifically, no method to evaluate physical longitudinal data for individual children has been created. This study attempted to establish a method that could handle such physical longitudinal data. Motor ability tracking was then examined with the application of this evaluation method. Physique and physical fitness data published by MEXT were used in constructing the evaluation chart, but cohort samples were established in the data in an attempt to evaluate the longitudinal data. As a result, an evaluation chart that considers aging was constructed, longitudinal data on physique and motor ability were assessed, and the assessments from the first to sixth grade of elementary school were shown. With the establishment of an assessment method that considers aging, the tracking status of physical elements (physique and motor fitness) was analyzed. More than 70% of motor ability was shown to track, and it was demonstrated that a child’s motor fitness ranking in the first grade generally continues to the sixth grade. Therefore, assessed motor ability levels in the elementary school years trend along the same line, and children with poor motor ability in particular may need early educational attention.
References
[1] K. Fujii, “A scientific approach to growth and development -Physical information science for growth development & health-,” Sankeisha, pp. 112-173, 2006.
[2] T. Bando, K. Ikuta, T. Hirai, and M. Sugie, “Current state of the physical fitness of incoming students at Osaka University,” Bulletin of Osaka University Research Center for Educational Research, Vol. 2, pp. 51-58, 2005.
[3] K. Fujii, T. Watanabe, and T. Sakai, “Change with age of correlation between body composition and motor ability in
young children,” The Journal of Education and Health Science, Vol. 56 (3), pp. 275-282, 2011.
[4] K. Fujii, N. Tanaka, J. D. Kim, “Composition regarding change of physique and motor ability with age in Korean preschool children -Analysis by applying least square approximation polynomial-,”Japanese Journal of Physiological Anthropology, Vol. 17 (2), pp. 57-65, 2012.
[5] K. Fujii, K. Kasuga, N. Tanaka, and K. Fukutomi, “Confirmation regarding relational composition between physique growth and motor fitness development in preschool children: Analysis on longitudinal data based on quadratic polynomial,” Japanese Journal of Physiological Anthropology, Vol. 18 (2), pp 67-75, 2013.
[6] Kori et al, “Impact of annual body mass index gain on obesity development in Japanese 6 year-old non obese children, Public Helth, 761.
[7] K. Fujii, Y. Matsuura, “Analysis of velocity curve for height by the wavelet interporlation method in childen classify by maturity rate,” American Journal of human Biology, 11, pp. 13-30, 1999.
[8] K. Fujii. “Verification regarding delayed menarche in Japanese female athletes: Analysis by wavelet interpolation method,” Physical education research, Vol 48 (5), pp. 523-539, 2003.
[9] K. Fujii, “Construction of delayed menarche evaluation system in Japanese female athletes,” The Journal of Education and Helth Science, Vol. 53 (3), pp. 273-285, 2008.
[10] Y. Hasebe, K. Kosyo, “How much physical fitness traits in early childhood track during childhood? A comparative study of older boys and 6th grade children,” Proceedings of the Japan Society of Physical Education, Vol 65 (0), pp. 199, 2004.
[11] M. Kawasaki, K. Kasuga, “How much physical fitness traits in early childhood should be tracked during childhood? A comparative study between older children and sixth graders in girls,” Proceedings of the Japan Society of Physical Education, Vol 65 (0), pp. 189, 2004.
[12] K. Fujii, H, Yamamoto, “Examination of average growth rate curve of male physique by Wavelet Interpolation Method,” The Japanese Journal of Physical Fitness and Sports Medicine, Vol. 44 (6), pp. 841, 1995.
[13] K. Fujii, “Analysis of MPV age-dependent average growth rate curves in height development of men and women by WIM,” The Japanese Journal of Physical Fitness and Sports Medicine, Vol. 45 (6), pp. 831, 1996.
[14] K. Fujii, “A developmental approach to verifying delayed menarche in female ball players: an approach from wavelet interpolation method,” The Japanese Journal of Physical Fitness and Sports Medicine, Vol. 48 (6), pp. 802, 1999.
[15] K. Fujii, “Assessing tracking to adult obesity: Examination based on obesity judgment based on age-related changes in BMI,” Child and development, Vol. 14 (3), pp. 230-237, 2016.