Optimal Location and Parameter Settings of
FACT’s Devices for Enhancing Power
System Stability and Minimization of
Power Losses
1
KIRAN KUMAR KUTHADI
Head of the Department Electrical & Electronics Engineering
Sree Vahini Institute of Science & Technology, TIRUVURU, Krishna Dist, Andhra Pradesh Email.id: [email protected]
2
M. SURESH BABU
Asst. Professor, Dept. of EEE
V.R.S & Y.R.N College of Engineering & Technology, CHIRALA, Prakasam Dist, Andhra Pradesh.
3
NAGARAJU TELLA
Asst. Professor, Dept. of EEE
Sree Vahini Institute of Science & Technology, TIRUVURU, Krishna Dist, Andhra Pradesh.
ABSTRACT: The loss minimization is a major role in Power System (PS) research. Transmission line losses in a Power System can be reduced by Var compensation. After the establishment of power markets with transmission open access, the significance and use of Flexible AC Transmission Systems (FACTS) devices for manipulating line power flows to relieve congestion and maximize the overall grid operation have been increased. Proper placement of Static VAR compensator (SVC) and Thyristor Controlled Series compensator (TCSC) reduces transmission losses, increases the available capacity, and improves the voltage profile. This paper presents an optimal placement of SVC and TCSC to determine SVC and TCSC locations and control parameters for minimization of transmission loss. Optimal location methods utilize the sensitivity of total real power transmission loss with respect to the control parameters of devices. The location of SVC & TCSC is placed based on VSI. The results have been obtained on IEEE 5bus and IEEE 14bus test system. Test result shows that both SVC and TCSC can determine optimal placement.
Index Terms: Flexible AC Transmission Systems (FACTS), Static VAR compensator (SVC), Thyristor Controlled Series compensator (TCSC), Voltage Stability Index (VSI).
1.INTRODUCTION
consisting of static var compensator (SVC) and thyristor controlled series compensator (TCSC) have been used in this paper. Minimization of transmission loss is solved by using the nonlinear interior point methods [2] to finding values of SVC and TCSC along with other control parameter such as transformer tap that was present in [3]. Due to high cost of SVC and TCSC, it is important to decide their optimal placement.
This paper presents the method of the optimal location utilizes the sensitivity of total real power transmission loss with respect to the control parameters of devices, the new equation of SVC is the sum of reactive power flow that has relationship with bus and the new equation of TCSC is sum of real power loss that has relationship with transmission line. The IEEE standard tested power system has been considered as tested system to investigate the effect of considering TCSC and SVC on power loss minimization and system stability.
2. MATHEMATICAL MODEL OF FACT’S
i. Static VAR compensator (SVC)
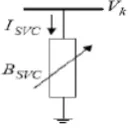
The SVC is taken to be a continuous, variable susceptance, which is adjusted in order to achieve a specified voltage magnitude while satisfying constraint conditions. SVC total susceptance model represents a changing susceptance. represents the fundamental frequency equivalent susceptance of all shunt modules making up the SVC. This model is an improved version of SVC models [2]. SVC’s normally include a combination of mechanically controlled and thyristor controlled shunt capacitors and reactors. The most popular configuration for continuously controlled SVC’s is the combination of either fix capacitor and thyristor controlled reactor [3].
Fig. 1 Basic Structure of SVC
As far as steady state analysis is concerned, both configurations can modeled along similar lines, The SVC structure shown in Fig. 1 is used to derive a SVC model that considers the Thyristor Controlled Reactor (TCR) firing angle as state variable. This is a new and more advanced SVC representation than those currently available. The SVC is treated as a generator behind an inductive reactance when the SVC is operating within the limits. The reactance represents the SVC voltage regulation characteristic, i.e., SVC’s slope, [4]. The reason for including the SVC voltage current slope in power flow studies is compelling. The slope can be represented by connecting the SVC models to an auxiliary bus coupled to the high voltage bus by an inductive reactance consisting of the transformer reactance and the SVC slope, in per unit (p.u) on the SVC base. A simpler representation assumes that the SVC slope, accounting for voltage regulation is zero. This assumption may be acceptable as long as the SVC is operating within the limits, but may lead to gross errors if the SVC is operating close to its reactive limits.
The linearized equation of the SVC is given by the following Eqns. (i) and (ii) where the total susceptance is taken to be the state variable.
0 0
0
at the end of iteration i, the variable shunt susceptance up dated according to the Eqn. (ii) given below
ii. Thyristor Controlled Series compensator (TCSC)
The effect of TCSC on network can be seen as a controllable reactance inserted in the related transmission line. The model of the network with TCSC is show in Fig. 2 [6].
Fig. 2 A Model of TCSC
The TCSC consist of a capacitor bank and a thyristor controlled inductive branch connected in parallel and series connected to the transmission line. The equivalent reactance of TCR, XLeq, at fundamental frequency, is show in Eqn (iii). The controllable reactance, XTCSC, is directly used as the control variable that can be determined by
2 sin 2
The power flow equation of the branch can be derived as follows
cos sin
sin cos
Where
3. VOLTAGE STABILITY INDEX
Voltage stability is becoming an increasing source of concern in secure operating of present-day power systems. The problem of voltage instability is mainly considered as the inability of the network to meet the load demand imposed in terms of inadequate reactive power support or active power transmission capability or both. It is mainly concerned with the analysis and the enhancement of steady state voltage stability based on L-index.
Consider an -bus system having1, 2, 3, … , generator buses , and 1, 2, … , the load buses
. The transmission system can be represented by using a hybrid representation, by the following set of equations
It can be seen that when a load bus approaches a steady state voltage collapse situation, the index approaches the numerical value 1.0. Hence for an overall system stability condition, the index evaluated at any of the buses must be less than unity. Thus the index value gives an indication of how far the system is from voltage collapse. The indices for a given load condition are computed for all load buses. The equation for the
index for node can be written as,
1 | |
cos
sin
It can be seen that when a load bus approaches a steady state voltage collapse situation, the index approaches the numerical value 1.0. Hence for an overall system voltage stability condition, the index evaluated at any of the buses must be less than unity. Thus the index value gives an indication of how far the system is from voltage collapse.
4. SIMULATION RESULTS
For the validation of the proposed FACT’s devices, both SVC and TCSC have been tested on the following IEEE 5-Bus and IEEE 14-Bus test System. A MATLAB code for both techniques was developed for simulation purpose.
4.1IEEE 5-Bus Test System
i.Location of TCSC:
The solution for optimal location of FACT’s devices to minimize the installation cost of FACT’s devices and overloads for IEEE 5-bus test system were obtained and discussed in this section.
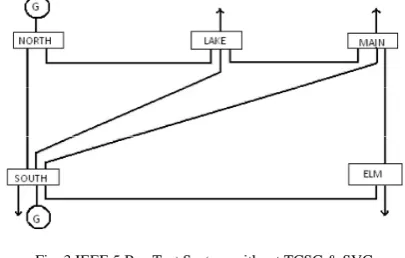
Fig. 3 IEEE 5 Bus Test System without TCSC & SVC
Voltage stability indices are calculated for the IEEE 5 bus system without any FACTS devices as shown in Fig. 3.
By considering the Voltage stability index (Lj) value, it is observed that bus Elm is more sensitive towards system security. Therefore bus Elm is more suitable location for TCSC to improve power system security/stability. An additional node is termed as node Elmfa, is used to connect the TCSC. The modified original networks to include a TCSC between nodes Elm and Elmfa as shown in Fig. 4.
Table 1: Voltage Stability Index (VSI) Before & After Placement of TCSC
Name of the Bus
VSI Before TCSC VSI After TCSC
Lake 0.0354 0.0279
Main 0.0358 0.0357
Elm 0.0391 0.0253
Elmfa ---- 0.0226
Table 2: Analysis of Voltage magnitudes, Phase Angles for IEEE 5-bus test system with & without TCSC
Name of the Bus
Before Placement of TCSC
After Placement of TCSC VM (p.u) VA (deg) VM(p.u) VA(deg)
North 1.060 0.000 1.060 0.000 South 1.000 -2.061 1.000 -2.346 Lake 0.987 -4.637 0.998 -3.697 Main 0.984 -4.957 0.970 -6.544
Elm 0.972 -5.765 0.968 -6.530
Elmfa --- ---- 0.970 -6.534
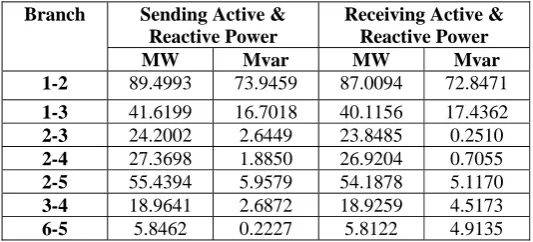
Table 3: Analysis of Sending, Receiving Active & Reactive Power for IEEE 5-Bus test system with TCSC
Branch Sending Active & Reactive Power
Receiving Active & Reactive Power
MW Mvar MW Mvar
1-2 89.4993 73.9459 87.0094 72.8471
1-3 41.6199 16.7018 40.1156 17.4362
2-3 24.2002 2.6449 23.8485 0.2510
2-4 27.3698 1.8850 26.9204 0.7055
2-5 55.4394 5.9579 54.1878 5.1170
3-4 18.9641 2.6872 18.9259 4.5173
6-5 5.8462 0.2227 5.8122 4.9135
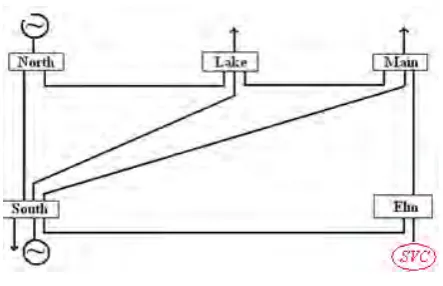
ii. Location of SVC
Fig. 5 IEEE 5 Bus Test System with SVC
Table 4: VSI Before & After Placement of SVC Name of the
Bus
VSI Before SVC
VSI After SVC
Lake 0.0299 0.0298
Main 0.0304 0.0286
Elm 0.0328 0.0099
Table 5: Analysis of Voltage magnitudes, Phase Angles for IEEE 5-bus test system without and with SVC
Name of the Bus
Before Placement of SVC
After Placement of SVC
VM (p.u) VA (deg) VM(p.u) VA(deg)
North 1.060 0.000 1.060 0.000 South 1.000 -2.057 1.000 -2.063 Lake 0.993 -4.716 0.993 -4.713 Main 0.989 -5.034 0.991 -5.058
Elm 0.978 -5.849 1.000 -6.215
Table 6: Analysis of Sending, Receiving Active & Reactive Power for IEEE 5-Bus test system with SVC
Branch Sending Active & Reactive Power
Receiving Active & Reactive Power
MW Mvar MW Mvar
1-2 89.38 73.97 86.90 72.89
1-3 41.79 14.49 40.34 15.40
2-3 24.35 05.43 23.99 02.55
2-4 27.60 05.47 27.14 02.91
2-5 54.95 17.63 53.64 18.57
3-4 19.32 02.15 19.29 00.30
4-5 06.42 08.20 06.36 03.43
4.2IEEE 14-Bus Test System
i. Location of TCSC
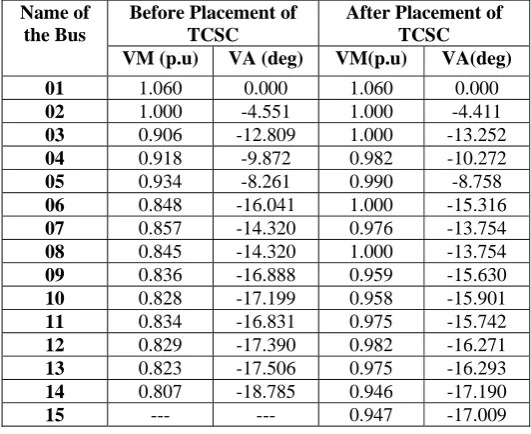
Table 7: Analysis Voltage magnitudes, Phase Angles for IEEE 14-bus test system without and with TCSC
Name of the Bus
Before Placement of TCSC
After Placement of TCSC VM (p.u) VA (deg) VM(p.u) VA(deg)
01 1.060 0.000 1.060 0.000
02 1.000 -4.551 1.000 -4.411
03 0.906 -12.809 1.000 -13.252
04 0.918 -9.872 0.982 -10.272
05 0.934 -8.261 0.990 -8.758
06 0.848 -16.041 1.000 -15.316
07 0.857 -14.320 0.976 -13.754
08 0.845 -14.320 1.000 -13.754
09 0.836 -16.888 0.959 -15.630
10 0.828 -17.199 0.958 -15.901
11 0.834 -16.831 0.975 -15.742
12 0.829 -17.390 0.982 -16.271
13 0.823 -17.506 0.975 -16.293
14 0.807 -18.785 0.946 -17.190
15 --- --- 0.947 -17.009
Table 8: Analysis of Sending, Receiving Active & Reactive Power for IEEE 14 Bus test system with TCSC
Branch Sending Active & Reactive Power
Receiving Active & Reactive Power
MW Mvar MW Mvar
1-2 157.80 59.63 152.86 47.35
2-3 74.84 12.86 72.14 22.03
2-4 55.19 6.04 53.40 9.62
1-5 76.52 18.74 73.51 8.90
2-5 41.13 7.04 40.14 8.37
3-4 22.06 19.04 22.65 19.23
4-5 60.67 0.77 61.18 0.22
5-6 44.88 1.28 44.88 6.46
4-7 27.83 3.91 27.83 2.20
7-8 0.00 13.54 0.00 13.88
4-9 15.80 4.93 15.80 3.35
7-9 27.83 15.74 27.83 14.56
9-10 4.78 0.92 4.77 0.94
6-11 7.92 8.96 7.78 8.67
6-12 7.94 3.20 7.85 3.01
6-13 17.82 9.96 17.55 9.41
9-14 9.35 0.49 9.22 0.23
10-11 4.23 6.74 4.28 6.87
12-13 1.75 1.41 1.74 1.40
13-14 5.78 5.02 5.68 4.80
ii. Location of SVC
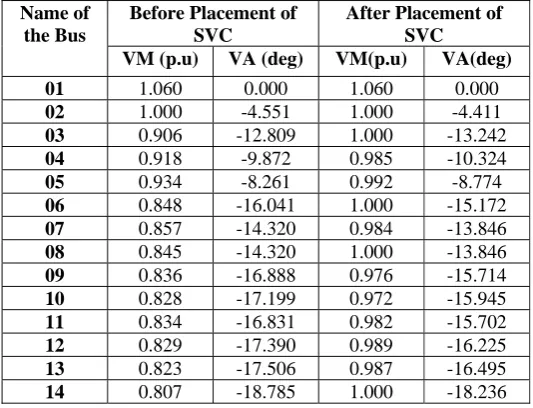
Table 9: Analysis of Voltage magnitudes, Phase Angles for IEEE 14-bus test system without and with SVC
Name of the Bus
Before Placement of SVC
After Placement of SVC
VM (p.u) VA (deg) VM(p.u) VA(deg)
01 1.060 0.000 1.060 0.000
02 1.000 -4.551 1.000 -4.411
03 0.906 -12.809 1.000 -13.242
04 0.918 -9.872 0.985 -10.324
05 0.934 -8.261 0.992 -8.774
06 0.848 -16.041 1.000 -15.172
07 0.857 -14.320 0.984 -13.846
08 0.845 -14.320 1.000 -13.846
09 0.836 -16.888 0.976 -15.714
10 0.828 -17.199 0.972 -15.945
11 0.834 -16.831 0.982 -15.702
12 0.829 -17.390 0.989 -16.225
13 0.823 -17.506 0.987 -16.495
14 0.807 -18.785 1.000 -18.236
Table 10: Analysis of Sending, Receiving Active & Reactive Power for IEEE 14 Bus test system with SVC
Branch Sending Active & Reactive Power
Receiving Active & Reactive Power
MW Mvar MW Mvar
1-2 157.79 59.63 152.86 47.35
2-3 74.76 12.85 72.07 22.00
2-4 55.35 7.57 53.55 11.20
1-5 76.58 17.90 73.58 8.12
2-5 41.05 8.04 40.06 9.37
3-4 22.13 17.46 22.69 17.75
4-5 61.65 3.18 62.17 2.15
5-6 43.87 0.70 43.87 5.63
4-7 28.48 1.05 28.48 0.71
7-8 0.00 8.72 0.00 8.85
4-9 16.23 2.32 16.23 0.78
7-9 28.48 8.01 28.48 7.02
9-10 5.40 2.32 5.39 2.29
6-11 7.21 5.53 7.13 5.36
6-12 7.53 0.90 7.46 0.75
6-13 17.93 0.86 17.71 0.44 9-14 9.80 12.93 9.45 13.68
10-11 3.61 3.51 3.63 3.56
12-13 1.36 0.85 1.36 0.85
5. CONCLUSION
In this paper, a new method for optimal placement and parameters settings of SVC and TCSC has been proposed for improving voltage profile in a power system. The proposed approach has been implemented on IEEE 5-bus and IEEE 14-Bus system. The criteria for selection of optimal placement of SVC and TCSC were to maintain the voltage profile, minimize the voltage deviations and to reduce the power losses using VSI. Simulations performed on the test system shows that the optimally placed SVC and TCSC maintains the voltage profile, minimizes the deviations and also reduces the real and reactive power losses.
6. REFERENCES
[1] N. G. Hingorani, “Power electronics in electrical utilities: role of power electronics in future power systems,” Proceedings of the IEEE Vol. 76 No.4, pp.481-482, Apr. 1988
[2] N. G. Hingorani and L. Gyugyi, “Understanding FACTS-concepts and technology of flexible AC transmission systems,” IEEE press,
First Indian Edition, 2001.
[3] K. P. Wang, J. Yurevich, A. Li, “Evolutionary- programming-based load flow algorithm for systems containing unified power flow controllers,” IEE Proc.-Gener. Transm .Distribute Vol.150, No. 4, Jul. 2003.
[4] Paserba, N.Miller, E.Laesen and R.Piwko,” A Thyristor controlled series compensation model for power system stability analysis," IEEE Trans.on Power-Delivery, vol. 10, pp.1471-1478, 1995.
[5] Jose A. D. N, Jose L. B. A, Alexis D, Durlym R and Emilio P.V, “Optimal parameters of FACTS devices in electic power systems applying evolutionary strategies,” Electrical Power and Energy Syst., vol. 29, pp.83- 90, 2007.
[6] Garng Huang and Tong Zhu, “TCSC as a transient voltage stabilizing controller,” IEEE conference proceeding, pp.628-633., 2001. [7] C.R.Fuerte-Esquivel, E.Acha, “Unified power flow controllere: a critical comparsion of Newton-Raphson UPFC algorithms in power
flow studies”, IEE Proceedings on Generation, Transmission, Distribution, Vol. 144, No. 5, pp. 437–443, Sept 1997.
[8] C.R.Fuerte-Esquivel, E.Acha, and H.Ambriz-Perez,"A Thyristor Controlled Series Compensator Model for the Power Flow Solution of Practical Power Networks", IEEE Trans.Power Systems Vol 15(1), pp 58-64 Feb 2000.
[9] T.T. Lie and W. Deng, “Optimal Flexible AC transmission systems (FACTS) devices allocation”, Electr. Power Energy Systems. 19 (2), 1999, pp. 125–134.
[10] G. W. Stagg, and A. H. El-Abiad, Computer Methods in Power System Analysis, McGraw-Hill, 1968.