University of Pennsylvania
ScholarlyCommons
Publicly Accessible Penn Dissertations
1-1-2015
Detecting Selection on Noncoding Nucleotide
Variation: Methods and Applications
Yang Ding
University of Pennsylvania, [email protected]
Follow this and additional works at:http://repository.upenn.edu/edissertations
Part of theBioinformatics Commons,Biology Commons, and theEvolution Commons
Recommended Citation
Ding, Yang, "Detecting Selection on Noncoding Nucleotide Variation: Methods and Applications" (2015).Publicly Accessible Penn Dissertations. 1687.
Detecting Selection on Noncoding Nucleotide Variation: Methods and
Applications
Abstract
There has been a long tradition in molecular evolution to study selective pressures operating at the amino-acid level. But protein-coding variation is not the only level on which molecular adaptations occur, and it is not clear what roles non-coding variation has played in evolutionary history, since they have not yet been systematically explored. In this dissertation I systematically explore several aspects of selective pressures of noncoding nucleotide variation:
The first project (Chapter 2) describes research on the determinants of eukaryotic translation dynamics, which include selection on non-coding aspects of DNA variation. Deep sequencing of ribosome-protected mRNA fragments and polysome gradients in various eukaryotic organisms have revealed an intriguing pattern: shorter mRNAs tend to have a greater overall density of ribosomes than longer mRNAs. There is debate about the cause of this trend. To resolve this open question, I systematically analysed 5’ mRNA structure and codon usage patterns in short versus long genes across 100 sequenced eukaryotic genomes. My results showed that compared with longer ones, short genes initiate faster, and also elongate faster. Thus the higher ribosome density in short eukaryote genes cannot be explained by translation elongation. Rather it is the translation initiation rate that sets the pace for eukaryotic protein translation. This work was followed by modelling studies of translation dynamics in a yeast cell.
Chapter 3 concerns detecting selective pressures on the viral RNA structures. Most previous research on RNA viruses has focused on identifying amino-acid residues under positive or purifying selection, whereas
selection on RNA structures has received less attention. I developed algorithms to scan along the viral genome and identify regions that exhibit signals of purifying or diversifying selection on RNA structure, by comparing the structural distances between actual viral RNA sequences against an appropriate null distribution. Unlike other algorithms that identify structural constraints, my approach accounts for the phylogenetic relationships among viral sequences, as well the observed variation in amino-acid sequences. Applied to Influenza viruses, I found that a significant portion of influenza viral genomes have experienced purifying selection for RNA structure, in both the positive- and negative-sense RNA forms, over the past few decades; and I found the first evidence of positive selection on RNA structure in specific regions of these viral genomes.
Overall, the projects presented in these chapters represent a systematic look at several novel aspects of selection on noncoding nucleotide variation. These projects should open up new directions in studying the molecular signatures of natural selection, including studies on interactions between different layers at which selection may operate simultaneously (e.g. RNA structure and protein sequence).
Degree Type
Dissertation
Degree Name
Doctor of Philosophy (PhD)
First Advisor
Joshua B. Plotkin
Keywords
Codon Usage Bias, Natural Selection, Protein Translation, RNA Structure
Subject Categories
DETECTING SELECTION ON NONCODING NUCLEOTIDE VARIATION: METHODS AND APPLICATIONS
COPYRIGHT
2015
Yang Ding
This work is licensed under the Creative Commons Attribution- Non-Commercial-ShareAlike 4.0 International License
To view a copy of this license, visit
ACKNOWLEDGEMENT
I would first like to thank my advisor, Joshua Plotkin for his unconditional support in
the past five years. Whenever I encountered a difficult situation in my PhD study such as
the collapse of my results due to a newly discovered bug in my code, he would always
assure me everything would be fine, and we could look at the results together and find a
way to fix it. I also had the unthinkable freedom in the past five years to pursue whatever
research projects I found most interesting. For these and many other aspects I am deeply
grateful to him. I would also like to thank my thesis committee members, Professors Paul
Schmidt, Paul Sniegowski, Scott Poethig, Brian Gregory and Junhyong Kim, for taking
the time to give me insightful suggestions and comments on my research, which have
substantially improved many aspects of this dissertation. I also would like to thank many
professors I took courses or interacted with during my PhD, an incomplete list including
Professors Larry Shepp, Junhyong Kim, Rick Bushman, Michael Steele, Itay Goldstein
and Christopher Chen. Their knowledge and wisdom changed the way I think about the
world around me, as well as how to conduct scientific research.
I would like to thank my lab members and friends Oana Carja, Premal Shah, David
McCandlish, Mitchell Newberry, Jakub Otwinowski, Davorka Gulisija, Alex Stewart, Jia
He, Ami Tiyaboonchai, Swathi Ayloo, Tanya Singh, Matias Matiesco, Christel Chehoud,
Alexandra Brown, Michael Warner, Kevin Hong, Tianpu Zhang, Kaixuan Yang, Guyue
Li, among many others. Without their emotional support I would not have survived my
In the end I would like to thank my family, parents and grandparents. I grew up in a
family where my parents and grandparents from both sides are all schoolteachers or
agricultural experts, so I inherited from them the love for nature and respect for
knowledge. As a child I was encouraged to buy and read countless number of books, and
one of my favorite genre was popular science books. That was the early inspiration for
me to later start a career in scientific research. I thus would like to dedicate my
dissertation to family.
ABSTRACT
DETECTING SELECTION ON NONCODING NUCLEOTIDE VARIATION: METHODS AND APPLICATIONS
There has been a long tradition in molecular evolution to study selective pressures
operating at the amino-acid level. But protein-coding variation is not the only level on
which molecular adaptations occur, and it is not clear what roles non-coding variation has
played in evolutionary history, since they have not yet been systematically explored. In
this dissertation I systematically explore several aspects of selective pressures of
noncoding nucleotide variation:
The first project (Chapter 2) describes research on the determinants of eukaryotic
translation dynamics, which include selection on non-coding aspects of DNA variation.
Deep sequencing of ribosome-protected mRNA fragments and polysome gradients in
various eukaryotic organisms have revealed an intriguing pattern: shorter mRNAs tend to
have a greater overall density of ribosomes than longer mRNAs. There is debate about
the cause of this trend. To resolve this open question, I systematically analysed 5’ mRNA
structure and codon usage patterns in short versus long genes across 100 sequenced
eukaryotic genomes. My results showed that compared with longer ones, short genes
initiate faster, and also elongate faster. Thus the higher ribosome density in short
eukaryote genes cannot be explained by translation elongation. Rather it is the translation
initiation rate that sets the pace for eukaryotic protein translation. This work was
Chapter 3 concerns detecting selective pressures on the viral RNA structures.
Most previous research on RNA viruses has focused on identifying amino-acid residues
under positive or purifying selection, whereas selection on RNA structures has received
less attention. I developed algorithms to scan along the viral genome and identify regions
that exhibit signals of purifying or diversifying selection on RNA structure, by comparing
the structural distances between actual viral RNA sequences against an appropriate null
distribution. Unlike other algorithms that identify structural constraints, my approach
accounts for the phylogenetic relationships among viral sequences, as well the observed
variation in amino-acid sequences. Applied to Influenza viruses, I found that a significant
portion of influenza viral genomes have experienced purifying selection for RNA
structure, in both the positive- and negative-sense RNA forms, over the past few decades;
and I found the first evidence of positive selection on RNA structure in specific regions
of these viral genomes.
Overall, the projects presented in these chapters represent a systematic look at
several novel aspects of selection on noncoding nucleotide variation. These projects
should open up new directions in studying the molecular signatures of natural selection,
including studies on interactions between different layers at which selection may operate
TABLE OF CONTENTS
LIST OF TABLES ... viiii
LIST OF FIGURES ... ix
Chapter One. Introduction ... 1
The role of natural selection in molecular evolution ... 1
Different modes and sources of natural selection ... 4
Methods to detect signatures of natural selection ... 6
Protein translation dynamics and ribosome profiling: a role for selection? ... 9
Prediction and measurement of RNA secondary structures ... 11
Evolution of influenza A viral genomes ... 14
Overview of the dissertation ... 16
Chapter Two. Systematically Weaker 5’-mRNA Secondary Structures in Short Eukaryotic Genes ... 21
Abstract ... 21
Introduction ... 21
Results ... 24
Discussion ... 34
Methods ... 37
Chapter Three. Signatures of Natural Selection on RNA Structures in Influenza A Viruses Abstract ... 40
Introduction ... 41
Results ... 42
Discussion ... 62
Materials and Methods ... 64
Chapter Four. Conclusion and Future Directions ... 72
LIST OF TABLES
Chapter 1
NONE
Chapter 2
Table 1. Most eukaryotic species show a tendency towards weak 5’ mRNA structure and high 5’ codon bias in shorter genes. ... 29 Table 2. Most species exhibit a tendency towards weak 5’ free energy in short genes,
even after controlling for 5’ CAI. ... 33
Chapter 3
NONE
Chapter 4
LIST OF FIGURES
Chapter 1
NONE
Chapter 2
Figure 1. Short C.elegans genes have higher 5’ mRNA folding energies than long C.
elegans genes, suggesting faster initiation in short genes ... 27
Figure 2. Short C.elegans genes have higher 5’ CAIs than long C. elegans genes,
suggesting faster elongation in short genes ... 27 Figure 3. The distribution of Spearman Rank Correlation Coefficients between 5’ Energy
and ORF length in 120 eukaryotic species ... 30 Figure 4. The distribution of Spearman Rank Correlation Coefficients between 5’ CAI
and ORF length in 89 eukaryotic species ... 31
Chapter 3
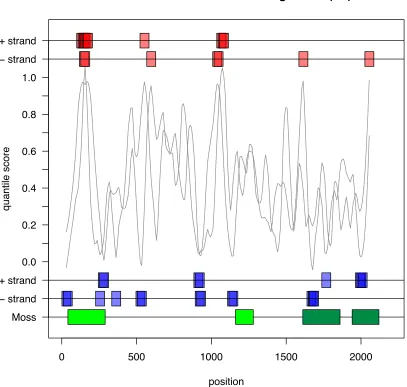
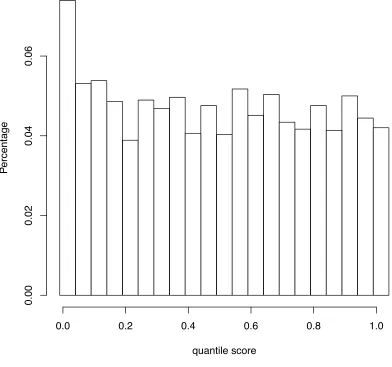
Figure 1. Distribution of quantile scores from all the 8 segments of Human vs. Avian influenza A viruses, under pairwise analysis ... 46 Figure 2. Quantile scores from Pairwise Selection Detection Algorithm for influenza A
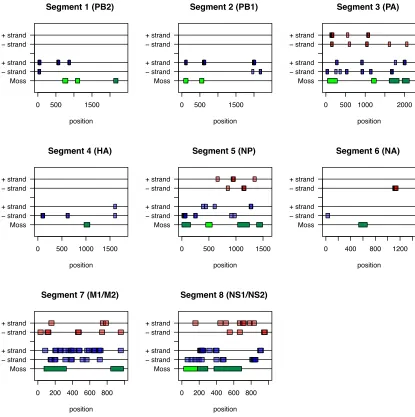
segment 3 (PA) using avian- and human-derived influenza viral samples ... 49 Figure 3. Quantile scores from Pairwise Selection Detection Algorithm for all segments
using avian- and human-derived influenza A viral samples ... 50 Figure 4. Distribution of quantile scores from all the 8 segments of Human H1N1
influenza A viruses ... 54 Figure 5. Quantile scores for all segments of influenza A H1N1 and H3N2 subtypes. ... 57 Figure 6. Quantile scores vs. dN/dS values for all segments of the human H1N1 subtype.
... 59 Figure 7. An illustration of the pairwise algorithm to detect selection. ... 67 Figure 8. An illustration of the phylogeny-controlled algorithm to detect selection. ... 69 Supplementary Figure 1. Distribution of quantile scores from all the 8 segments of
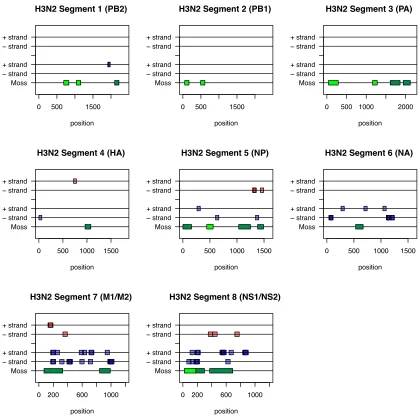
Human H3N2 influenza A viruses ... 71
Chapter 4
Chapter One
Introduction
The role of natural selection in molecular evolution
Genetic drift and natural selection are the two principal forces that shape the
evolutionary history of cellular organisms and viruses. Genetic drift is a stochastic force
that causes the random fluctuations in allele and phenotypic frequencies without
conferring any fitness advantages, whereas natural selection influences allele frequencies
deterministically by differential reproduction. Identifying genomic sites that are subject
to natural selection has profound intellectual and practical implications.
First, there has been a long-standing debate in evolutionary biology about the
relative roles of genetic drift and natural selection in shaping observed molecular
variation(Nei, Suzuki, and Nozawa 2010; Fay 2011; Barrett and Hoekstra 2011). Charles
Darwin advocated natural selection as the main force in shaping evolutionary history in
his On the Origin of Species (Darwin 1859), although, admittedly at the time he was not
aware of or discussing molecular phenotypes. Since then, many instances of adaptation
on the morphological level have been studied and documented in detail. With the dawn of
molecular biology and the development and application of a series of techniques to
measure protein sequence variation (Hubby and Lewontin 1966; Harris 1966) in the
1960s, however, a surprisingly large amount of protein variation was observed among
different species, as well as among individuals within a single species. This posed serious
neutral theory of molecular evolution (Kimura 1983). The neutral theory contends that
most observed molecular variation is due to random fixation of neutral mutations that do
not bear any selective advantages. Nonetheless, in the past decade, increasingly more
convincing instances of molecular adaptation have been identified, with their fitness
advantages and proximate molecular mechanism sorted out. The availability of whole
genome assays and sequences from many different species and individuals has prompted
many whole-genome scans (for a partial list see (Haasl and Payseur 2015) ) for sites
under positive selection in human lineages (Grossman et al. 2013; Lachance and Tishkoff
2013; Enard, Messer, and Petrov 2014), Drosophila Melanogaster (Sella et al. 2009;
Langley et al. 2012; Pool et al. 2012; Fabian et al. 2012; Reinhardt et al. 2014; Bergland
et al. 2014), Arabidopsis thaliana(Hancock et al. 2011; Huber et al. 2014), among many
others. Now we know that there are many confirmed loci in the eukaryotic genomes that
are undergoing adaptation, with many more candidate sites waiting to be validated.
One of the central topics in evolutionary biology remains the study of the
molecular and mechanistic basis of positive selection, i.e. adaptation. How do organisms
respond to new environmental pressures? Do adaptive changes mostly happen in the
protein-coding genes or regulatory sequences? Do adaptations mostly come from newly
arisen advantageous alleles or from standing variations? Is genetic adaptation more likely
to be driven by a small number of alleles that have a large effect, or by a large number of
alleles that have relatively moderate effects? These questions are still attracting much
Studying genomic sites under selection has practical implications as well.
Sequence and structural conservation, a strong signal for negative selection, has been
used extensively in the comparative genomics and RNA bioinformatics community to
identify functional genetic elements. The conserved sites in the genomes can be
protein-coding genes, nonprotein-coding RNAs, microRNA targets, transcription factor binding sites or
other regulatory sequences.
Identifying genomic sites under selection also offers great potential for
biomedical applications. Infectious pathogens have been shown to be among the strongest
sources of selective pressures on human populations during local adaptation (Fumagalli
et al. 2011; Karlsson, Kwiatkowski, and Sabeti 2014). For example, analyzing the
genomic loci that are associated with elevated immune response against malaria can
potentially offer novel therapeutic strategies for malaria treatment (Kwiatkowski 2005).
Also recent research suggests that even the contemporary human population is under
constant selective pressures for certain phenotypic traits (Byars et al. 2010; Stearns et al.
2010; Milot et al. 2011), many of which are probably related to human health and
diseases. Understanding the selective pressures that we are currently experiencing is
likely to help the treatment and prevention of these diseases.
Understanding the major adaptations during human evolution will help us
recapitulate important historical events that have shaped our species. A notable example
is the research showing that lactase expression in adults has independently arisen at least
twice during human evolution (Bersaglieri et al. 2004; Tishkoff et al. 2007), the timing of
practice of pastoralism in East Africa, respectively. Further explorations of
whole-genome sequencing data from multiple human populations will undoubtedly reveal more
interesting stories about important periods in human history.
Equally interesting, and just as practical, are the questions of selection pressures
on microbial pathogens themselves, often mediated by host immune systems or
requirements for host specificity. These questions are particularly acute for rapidly
evolving viruses, which must regularly contend with immune or chemotherapeutic
pressure, and whose course of evolution, in turn, may inform vaccination of drug
treatment decisions.
Different modes and sources of natural selection
The simplest mode of natural selection is directional selection. There are two
types of directional selection: negative (purifying) selection refers to the selective
elimination of deleterious alleles, while positive selection drives evolutionary innovation
by promoting the spread of beneficial alleles. The melanism of pepper moth (Cook et al.
2012) is a classic example in directional natural selection. This happened in the mid - 19th
century at Manchester, England, when industrial revolution turned Manchester into an
industrial city, and the tree barks were darkened by soot from the new coal-burning
factories. Previously dominant light-colored pepper moths suddenly contrasted with the
color of the barks, while the dark-colored moths were camouflaged well by the darkened
trees. This led to increased predation of the light-colored moths by predating birds, and
light-colored moths almost went extinct. Whereas the mechanistic details of this classic
example of directional selection remain hotly contested, because some of the original
field experiments were flawed (Majerus 1998), the example remains a classic story (if
partly fictional) of directional selection in the wild.
More complicated selective scenarios include balancing selection, where multiple
alleles are maintained at an appreciable frequency in the gene pool. One recent example
(Bergland et al. 2014; Behrman et al. 2015; X. Zhao et al. 2015) is in Drosophila species.
One study (Bergland et al. 2014) found hundreds of polymorphisms that undergo
dramatic seasonal shift in allele frequencies in Drosophila Melanogaster, suggesting
temporally varying selective pressures. In particular, stress tolerance traits such as chill
coma recovery time and starvation tolerance seem to be favored in winter, and disfavored
during summer, when they are no longer needed.
Not only there are different modes of natural selection, selective pressures can
also occur on many different levels of biological organization. There can be a single
preferred amino acid mutation - for example, a single amino acid mutation in
melanocortin-1 receptor (Mc1r) turned Florida’s Gulf Coast beach mice into light-color,
which helped them evade their visual predators (Hoekstra et al. 2006). There can also be
mutations in regulatory elements – two different SNPs in the 13th introns of gene MCM6
can enhance the promoter activity of the lactase encoding gene LCT in African and
European populations (Tishkoff et al. 2007), thus gave them survival advantages for
Recently it has been increasing appreciated that coding sequences harbor
numerous regulatory sites that are independent of their protein-coding function (Plotkin
and Kudla 2011), such as RNA localization(Jambhekar and Derisi 2007), translation
efficiency(Sharp and Li 1987), mRNA splicing (Fairbrother et al. 2002), mRNA stability
(Kudla et al. 2006) and accessibility to the translation machinery (Nackley et al. 2006).
As an example, it has been shown that in virtually all free-living (Keller et al. 2012; Gu,
Zhou, and Wilke 2010) and many viral species (Zhou and Wilke 2011) the region around
the translation start site of each mRNA transcript is under natural selection to be less
structured, presumably for the efficient recognition of the start codon by initiator-tRNAs.
The role of selection on these non-coding sites remains largely unexplored, and is the
central theme in this dissertation.
Methods to detect signatures of natural selection
Methods to detect signatures of natural selection can be broadly divided into two
classes: Methods to detect selection on the macro-evolutionary level based on
comparisons of different species and their relative rates of genetic change, and
population-genetics methods to detect selection occurring within a population, often
including comparison to one outgroup species (Vitti, Grossman, and Sabeti 2013).
Methods to detect micro-evolutionary (within-population) selection include
site-frequency based methods (Ewens 1972; Watterson 1978; Fu and Li 1993; Fu 1997;
Tajima 1989; Tajima 1993; Fay 2011), linkage disequilibrium based methods (Sabeti et
E. T. Wang et al. 2006; Cai et al. 2011; Han and Abney 2013) and population
differentiation based methods (Bonhomme et al. 2010; Excoffier, Hofer, and Foll 2009;
Lewontin and Krakauer 1973; Vitalis, Dawson, and Boursot 2001; Shriver et al. 2004;
Fariello et al. 2013). There are also methods that combine the signals from these different
methods (Kim and Nielsen 2004; Kim and Stephan 2002; Nielsen et al. 2009; Nielsen et
al. 2005; Hua Chen, Patterson, and Reich 2010; Zeng et al. 2006; Zeng, Shi, and Wu
2007; Grossman et al. 2010; Grossman et al. 2013). Site frequency methods consider the
distribution of frequencies of a set of SNPs in a population, where a surplus of rare alleles
would be indicative of recent positive selection or population expansion. Linkage
disequilibrium methods search for genomic regions with an unexpected low degree of
genetic diversity, called high linkage-disequilibrium, presumably because a newly
emerged advantageous mutation has swept through the entire population. Population
differentiation methods use measures such as the fixation index (FST) to measure genetic
differences within a population vs. between populations, and a high level of FST would
imply that all genetic variation could be explained by population structure, and the two
populations do not share much gene flow.
The methods for macro-evolutionary selection compare the orthologous genes from
multiple species to see if there is a signal of natural selection over long timescales. There
are two well-known methods in this category: the first is the McDonald-Kreitman test
(Hudson, Kreitman, and Aguade 1987; McDonald and Kreitman 1991; Egea, Casillas,
and Barbadilla 2008), which compares the ratio of synonymous vs. nonsynonymous
that an advantageous mutation will quickly fix within a species and lead to the fixed
differences among species, thus adaptive mutations should contribute more to
between-species substitutions than within-between-species polymorphisms. The second method, which uses
no within-population data at all, is the dN/dS test (Goldman and Yang 1994; Yang 2000;
Hurst 2002), which compares the rates of synonymous and non-synonymous substitution
rates across evolutionarily divergent lineages. It is assumed that synonymous
substitutions among species are strictly neutral. If there is no selective pressure operating,
then the rates of synonymous and non-synonymous substitutions are expected to be equal.
If the rate of synonymous substitution is higher, then it means the protein is under
negative selection to keep the amino acid sequence intact, while a higher
non-synonymous substitution rate would imply the protein is under pressure to change its
content, probably for the need to adapt to new environments.
Several variations of dN/dS test have been introduced. For examples, (Hoffman
and Birney 2007) proposed to use nucleotide substitution rate in pairs of orthologous
introns, and use this measure dI as an alternative of dS. In another study, (Hoffman and
Birney 2010) proposed a dT/dS test to study the natural selection on promoter sequences,
in this test dT denotes the TF binding affinity changes of the promoter. Also inspired by
the dN/dS test, (Han Chen et al. 2015; Han Chen, Xing, and He 2015) proposed dJ/dS
and dT/dS to study cancer driver genes, where dJ denotes the mutation rate at exon/intron
junction and dT denotes the rate of truncating mutations.
Most of the methods mentioned above assume a scenario of hard sweep, i.e. a
population. However there are many more complicated scenarios of natural selection. For
example, there may be soft selective sweeps (Messer and Petrov 2013), in which multiple
adaptive alleles sweep through the population at the same time. This happened when
brown rats rapidly developed several different allele variants of the gene encoding
vitamin K epoxide reductase complex subunit 1 (VKORC1) in response to the
rodenticide warfarin (Pelz et al. 2005). Several methods (Messer and Neher 2012; Garud
et al. 2015) have been developed to detect selection in this more complicated scenario.
Protein translation dynamics and ribosome profiling: a role for selection?
One of the more intriguing objects of natural selection – which has not received
considerable attention yet – is selection on translational efficiency and accuracy. Protein
translation is arguably one of the most fundamental biological activities that occur in a
living cell. Although individual steps in translation such as the formation of the 43S
preinitiation complex are known intricate molecular detail, a global understanding of how
these steps combine to set the pace of protein production for individual genes remains
elusive (Jackson, Hellen, and Pestova 2010; Plotkin and Kudla 2011). Various factors
such as codon usage bias, gene length, transcript abundance, and translation initiation rate
are all known to modulate protein synthesis (Bulmer 1991; Chamary and Hurst 2005;
Cannarozzi et al. 2010; Tuller et al. 2010; Shah and Gilchrist 2011; Plotkin and Kudla
2011; Gingold and Pilpel 2011; Chu, Barnes, and Haar 2011; Chu and Haar 2012), but
how they interact with each other to collectively determine translation rates of all genes
some of the critical parameters in a cellular process, such as gene-specific rates of 5’UTR
scanning and start codon recognition. As a result, fundamental questions such as the
relative role of translation initiation vs. elongation in setting the pace of protein
production were actively debated (Kudla et al. 2009; Tuller et al. 2010; Gingold and
Pilpel 2011; Chu, Barnes, and Haar 2011; Chu and Haar 2012; Y. Ding, Shah, and
Plotkin 2012).
Thanks to the development of expression profiling technologies such as
microarrays (Brown and Botstein 1999) and mRNA sequencing (RNA-seq) (Z. Wang,
Gerstein, and Snyder 2009) in the past two decades, we now have the ability to
simultaneously monitor the mRNA levels of tens of thousands of genes and their changes
under various physiological conditions. However, it has been repeatedly shown that
transcriptional regulation is only half the story (Plotkin 2010) – the correlation between
protein levels and mRNA levels is often weak, and this is at least partially due to the
effect of translational regulation. Thus direct analyses of the translation processes can
provide a more complete and accurate picture of gene expression in cells than mRNA
levels alone. Ribosome profiling, which was first introduced in 2009 (Ingolia et al. 2009),
is a deep-sequencing based technology to measure the global cellular translational
activity in vivo (Ingolia 2014; Brar et al. 2012). It leverages the observation that a
translating ribosome can protect about 30 nucleotides of an mRNA from nuclease activity,
and by sequencing these remaining 30 nucleotides one can see the “ribosome footprints”
Ribosome profiling has provided us with a much more detailed view of protein
translation dynamics, and helped us resolve many of the outstanding questions and debate
in the field of protein translation dynamics (Ingolia 2014; Brar and Weissman 2015). For
example, (Shah et al. 2013) developed a whole-cell stochastic model of yeast translation
process and used the ribosome-profiling data from (Ingolia et al. 2009) to parameterize
the model. The model showed translation initiation, rather than elongation, is the
rate-limiting step in yeast endogenous protein translation. (Weinberg et al. 2015) compared
multiple ribosome profiling datasets from yeast (Ingolia et al. 2009; Gerashchenko,
Lobanov, and Gladyshev 2012; Zinshteyn and Gilbert 2013; Artieri and Fraser 2014;
Guydosh and Green 2014; McManus et al. 2014; Weinberg et al. 2015), and showed that
a simple multiple linear regression using six features, including mRNA abundance,
upstream open reading frames, cap-proximal RNA structure and GC content, length of
coding and 5’UTR regions, can explain most of the observed variation in yeast translation
efficiency.
The extent to which selection on non-coding sequence variation is mediated by
requirements for gene translation – and variation in these requirements across genes –
remains largely unexplored and is one of the central topics of this dissertation.
Prediction and measurement of RNA secondary structures
RNAs play vital roles in myriad cellular functions, including transcription, RNA
processing, and translation. They adopt complex structures to perform their functional
RNA molecules that can change their structural conformations (Breaker 2011; Breaker
2012) upon the binding of certain metabolites, and switch a gene “on” or “off”. Here I
review some basic biology and computational work on RNA structure, with an eye
towards eventual analysis of natural election on RNA structures.
RNA secondary structures refer to all the base-pairing inside the RNA molecule.
Pseudoknots refer to a special class of secondary structures where a nucleotide inside a
loop forms base pair with a nucleotide outside this region. The prediction of pseudoknots
is NP-complete in general (Lyngsø and Pedersen 2000), but some restricted classes of
pseudoknots are still computational tractable (Rivas and Eddy 1999; Dirks and Pierce
2004; Ren et al. 2005; Cao and Chen 2006), although at a much higher computational
complexity than predicting the plenary secondary structures. RNA tertiary structures refer
to the 3D structure of an RNA molecule. Although there have been several recent
attempts in prediction RNA tertiary structures (Das and Baker 2007; F. Ding et al. 2008;
Parisien and Major 2008; Frellsen et al. 2009; Jonikas et al. 2009; Popenda et al. 2012; Y.
Zhao et al. 2012; Kerpedjiev, Höner Zu Siederdissen, and Hofacker 2015), the field of
RNA tertiary structure prediction is still in its infancy, and there are currently no
algorithms that can reliably predict tertiary structures from RNA sequences alone.
Because of the above reasons, in the remainder of this dissertation we will focus on
pseudo-knot free RNA secondary structures.
Broadly speaking, there are three strategies in predicting RNA secondary
structures: There are two approaches to predict RNA secondary structures: One is
RNA sequences from multiple species (Knudsen and Hein 2003; J. S. Pedersen et al.
2006; Nawrocki, Kolbe, and Eddy 2009). The idea is that although the primary sequences
may change, RNA base pairs will co-vary so as to maintain the secondary structures.
Another approach is to use thermodynamics-based algorithms (Zuker 1989; Hofacker et
al. 1994; Reuter and Mathews 2010), in which the RNA secondary structures are
classified as structural motifs such as hairpins, bulges, internal loops and multiloops, each
of which are assigned an experimentally-derived energy score, and the secondary
structure is predicted as the one with the minimum free energy. Also there are algorithms
that combine these two signals(Havgaard, Torarinsson, and Gorodkin 2007; Reuter and
Mathews 2010), but they are also computationally more expensive. Although these
approaches have been widely used by experimental and computational biologists, the
accuracy of the structure prediction algorithms is still pretty limited. The RNA
community has long suffered from the lack of high-throughput, accurate measurements of
RNA secondary structures. The situation has recently changed due to the development of
several sequencing-based RNA structure probing technologies(Kwok et al. 2015; Foley et
al. 2015). These techniques have allowed the experimental measurements of RNA base
pairings on a whole transcriptome level and will greatly facilitate our understanding of
the roles that RNA structures play in various cellular processes.
As with translation, the extent to which non-coding variation in genomes is
subject to selection pressures mediated by requirements for proper RNA structure
Evolution of influenza A viral genomes
Influenza A viruses (Nelson and Holmes 2007; Bouvier and Palese 2008) are
single-stranded, negative-sense RNA viruses that can infect and cause seasonal epidemics
in humans, birds, and other animal species. The genome of influenza A viruses comprise
eight viral RNA segments, and each segment encodes 1-2 viral proteins. Influenza A
viruses are further characterized by the subtype of their surface glycoproteins, the
hemagglutinin (HA) and the neuraminidase (NA). While many genetically distinct
subtypes (16 for HA, 9 for NA) have been found in circulating influenza A viruses, only
three HA (H1, H2 and H3) and two NA (N1 and N2) have caused human epidemics
(Bouvier and Palese 2008). These surface proteins are the targets of human immune
system and possibly antiviral drugs (Nelson and Holmes 2007; Bloom, Gong, and
Baltimore 2010), so they are under strong selective pressure to evolve resistance. The
influenza A genome can achieve this through two processes: one is antigenic drift,
characterized by the gradual accumulation of mutations on the antibody-binding sites of
the surface proteins so that it can evade the surveillance of the immune system, and this
sometimes will cause seasonal epidemics. The other mechanism is called antigenic shift,
a much more rare incidence where two or more strains of influenza viruses combine to
form a new subtype that has a mixture of surface antigens from these strains. This kind of
segment reassortment can happen when the same cells were simultaneously infected by
different strains of human and animal viruses, and the resulting viruses can potentially
encode novel surface antigens that human populations have no preexisting immunity.
pandemics, including the most recent 2009 H1N1 outbreak, where viral reassortment
happened between human, avian and swine viruses (Smith et al. 2009).
Since influenza A viruses are such global public health threat, there have been
many efforts trying to understand the evolutionary constraints that are imposed upon the
influenza A genome, and potentially use these information to predict the flu strains that
may become prevalent in the following year. Numerous methods have been proposed to
search for amino acid residues or patches that are under selective pressures from
influenza sequences.(Bush et al. 1999; Yang 2000; Suzuki 2006; Kosakovsky Pond et al.
2008; X. Ding et al. 2010; Tusche, Steinbruck, and McHardy 2012). Some recent studies
(Kryazhimskiy et al. 2011; Neverov et al. 2015) also attempt to identify the pairs of
amino acid residues within or among segments that co-evolve each other, so the
knowledge of one residue mutated in the “epistatic pair” may help one make the
prediction that the other residue may also mutate soon. Another cellular process that is
vital to the integrity of influenza viral life cycle is the viral packaging. One challenge the
nascent virion needs to face is to assemble its complete genome from a pool of RNA
segments. It is known that the presence of conserved terminal promoter sequences at the
5’ and 3’ end of each viral RNA is necessary to distinguish itself from cellular RNAs
(Hutchinson et al. 2010). The 5’ and 3’ sequences are partially base-paired to form a
characteristic panhandle or corkscrew structure. However, to correctly assemble its 8
distinct viral segment, influenza A viruses also need segment-specific packaging signals.
Various methods, 1) including studying defective-interfering RNAs, 2) finding the
analyzing the effect of point mutations on packaging, have been used to probe
segment-specific packaging signals.
Besides identifying evolutionary constraints on the influenza A genome, there
have also been several studies that try to predict the prevalent strains of influenza viruses
in the near future by building a sequence-based influenza viral fitness model (Luksza and
Lässig 2014) or by extracting the information from the influenza viral phylogeny (Neher,
Russell, and Shraiman 2014). These represent the new frontiers in understanding and
predicting influenza viral evolution.
Overview of the dissertation
There has been a long tradition in molecular evolution to study selective pressures
operating at the protein level. But protein-coding variation is not the only level on which
molecular adaptations occur, and it is not clear what roles non-coding variation has
played in evolutionary history, since they have not yet been systematically explored. The
absence of technical tools to detect positive selection on non-coding variation is one of
the major obstacles along this road.
In this dissertation I systematically explore several aspects of the selective
pressures of noncoding nucleotide variation:
Chapter 1 is the General Introduction. It provides the necessary background for
the entire dissertation, and it sets the stage for the following discussions of selection on
Chapter 2 describes a research project on the determinants of eukaryotic
translation dynamics, which includes selection on non-coding aspects of DNA variation.
Deep sequencing of ribosome-protected mRNA fragments (Ingolia et al. 2009) and
polysome gradients in budding yeast (Arava et al. 2003) have revealed an intriguing
pattern: shorter mRNAs tend to have a greater overall density of ribosomes than longer
mRNAs. The same trend has been found in mouse, human, fruit fly, Arabidopsis,
malaria, and fission yeast: shorter Open Reading Frames (ORFs) tend do exhibit more
densely packed ribosomes (Ingolia et al. 2009; Cataldo, Mastrangelo, and Kleene 1999;
Branco-Price et al. 2005; Qin et al. 2007; Hendrickson et al. 2009; Lacsina et al. 2011).
There is debate about the cause of this trend. To resolve this open question, I used
5’mRNA secondary structure as a proxy for translation initiation rate, Codon Adaptation
Index (CAI, a measure of biased synonymous codon usage) as a proxy for translation
elongate rate, and systematically analysed 5’mRNA and CAI patterns in short versus long
genes, within each of about 100 sequenced eukaryotic genomes. My results showed that
compared with longer ones, short genes initiate faster, and also elongate faster. Thus the
higher ribosome density in short eukaryote genes cannot be explained by translation
elongation. Rather it is the translation initiation rate that sets the pace for eukaryotic
protein translation.
The published research paper arising from Chapter 2, describing my studies on
ORF length and 5’ mRNA structure (Y. Ding, Shah, and Plotkin 2012), provides a
statistical analysis and gives us a global view of the relative roles of translation initiation
translation dynamics, I also helped to develop and parameterize a whole-cell stochastic
model of the protein translation process that keeps track of every mRNA, tRNA, and
ribosome in a cell (Shah et al. 2013). Using this mechanistic model, we showed that
indeed translation initiation is the rate-limiting step in yeast endogenous protein
translation, at least in healthy growing cells. Even though I am an author on that paper
(Shah et al. 2013), I do not describe my work on the mechanistic modeling of translation
in this dissertation, because the project was highly collaborative involving other members
of the Plotkin lab and it is not directly related to selection pressures on non-coding
variation.
Chapter 3 concerns detecting selective pressures on the influenza A viral RNA
structures. Influenza A viruses are negative-sense RNA viruses that cause significant
human morbidity and mortality each year. Rapid evolution of antigenic surface proteins
allows the virus to re-infect hosts who have recovered from prior strains. It is therefore
important to understand the selective pressures that shape the evolutionary trajectories of
influenza viral genomes. Most previous research has focused on identifying amino acid
residues experiencing positive or purifying selection, whereas selection on RNA
structures has received less attention. Here we develop algorithms to scan along the viral
genome and identify regions that exhibit signals of purifying or diversifying selection on
RNA structure, by comparing the structural distances between actual viral RNA
sequences against an appropriate null distribution. Unlike other algorithms that identify
structural constraints, our approach accounts for the phylogenetic relationships among
can also detect recent selective pressures, which are of considerable practical interest,
including recent positive selection. Our results indicate that a significant portion of
influenza A viral genomes have experienced purifying selection for RNA structure, in
both the positive- and negative-sense RNA forms, over the past few decades; and we
provide the first evidence of recent positive selection on RNA structure in specific
regions of these viral genomes. We also identify genomic regions where viral RNA
structures may have played a role during shifts from avian to human hosts.
Chapter 4 summarizes the results from previous chapters and provides some
perspective on the possible future developments in areas related to the research presented
in this dissertation.
Overall, the projects presented in these chapters represent a systematic look at
several novel aspects of selection on noncoding nucleotide variation. These projects
should open up new directions in studying the molecular signatures of natural selection,
including studies on interactions between different layers at which selection may operate
(e.g. RNA structure, protein sequence, etc).
Besides the papers discussed above, from 2010-2015 I have also been involved in
the following additional publications which are not described explicitly in this
dissertation document: (Y. Ding, Grünewald, and Humphries 2011) is a theoretical paper
in phylogenetic analysis, where we improved the upper and lower bounds between
maximal possible distance between two trees of n leaves. This improves our
understanding of the mathematical properties of several tree-editing distance measures.
over-representative motifs in protein-coding sequences, correcting for the amino acid
background. This, together with a conservation-based algorithm I helped develop earlier
(Kural et al. 2009), gives us a set of computational tools to search for functional sequence
motifs in protein coding sequences. (Y. Ding et al. 2014) presents algorithms to calculate
the partition functions and probabilities of an RNA molecule adopting a secondary
structure with k hairpins or multiloops, where k is a positive integer. This gives us a tool
to calculate the probability that an RNA molecule can adopt a certain shape. (McCandlish
et al. 2013) examines the analysis of (Breen et al. 2012) and showed that their analysis
didn’t prove epistasis is the primary factor in molecular evolution, as they initially
Chapter Two
Systematically Weaker 5’-mRNA Secondary Structures in Short Eukaryotic
Genes
Abstract
Experimental studies of translation have found that short genes tend to exhibit greater
densities of ribosomes than long genes in eukaryotic species. It remains an open question
whether the elevated ribosome density on short genes is due to faster initiation or slower
elongation dynamics. Here we address this question computationally using 5’ mRNA
folding energy as a proxy for translation initiation rates, and codon bias as a proxy for
elongation rates. We report a significant trend towards reduced 5’ secondary structure in
shorter coding sequences, suggesting that short genes initiate faster during translation.
We also find a trend towards higher 5’ codon bias in short genes, suggesting that short
genes elongate faster than long genes. Both of these trends hold across a diverse set of
eukaryotic taxa. Thus, the elevated ribosome density on short eukaryotic genes is likely
caused by differential rates of initiation, rather than differential rates of elongation.
Introduction
Synonymous sites in coding sequences have long been used as a neutral yardstick
McDonald and Kreitman 1991; Muse and Gaut 1994). Nonetheless, synonymous
mutations are known to experience selection in many cases (Andersson and Kurland 1990;
Chamary and Hurst 2005; Duret 2002; Hershberg and Petrov 2008; Sawyer and Hartl
1992; Sharp et al. 1995; Sharp, Emery, and Zeng 2010) for a variety of mechanisms,
including the efficiency of gene translation, the stability of mRNAs (Capon et al. 2004;
Chamary and Hurst 2005; Chamary, Parmley, and Hurst 2006; Duan et al. 2003; Shah
and Gilchrist 2011; Shen, Basilion, and Stanton 1999) especially near the translation
initiation site (Gu, Zhou, and Wilke 2010; Keller et al. 2012; Kudla et al. 2009), the
regulation of splicing, among others (Plotkin and Kudla 2011). The fact that synonymous
mutations have phenotypic and fitness consequences complicate the interpretation of
measures of selection, such as the ratio of substitution rates at synonymous and
non-synonymous sites, dN/dS [(Goldman and Yang 1994; Kimura 1977; Muse and Gaut 1994)
but see (Hirsh, Fraser, and Wall 2005)].
Selection for translational efficiency remains the dominant explanation for
systematic variation in codon usage among the genes in a genome, in diverse taxa
(Plotkin and Kudla 2011). In accordance with this explanation, codon bias towards the
most abundant iso-accepting tRNA species is generally strongest in those genes
expressed at high levels, where efficiency would confer the greatest selective benefit to
the cell. Nonetheless, the specific mechanisms by which codon bias confers relative
fitness gains are actively debated (Plotkin and Kudla 2011; Shah and Gilchrist 2010).
Our understanding of the dynamics of gene translation, and the role of codon bias in
of translation across the entire transcriptome. Especially promising are techniques that
use high-throughput sequencing of ribosome-protected RNA to determine a “ribosomal
footprint” on each mRNA (Bazzini, Lee, and Giraldez 2012; Brar et al. 2012; Guo et al.
2010; Ingolia et al. 2009; Ingolia, Lareau, and Weissman 2011; G. W. Li, Oh, and
Weissman 2012; Oh et al. 2011; Reid and Nicchitta 2012) with greater accuracy than
earlier, polysome-based techniques (Arava et al. 2003). Among many other intriguing
findings, these experiments have shown that the cell-wide average profile of ribosome
densities in yeast exhibits a trend of decreasing ribosome density with codon position,
from 5’ to 3’ – an observation that has been explained, in part, by a trend towards less
biased codon usage in the 5’ ends of genes, associated presumably with slower elongation
and thus higher ribosome density (Tuller et al. 2010).
Aside from the 5’ ramp of elevated ribosome densities, sequencing (Ingolia et al.
2009) and polysome gradients in budding yeast (Arava et al. 2003) have also revealed
another, possibly independent finding: shorter mRNAs tend to have a greater overall
density of ribosomes than longer mRNAs. The same trend has been found in mouse,
human, fruit fly, Arabidopsis, malaria, and fission yeast: shorter ORFs tend to exhibit
more densely packed ribosomes (Branco-Price et al. 2005; Cataldo, Mastrangelo, and
Kleene 1999; Hendrickson et al. 2009; Ingolia et al. 2009; Lackner et al. 2007; Lacsina et
al. 2011; Qin et al. 2007).There is debate about the cause of this trend. Some authors have
attributed this relationship to a constant-length ramp of elevated 5’ density on all
transcripts due to elongation dynamics (Ingolia et al. 2009) (so that shorter transcripts
this trend to an increased rate of initiation in short yeast genes causing an increased
density of ribosomes (Arava et al. 2003; Arava et al. 2005; Lackner et al. 2007). As a
result, at present it is unclear whether the greater overall density of ribosomes on short
yeast genes is caused by a greater rate of initiation for such genes, or a slower rate of
early elongation in those genes.
Against this backdrop of open questions, here we analyze the relationship between
ORF length and measures of initiation and early elongation rates, across a diverse set of
eukaryotic species. As a proxy for the initiation rate of a gene we use the computationally
predicted energy of its 5’ mRNA structure – a quantity that has been shown
experimentally to correlate strongly with protein levels (Kudla et al. 2009) and which has
been subject to natural selection in virtually all free-living (Gu, Zhou, and Wilke 2010;
Keller et al. 2012; Tuller et al. 2010) and many viral species (Zhou and Wilke 2011). As
a proxy for the early elongation rate of a gene we use the codon adaptation index (CAI)
(Sharp and Li 1987) of its early codons (Tuller et al. 2010). In general, by performing
these analyses we seek to understand whether the trend towards elevated ribosome
densities in short genes (Arava et al. 2003; Arava et al. 2005; Branco-Price et al. 2005;
Cataldo, Mastrangelo, and Kleene 1999; Hendrickson et al. 2009; Ingolia et al. 2009;
Lackner et al. 2007; Lacsina et al. 2011; Qin et al. 2007) is caused by faster initiation in
those genes, slower early elongation in those genes, or both.
Results
We first investigated the relationship between ORF length and 5’ mRNA folding in
the model species C. elegans, as well as the relationship between ORF length and 5’
codon bias. As described above, we use these two measures as proxies for the initiation
rates and early elongation rates of genes. In particular, for each C. elegans transcript, we
computed its predicted folding energy from nucleotide -4 to +37 (Kudla et al. 2009)
relative to start, using RNAfold (Hofacker et al. 1994), and we computed the CAI of its
first 50 codons. (We systematically explore alternative definitions of 5’ CAI below.)
We performed a Spearman rank correlation test between 5’ mRNA folding energy
and ORF length, among the 29857 transcriptsin C. elegans (Assembly WS220). We
likewise performed a rank correlation test between 5’ CAI values and ORF lengths. Our
expectation was that compared with long genes, short genes should tend to have faster
initiation rates and/or slower early elongation rates – in order to explain the tendency
towards elevated ribosome densities on short genes (Arava et al. 2003; Arava et al. 2005;
Branco-Price et al. 2005; Cataldo, Mastrangelo, and Kleene 1999; Hendrickson et al.
2009; Ingolia et al. 2009; Lackner et al. 2007; Lacsina et al. 2011; Qin et al. 2007). Of
these two alternative mechanisms we might in principal expect the initiation-driven
mechanism to be a stronger determinant of ribosome densities(Andersson and Kurland
1990; Bulmer 1991; Lackner et al. 2007).
In accordance with these expectations, we found a significant negative rank
correlation (Spearman rho = -0.12, p < 7e-90) between 5’ mRNA folding energy and
ORF length, indicating a tendency towards weaker mRNA structure and presumably
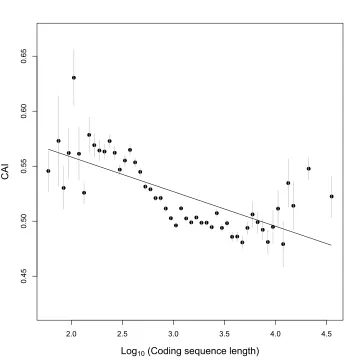
significant negative rank correlation (Spearman rho = -0.16, p < 5e-179) between 5’ CAI
and length, suggesting shorter genes tend to have faster early elongate rates (Fig. 2).
Given that shorter genes have higher CAI and hence faster elongation rates, we would
expect a lower ribosomal density for shorter genes contrary to the observed patterns. As a
result, we conclude that higher ribosomal densities of shorter genes is most likely
explained by faster initiation rates as shown by weaker 5’ mRNA secondary structures.
2.0 2.5 3.0 3.5 4.0 4.5
-1
2
-1
0
-8
-6
-4
-2
0
Log10 (Coding sequence length)
5'
F
ol
di
ng
En
erg
y
!
Figure 1. Short C.elegans genes have higher 5’ mRNA folding energies than long
C. elegans genes, suggesting faster initiation in short genes. Genes have been
binned according to their log (ORF length), with dots showing the mean
computed 5’ mRNA folding energy in each bin, and lines showing ± 1 standard
deviation. The solid line shows best-fit regression (Spearman rho = -0.12, p <
7e-90).
Figure 2. Short C.elegans genes have higher 5’ CAIs than long C. elegans genes,
2.0 2.5 3.0 3.5 4.0 4.5
0.45
0.50
0.55
0.60
0.65
Log10 (Coding sequence length)
C
their log (ORF length), with dots showing the mean computed 5’ CAI in each bin,
and lines showing ± 1 standard deviation. The solid line shows best-fit regression
(Spearman rho = -0.16, p < 5e-179).
Codon bias, mRNA structure, and ORF length in 120 Eukaryotic Species
Given our results in C. elegans we then asked how broadly these trends in gene
length and 5’ mRNA structure hold across eukaryotes. We repeated the 5’ mRNA folding
energy calculations in 120 eukaryote species, and the 5’ CAI calculations in 89 of those
species for which a reliable reference set of genes was available for computing CAI. (The
sets of species used in 5’ mRNA folding energy and 5’ CAI calculations are listed in
supplementary table S1). The results of these calculations and their correlations with
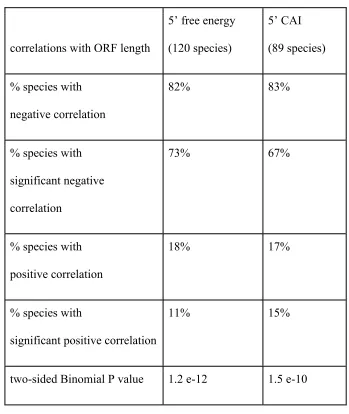
ORF length are summarized in table 1.
Table 1 summarizes the proportion of species tested that exhibit a negative rank
correlation between 5’ mRNA folding energy and ORF length, or between 5’ CAI and
ORF length. In addition we report the proportion of species that feature a significant
negative correlation, at the 5% significance level. As the table shows, the results found in
C.elegans hold very broadly across eukaryotes: about 80% of tested eukaryotes exhibit
negative correlations between mRNA folding and length, and between 5’ CAI and length.
The preponderance of significant negative correlations with ORF length among
eukaryotes is itself highly significant, for both 5’ mRNA folding energy (binomial
p<1e-11) and 5’ CAI (binomial p<1e-9) – suggesting a systematic eukaryotic trend towards
our results suggest that the higher ribosome density observed in shorter eukaryotes genes
is likely due to faster initiation rates in shorter genes.
correlations with ORF length
5’ free energy
(120 species)
5’ CAI
(89 species)
% species with
negative correlation
82% 83%
% species with
significant negative
correlation
73% 67%
% species with
positive correlation
18% 17%
% species with
significant positive correlation
11% 15%
two-sided Binomial P value 1.2 e-12 1.5 e-10
Table 1. Most eukaryotic species show a tendency towards weak 5’ mRNA
structure and high 5’ codon bias in shorter genes. In particular, there is a negative
rank correlation between 5’mRNA folding energy and ORF length 82% of the
CAI and ORF length in 83% of the 89 species tested. The overall tendency
towards negative correlations is highly significant, in both cases.
The distribution of correlations for energy and CAI are presented in Fig. 3 and Fig. 4, and
the complete results for each species used in the energy and CAI calculations are
presented in supplementary tables S2 and S3, respectively.
Figure 3. The distribution of Spearman Rank Correlation Coefficients between 5’
Energy and ORF length in 120 eukaryotic species.
Distribution of correlations between 5' Energy and ORF length
Spearman Rank Correlation Coefficient
N
umb
er
of
sp
eci
es
-0.3 -0.2 -0.1 0.0 0.1
0
10
20
30
Figure 4. The distribution of Spearman Rank Correlation Coefficients between 5’
CAI and ORF length in 89 eukaryotic species.
Weak 5’ mRNA folding in short genes, controlling for 5’ CAI
In the previous sections we have established a systematic trend towards weaker 5’
mRNA structure in short genes, as opposed to long genes; and we argued that the
resulting increase in initiation rates is responsible for the greater density of ribosomes Distribution of correlations between 5'CAI and ORF length
Spearman Rank Correlation Coefficient
N
umb
er
of
sp
eci
es
-0.20 -0.15 -0.10 -0.05 0.00 0.05 0.10 0.15
0
5
10
15
20
25
30
typically found in short eukaryotic genes. Nonetheless, we have also found a trend
towards increased CAI in the same region, in short genes – and so the possibility remains
that some subtle patterns of 5’ CAI might be responsible for the trend observed in mRNA
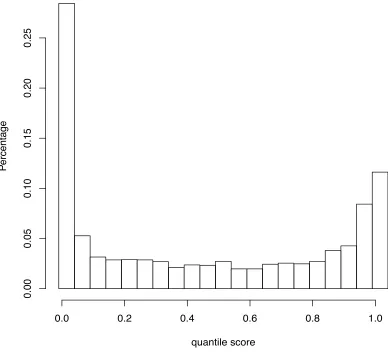
structure. To resolve this issue, we have performed a randomization procedure that
isolates the effects of synonymous codons on 5’ mRNA structure, controlling for 5’ CAI.
For each species, we randomly shuffled the first 50 codons of each coding sequence,
and we repeated this process 100 times for each gene. In each such permutation the 5’
CAI of the gene is preserved, whereas the mRNA structure is possibly perturbed. We
then computed the quantile of the 5’ mRNA folding energy for the true gene sequence
with respect to this null distribution of permuted sequences. Since our hypothesis is that
shorter genes are under selection for weaker 5’ mRNA folding (i.e. higher energy)
regardless of 5’ CAI, we expect a higher quantile for shorter genes. We tested this
expectation by computing the Spearman rank correlation between the length of each ORF
in the genome and the quantile of its true mRNA folding energy compared to the null
distribution.
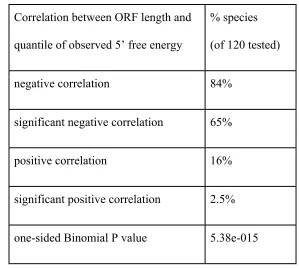
As shown in table 2, we observed a negative rank correlation between the energy
quantile and the ORF length in the great majority species (binomial p-value < 6e-15) –
indicating that the trend towards weak mRNA structure in short genes holds even after
controlling for 5’ CAI. These analyses substantiate our hypothesis that shorter eukaryotic
genes are under selection to have faster translation initiation rates, achieved through
Correlation between ORF length and
quantile of observed 5’ free energy
% species
(of 120 tested)
negative correlation 84%
significant negative correlation 65%
positive correlation 16%
significant positive correlation 2.5%
one-sided Binomial P value 5.38e-015
Table 2. Most species exhibit a tendency towards weak 5’ free energy in short
genes, even after controlling for 5’ CAI. In the majority of species tested we find
a negative rank correlation between ORF length and the quantile of the observed
5’ mRNA free energy among the free energies of permuted sequences that retain
the same 5’ CAI value. The tendency towards negative correlations across species
is highly significant.
Robustness of Results
In the preceding analyses we calculated 5’ CAI using the first 50 codons of each
ORF. We chose this region to coincide as much as possible with the ramp of slow codons
reported by Tuller et al. (Tuller et al. 2010). We repeated the 5’ CAI calculations using
case (See supplementary table S4). The ribosomal density on a gene might be affected by
codons beyond the 5' region of gene as well. For instance, slow codons in the middle or
end of a gene might cause a bottleneck for ribosomes, leading to higher ribosomal
densities irrespective of the codon composition in the 5' region. As a result, we also
verified the robustness of our results by considering the CAI of entire ORF, producing
the same qualitative, but slightly weaker, result (36% positive correlations, 64% negative
correlations, two-sided Binomial P value < 0.011. For the complete tabulation of these
results see supplementary table S8).
Another potential concern that may arise from our 5’ CAI calculation is that we
excluded sequences shorter than 51 codons. Is it possible that the sequences shorter than
51 codons could have a different CAI pattern and somehow diluted the observed CAI
pattern? To answer this question we modified the definition of 5’ CAI to include coding
sequences shorter than 51 codons long, by computing the geometric mean of the relative
adaptiveness of all the non-stop codons in the sequence. Again, this did not change our
qualitative results. (See supplementary table S5).
Discussion
We have reported a strong trend towards weaker 5’ mRNA structure in short genes,
as compared to long genes, among eukaryotic species. Moreover, we also observed a
trend towards higher 5’ codon bias in short versus long genes – indicating that elongation
dynamics driven by codon bias are unlikely to be the cause of higher ribosomal densities
5’mRNA folding energy/ 5’CAI is usually statistically significant but not strong.
Nonetheless, the trend of reduced 5’ secondary structure in short coding sequences was
observed in the vast majority of eukaryotic species (82%) tested. The statistical
significance of this trend is extraordinarily strong, and so too is the biological
significance: more than three-quarters of eukaryotic species exhibit reduced 5’ mRNA
structure in short genes.
To the extent that 5’ mRNA structure modulates initiation (Bettany et al. 1989; de
Smit and van Duin 1990; Eyre-Walker and Bulmer 1993; Gu, Zhou, and Wilke 2010;
Keller et al. 2012; Kudla et al. 2009), our results suggest that faster initiation is
responsible for the empirical observation in diverse eukaryotes (Arava et al. 2003;
Branco-Price et al. 2005; Cataldo, Mastrangelo, and Kleene 1999; Hendrickson et al.
2009; Lackner et al. 2007; Lacsina et al. 2011; Qin et al. 2007) that short mRNAs are
more densely packed with ribosomes than long mRNAs.
Our analyses across a diverse set of eukaryotic species substantiates several authors’
interpretation of patterns of ribosomal densities and ORF length, which have been
attributed to initiation-driven mechanisms as opposed to elongation effects (Arava et al.
2003; Arava et al. 2005; Lackner et al. 2007). Our results confirm that the effects of
initiation, modulated by ribosomal binding to the 5’ end of mRNA and scanning to start
codon, strongly outweigh those of elongation dynamics, modulated by codon bias. This
view is in contrast, however, with other studies that propose a dominant role of codon
usage in shaping ribosomal occupancies(Tuller et al. 2010). Our results do not directly
considered relative codon usage within each ORF, whereas we have studied absolute
codon usage across different ORFs.
Other factors such as protein folding(Kimchi-Sarfaty et al. 2007) and sequence
similarity to ribosome binding sites (G. W. Li, Oh, and Weissman 2012) may also
influence ribosome density. However, such effects are generally not considered as major
determinants in shaping overall ribosome density(G. W. Li, Oh, and Weissman 2012;
Plotkin and Kudla 2011). These factors, which are difficult to quantify systematically, are
probably less likely to show systematic trends with respect to ORF length, such as those
we have observed for 5’CAI and 5’ mRNA secondary structure.
It is interesting to ask whether there are any commonalities among the 22
“counterexample” species in which we observed a positive rank correlation between
5’energy and ORF length. What differentiates these organisms from the other eukaryotes
we have studied? To answer this question, we examined the phylogenetic relationship of
all the studied species, and the distribution along this phylogeny of those 22 species
exhibiting a positive rank correlation between ORF length and 5’ free energy (see
supplementary fig. S1). Although a few of these counter-examples are clearly closely
related sister species, overall these 22 species are distributed relatively uniformly among
eukaryotes, as opposed to being mostly monophyletic. And so we do not find any obvious
commonality among these species with respect to their evolutionary history and, likely,
ecological contexts.
Our results on systematically weaker 5’ mRNA structure in short genes beg the
has been suggested that highly expressed genes are shorter in many eukaryotes (Duret
and Mouchiroud 1999; Eisenberg and Levanon 2003; Eyre-Walker 1996; Rao et al. 2010),
also short genes are enriched for constitutively expressed housekeeping and ribosomal
genes (Hurowitz and Brown 2003), which must produce protein as rapidly as possible.
This alone might explain why short genes experience selection for faster
initiation(Reuveni et al. 2011). In addition, housekeeping genes tend to have shorter 5'
untranslated regions (UTRs) and are under weaker post-transcriptional regulation (David
et al. 2006; Hurowitz and Brown 2003; Lin and Li 2012). The probability of successful
ribosomal binding and scanning on an mRNA may depend on the length of its 5' UTRs.
As a result, genes that require post-transcriptional regulation tend to have longer 5' UTRs,
leading to lower initiation probabilities(Lin and Li 2012).
In summary, we find that shorter genes have higher 5’ mRNA folding energies and
codon bias, suggesting that shorter genes both initiate and elongate faster than longer
genes. Both of these trends hold across a diverse set of eukaryotic taxa. Since faster
elongation leads to lower ribosome densities, the elevated ribosome densities of short
eukaryotic genes is a result of initiation rates, rather than elongation rates.
Methods
Datasets
Coding sequences with 4bp upstream data for most species were downloaded from
ensembl genomes servers (http://www.ensemblgenomes.org). The coding sequences of