United Kingdom ISSN 2348 0386 Vol. VIII, Issue 2, February 2020
Licensed under Creative Common Page 33
http://ijecm.co.uk/
EVALUATION OF THE WELL-BEING PERFORMANCE OF
AFRICAN COUNTRIES WITH EDAS METHOD
Ismail Jbari
Business Management Student, Istanbul Aydin University, Istanbul, Turkey [email protected]
Çiğdem Özari
Assistant Prof., Economics and Finance, Istanbul Aydin University, Istanbul, Turkey [email protected]
Abstract
This research assesses the overall well-being and human development in five countries from
the African Union. In order to make this evaluation, the Evaluation Based on Distance from
Average (EDAS) method, one of the Multi-Criteria Decision methods, has been used. The use
of EDAS method with its clear and simple steps helped us rank all countries according to their
overall level of well-being. In this research, data will be analyzed over a period extending from
2002 up until 2017 which will be divided into two timelines. According to our findings, there has
been generally an improvement on the level of human development as much as public spending
increased as South Africa outranked the other countries that have been studied in this paper.
Keywords: Public spending, human development, African Union, EDAS, Multi-Criteria Decision
Making
INTRODUCTION
Licensed under Creative Common Page 34 Public spending can affect growth and poverty reduction in two ways: it can raise the overall growth performance of the economy (Gravelle et al. 2009), and it can increase the chance of the poor to contribute to the growth process (mainly by strengthening human capabilities and reducing transaction costs). In both cases, poverty may be reduced, but in the case of more growth-oriented expenditures, the poverty impact is usually more indirect.
For both types of expenditures, the impact on poverty levels is likely to be experienced with a time lag. Moreover, the increase in public spending in the social sector came along as the Millennium Development Goals (MDGs) also encouraged social sector spending.
Morocco, like other developing countries under the structural Adjustment Program, has not escaped the recommendations of the World Summit for Social Development by making social and human development one of its major concerns. In fact, at the end of the 90’s, the Moroccan experienced a series of mutations and changes of political and economic nature that met the guidelines of the International Financial Institutions (HDR, 2005). On the one hand, there was a succession of reforms based on new rules involving the effectiveness of public policies and on the other hand, a more optimistic discourse seeking to strengthen economic, social and human development.
However, at the beginning of the year 2000, Morocco entered a global mobilization crowned by the adoption of the MDGs, the MDGs initiated a new dynamic tending to reverse the indicators of human development. Because of the multiplication of economic and social difficulties (HCP, 2015), achieving these MDGs requires of both North-South cooperation in line with international commitments and changes in budget structures, including increased public spending on social issues.
At this level, we see very clearly the interest of dealing with such a subject, because, more and more today, the State is expected to orient public policies towards a logic of human and sustainable development and strengthen the financing of the social sectors (Wolfensohn, 1997).
Licensed under Creative Common Page 35
LITERATURE REVIEW
Governments worldwide play a major role in the economic process. Public economics economists have been arguing about the extent of government involvement in a market economy and were trying to provide the conceptual framework to understand to which extent government intervention is justified.
This intervention is done under the pretext that government provides public goods that markets have little incentive to provide (Wagner, 2007) and because of market failure, the latter means that when a market fails to produce more or less than the ideal “optimal” amount of a
good it indicates a market failure situation. In fact, market failures are widespread in developing countries, goods and factor markets are characterized by shortages and surpluses while factor markets exhibit high levels on unemployment and capital scarcities. Market failure is said to happen when the conditions of the Pareto optimality (a condition where the allocation of resources makes an individual better off without someone else being worse off) break down due to many factors such as externalities, institutional failures, information asymmetry (Winston, 2006).
In fact, the achievement of national objectives such as the reduction of poverty and unemployment rates are channeled through public spending. Public spending or Government spending is incurred by public authorities in order to satisfy society’s wants and needs. Since
the onset of the great depression, the government budget was no longer considered as being a statement of national accounts, but it was rather regarded as fiscal instrument capable of shifting all trends within economic indicators such as production, prices and employment. In other terms, government budget nowadays is seen as a powerful instrument to achieve national objectives such as the reduction of poverty and unemployment rates and the achievement of sustainable development.
Throughout the 19th century, most governments advocated for a laissez-faire economic policies, minimal involvement in certain areas of public policy or the private sector and their functions were only limited to defending aggression and maintaining law and order (Crouch,1967) Although public spending share of the economy was shy and negligible during that period, it started to rise bit to bit over the late 19th century and the decades that followed. It boomed in the period between World War II and 1980, since then its share of the economy worldwide has risen (Tanzi et al. 2000).
Licensed under Creative Common Page 36 link between GS and economic growth although that this impact varies from one country to another.
Nevertheless, the composition of GS and its distribution over different sectors of the economy is worth considering. In fact, what we would call governance of public spending is very important (Rajkumar et al. 2002) when it comes to compare why some countries are doing better when it comes to evaluating the impact of GS on the HDI.
METHODOLOGY
Multi-criteria Decision-Making or Multi-Criteria Decision Analysis is a sub-discipline of a wider discipline which is Operational Research. Nevertheless, it’s wide use and popularity in scientific
fields makes it a discipline on its own (Pavan et al. 2009). The raison- d’être of this theory is to
deal with decision that involve choosing among a multitude of alternatives the “optimal solution” from a set of conflicting criteria’s and alternatives. In other words, when a group of individuals
faces a problem that involves different alternatives and in which they must select one of them without having a priori knowledge of which one is the best, they resort to MCDM methods.
While examining the literature we came across many MCDM theories such as EDAS (Ghorabaee et al. 2016; Zhang et al., 2019) TOPSIS (Yoon et al. 1981; Wanke et al. 2016; Balioti et al. 2018) and ELECTRE methods (I, II, III, IV, IS, TRI) (Roy, 1991; Shresta et al. 2017).
TOPSIS is one of the classical MCDM methods, the latter was developed by the work of Ching-Lai Hwang and Yoon in 1981(Hwang and Yoon, 1981), and later developed by Yoon in 1987 (Yoon 1987) and Lai and Lu in 1993 (Oporovic, 2002). It is also a widely used method in DM, it has been used in Logistics, engineering, business and marketing, HRM, etc. TOPSIS approach is very simple, it consists on identifying an alternative which is closest to the ideal positive solution (PIS) and farthest to the negative ideal solution (NIS) (Velasquez and Hester, 2013 ), and regardless of the complexity of the problem and its size, the simple steps of TOPSIS make it widely used, sometimes even to verify other MCDM methods answers (Velasquez and Hester, 2013).
In our research we used the EDAS method due to its clarity and simplicity, in the following we will talk about this method, how it appeared and the calculation steps. As we have seen previously, there are many MCDM methods, EDAS being one of the efficient MCDM methods.
As previously cited, the complexity of today’s world requires using efficient methods and
Licensed under Creative Common Page 37 EDAS method was first introduced by Keshavarz Ghorabaee for multi criteria inventory classification (Ghorabaee et al. 2016). The EDAS method consists upon the evaluation of alternatives based on positive and negative distances from the average solution in comparison to each criterion and is especially useful when faced with a set of conflicting criteria. As opposed to other MCDM methods such as VIKTOR and TOPSIS, EDAS has only two measures in order to determine the best alternative (Positive Distance from Average and Negative Distance from Average).
EDAS was also used in a comparative study with other MCDM methods by the same people who came up with it to verify its validity (Kundakcı, 2018). While examining the literature
about EDAS method which is known for its need of less computation compared to other MCDM methods, we found that the method has been used in different areas such as solving air traffic problems (Kikomba et al. 2016) evaluating steam boiler alternatives (Kundakcı, 2018). Ulutaş
(2017) used EDAS method to select the best sewing machine for a textile workshop, Ghorabee (2016) extended the use of the method to solve MCDM problems in fuzzy environments in order to solve a supplier selection problem (Ghorabaee et al., 2016). The steps for EDAS method are proposed in this paper as (Ghorabaee et al. 2015):
Step 1: Select the most important criteria that describe alternatives and construct the decision matrix
Step 2: Define the importance level of each criteria.
Step 3: Determine the average solution according to all criteria.
Step 4: Calculate the Positive Distance from Average (PDA) and the Negative Distance from Average (NDA) matrixes according to the type of criteria (beneficial or non-beneficial).
Step 5: Determine the weighted sum of PDA and NDA for all alternatives.
Step 6: Normalize the values of SP and SN for all alternatives.
Step 7: Calculate the appraisal score (AS) for all alternatives and rank alternatives according to the decreasing values of appraisal score (AS).
APPLICATION OF EDAS METHOD
Licensed under Creative Common Page 38 Table 1: Criterions table
Acronym Criterion name Description
HDI Human
Development Index
Measuring the levels of social and economic development. Due to its inclusiveness as a unit of measurement of the performance of well-being it has been taken as a criterion.
GS Government Spending or Public Spending
It’s a key aspect of the fiscal policy of a country and it affects the
way governments choose between expansionary and contractionary economic objectives and thus affecting in a way or the other the well-being of citizens.
GDP/C GDP per capita Measuring the prosperity and wealth of a population, it is also a key element in measuring the HDI.
Step 1: Select the alternatives and the most important criteria that describes the alternatives and by the help of these variables construct the decision matrix.
X11 X12 X 1m
X21 X22 X 2m (1)
X = [Xij] =
X n 1 X n 2 X nm
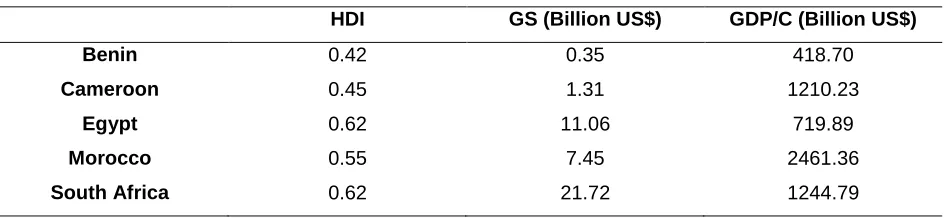
Since the aim of the study is to rank countries according to three main criteria, which are HDI, GS and GDP/C, the decision matrix has five rows and three columns as shown in Table 2.
Table 2: Decision Matrix: 2002
HDI GS (Billion US$) GDP/C (Billion US$)
Benin 0.42 0.35 418.70
Cameroon 0.45 1.31 1210.23
Egypt 0.62 11.06 719.89
Morocco 0.55 7.45 2461.36
South Africa 0.62 21.72 1244.79
Step 2: Define the importance level of criteria
Since there is no relevant evidence that one of these criteria can be more important than the others, we assume that they are equally distributed.
Step 3: calculating the averages from Solution (AVj)
Licensed under Creative Common Page 39 Table 3: Determining the Average from Solution (2002)
HDI GS (Billion US $) GDP/C (Billion US$)
Average 0.53 8.38 1244.79
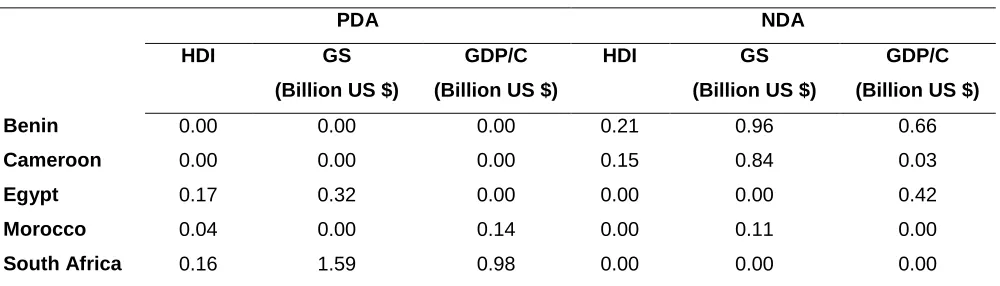
Step 4: Calculate the Positive Distance from Average (PDA) and the Negative Distance from Average (NDA)
The PDA and NDA indicate respectively the positive and negative distance of the ith alternative from average solution according to jth criterion.
In the case of a beneficial criterion, the formulas are as follows:
PDA = max(0,(Xij – AVj))/ AVj (3)
NDA = max(0,(AVj-Xij))/AVj (4)
If the criterion is non beneficial, then we proceed as shown in formulas 4 and 5 PDA = max(0;( AVj-Xij))/AVj (5)
NDA = max (0,(Xij-AVj))/AVj (6)
Since our criterions are beneficial, the PDA and NDA will be calculated using formulas (3) and (4) as shown in tables 4 and 5.
Table 4: Calculating the PDA and NDA (2002)
PDA NDA
HDI GS
(Billion US $)
GDP/C
(Billion US $)
HDI GS
(Billion US $)
GDP/C
(Billion US $)
Benin 0.00 0.00 0.00 0.21 0.96 0.66
Cameroon 0.00 0.00 0.00 0.15 0.84 0.03
Egypt 0.17 0.32 0.00 0.00 0.00 0.42
Morocco 0.04 0.00 0.14 0.00 0.11 0.00
South Africa 0.16 1.59 0.98 0.00 0.00 0.00
Step 6: Calculating the Weighted sum of PDA denoted SPi and the Weighted sum of NDA
denoted SNi.
The SPi indicates the weighted total positive value of the ith alternative and SNi shows the
weighted total negative value of the ith alternative. SPi and SNi are calculated using formulas (7)
and (8) as shown in table 6.
SPi = ∑mj=1 wj PDAij (7)
SNi = ∑mj=1 wj NDAij (8)
Licensed under Creative Common Page 40 Table 6: Calculating the SPi and SNi (2002)
SPi SNi
Benin 0.00 0.60
Cameroon 0.00 0.34
Egypt 0.16 0.14
Morocco 0.06 0.04
South Africa 0.9 0.00
Step 7: calculate the NSPi and NSNi which are respectively the normalized weighted total
positive and negative values of the ith alternatives, they are calculated using formulas (9) and (10) as shown in table 7.
NSPi = SPi / maxi (SPi) (9)
NSNi = 1 - SNi / maxi (SNi) (10)
Table 7: Calculating NSPi and NSNi (2002)
NSPi NSNi
Benin 0.00 0.00
Cameroon 0.00 0.43
Egypt 0.18 0.77
Morocco 0.07 0.93
South Africa 1.00 1.00
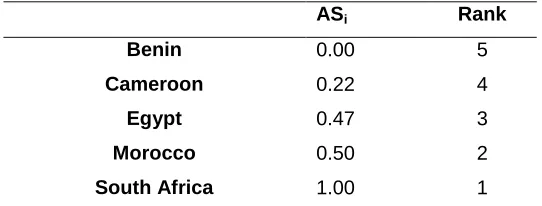
Step 8: the last step in EDAS method is the calculation of the Appraisal Score (ASi) for each alternative and which is calculated as follows:
ASi = ½ × (NSPi + NSNi) (11)
The alternative with the biggest appraisal score is considered the best, and the one with the lowest appraisal score the worst.
Table 8: Calculating the ASi and ranking the alternatives.
ASi Rank
Benin 0.00 5
Cameroon 0.22 4
Egypt 0.47 3
Morocco 0.50 2
Licensed under Creative Common Page 41
RESULTS AND INTERPRETATIONS
The results shown in the previous tables for the year 2002 confirm that Government spending does impact the level of human development. Based on the tables, the higher GS is the higher is HDI, but this leads to another question which concerns the efficiency and the distribution of GS among different sectors of the economy. This can be remarked in the case of South Africa and Egypt, the latter having way less GS but equalizing the former in terms of HDI.
From this numerical example we can conclude that effectively, GS does impact HDI but this impact is in turn influenced by the amount of GS, its distribution and its efficiency and since as we’ve mentioned earlier, that HDI does not limit itself solely on economic terms (it includes
the level of education, health, etc.), it would still be important to look at the distribution of national wealth in a specific country which we measured using GDP/Capita in order to come up with an answer to our question.
Although, Egypt outperforms Morocco in terms of HDI, the latter outranks Egypt in the overall ranking. Therefore, we mentioned that the impact of GS on the level of HDI should be seen through many lenses. By this we mean that the distribution of GS among different sectors of the economy is important, if a Government spends less on the social sector no matter how big its GS is, it will have less impact on human development and therefore the efficiency of GS is an important thing to consider.
Moreover, the distribution of national wealth is an important thing to consider, the bigger the latter the better the impact on human development. Nevertheless, inequalities between the citizens of a specific country has its role to play in the overall equation.
Table 9: Ranking of the alternatives: 2003-2010
Year Benin Cameroon Egypt Morocco South
Africa
2003 ASi 0.00 0.11 0.43 0.46 1.00
Rank 5 4 3 2 1
2004 ASi 0.00 0.11 0.33 0.45 1.00
Rank 5 4 3 2 1
2005 ASi 0.00 0.09 0.34 0.44 1.00
Rank 5 4 3 2 1
2006 ASi 0.00 0.09 0.38 0.45 1.00
Rank 5 4 3 2 1
2007 ASi 0.00 0.10 0.40 0.46 1.00
Licensed under Creative Common Page 42
2008 ASi 0.00 0.11 0.46 0.49 1.00
Rank 5 4 3 2 1
2009 ASi 0.00 0.11 0.46 0.49 1.00
Rank 5 4 3 2 1
2010 ASi 0.00 0.08 0.49 0.41 1.00
Rank 5 4 2 3 1
The results for the period between 2003 - 2010 indicate that there hasn’t been a big change in
the ranking of countries except for the last two years where Egypt outranked Morocco. Nevertheless, as we mentioned earlier, the distribution of GS between different sectors of the economy is worth considering. As an example, South Africa’s level of GS have been increasing
in big numbers in most of this period but its level of HDI remained somewhat almost constant.
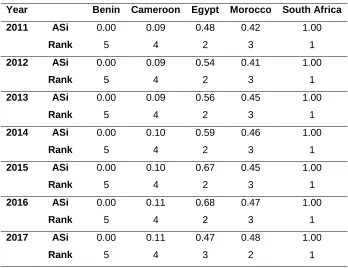
Table 10: Ranking alternatives: 2011-2017
Year Benin Cameroon Egypt Morocco South Africa
2011 ASi 0.00 0.09 0.48 0.42 1.00
Rank 5 4 2 3 1
2012 ASi 0.00 0.09 0.54 0.41 1.00
Rank 5 4 2 3 1
2013 ASi 0.00 0.09 0.56 0.45 1.00
Rank 5 4 2 3 1
2014 ASi 0.00 0.10 0.59 0.46 1.00
Rank 5 4 2 3 1
2015 ASi 0.00 0.10 0.67 0.45 1.00
Rank 5 4 2 3 1
2016 ASi 0.00 0.11 0.68 0.47 1.00
Rank 5 4 2 3 1
2017 ASi 0.00 0.11 0.47 0.48 1.00
Rank 5 4 3 2 1
The ranking results for the period between 2011 – 2017 indicate a consistency in the ranking of
the countries except for the year 2017 where Morocco outranked Egypt. but the same observation as in the previous years is made. In fact, South Africa’s level of GS is so high
compared to the other countries but the impact on the level of HDI is smaller compared to Egypt and somewhat closer to that of Morocco’s although the latter has way less GS than South
Licensed under Creative Common Page 43 Africa. This however, might be due to some other factors such as the level of inequality in these countries for example.
As for Morocco, based on the tables and calculations we’ve made, it’s evident that GS
has an impact on the overall Human Development in Morocco, the bigger GS is the highest the HDI got. Thus, Morocco through increased GS dedicated to social sectors, has been targeting the human development in a good way. But all this is not yet enough as Morocco still ranks in the medium human development area. That is, more efforts must be devoted in order to improve the level of human development in Morocco.
CONCLUSION AND RECOMMENDATIONS
Given the increasing role of Government in the economy has been concerning major economists worldwide and thus the emphasis put on the Government’s role in addressing the
issues of market failures.
In our research we tried to illustrate the logic behind public spending and its role in improving the overall well-being of citizens. Whereas our focus as particularly put on the role of public spending on the human development in Morocco, we did, in order so solidify our claims, extend our research to other African countries.
The results shown above illustrate that there has been generally an improvement on the level of human development measured by the HDI as much as we’ve seen an increase in public
spending, but the question remains how this public spending is affected to different segments of the economy and to what extent is that efficient.
As for Morocco, the impact has been considerable since poverty rate has been decreasing and the HDI has been increasing over the years with increased public spending dedicated to social sectors. As the poverty rate remains at approximately 4%, the efficiency of the policies is to be questioned to the extent to which the governance of public spending regarding this matter is questioned.
As we’ve seen, the underlying principle of the HDI is that national development shouldn’t
be measured only by income but also by other parameters such as the levels of education and health of the population of a country. Thus, in order to go towards more human development and less exclusion, countries must address the problem of inequality because economic growth does have an impact on the level of human development in a country but it’s unlikely to be
Licensed under Creative Common Page 44 In fact, as countries become rich, policies addressing inequality tend to be more efficient and thus inclusive economic growth is key to achieve this. Moreover, targeting poverty and inequality efficiently requires investments in human capital, investments that can be channeled through public services (health and education) and promoting the equality of opportunity and gender equality to improve the overall economic growth and incentivize the process of participating in an economy.
De facto, all the factors mentioned above are all interconnected and lead to various other economic discussions. It is no wonder that, besides the question of economic growth and human development, there is also the fact that political and economic institutions are key factors in determining the sustainability of economic growth and the distribution of wealth among citizens in a specific country. That is, this paper would be a start to get deeply into further exploring the questions of growth, poverty, inequality and the impact of political and economic institutions on them.
REFERENCES
Balioti. V., Tzimopoulous. C., and Evangelides. C. (2018). ”Multi-Criteria Decision Making Using TOPSIS Method Under Fuzzy Environment. Application in Spillway Selection.
Crouch. R. L. (1967). “Laissez-Faire in Nineteenth Century Britain: Myth or Reality”.
Furceri, D., and Zdzienicka, A. (2011). “The Effects of Social Spending on Economic Activity: Empirical Evidence from a Panel of OECD Countries”.
Gravelle, J. G. Hungerford. T. L., Labonte. M. (2009). “Economic Stimulus: Issues and Policies”. Library of Congress Washington Dc Congressional Research Service.
Ghorabaee. M. K., Zavadskas. E. K., Olfat. L., Turksis. Z. (2015). Multi-Criteria Inventory Classification Using a New Method Of Evaluation Based on Distance from Average Solution (EDAS). Informatica, 2015, Vol. 26, No. 3, 435–45. Ghorabaee. M. K., Zavadskas. E. K., Amiri. M., Turskis. Z. (2016). “Extended EDAS Method for Fuzzy Multi-Criteria Decision Making: An Application to Supplier Selection”. International Journal of Computers Communications and Control. ISSN 1841-9836. 11(3):358-371
Hwang. C. L., and Yoon. K. (1981). “Multiple Attribute Decision Making: Methods and Applications”.
Haut Commissariat au Plan (HCP). (2015). National Report. ” Morocco between MDGs and SDGs. Achievements and Challenges”.
Human Development Report. (2005). “L’avenir se construit et le meilleur est possible, Cinquantenaire de l’indépendance du Royaume du Maroc ”.
Kikomba. M. K., Mabela. R. M., and Ntantu. D. I. (2016). Applying EDAS method to solve air traffic problems. International Journal of Scientific and Innovative Mathematical Research (IJSIMR), 4(8), 15-23.
Kundakcı . N. (2018). “EDAS Method to Evaluate Steam Boiler Alternatives for a Dyehouse of a Textile Company”. The International Congress On Afro-Eurasian Reasreach IV.
Opricovic. S., Tzeng. G.H. (2002). “Compromise Solution by MCDM Methods: A comparative analysis of VIKTOR and TOPSIS”. European Journal of Operational Research 156 (2004) 445–455.
Pavan. M., and Todeschini. R. (2009). “Comprehensive Chemometrics: Multicriteria Decision Making Methods”. Rajkumar. A. S., Swaroop. V. (2002). “Public Spending and Outcomes: Does Governance Matter? Development Research Group. World Bank.
Licensed under Creative Common Page 45 Shrestha. G.C., Hewage. K., and Sadiq. R. (2013, March). “Selecting Sustainability Indicators for Small to Medium Sized Urban Water Systems Using Fuzzy-ELECTRE.
Tanzi. V., and Schuknecht. L. (2000). “Public Spending in the 20th Century: A Global Perspective”.
Ulutaş. A., (2017). Sewing Machine Selection for a Textile Workshop by Using EDAS Method. Journal of Business Research Turk. DOI: 10.20491/isarder.2017.266
United Nations. (2017). “A Manual on the Design and Conduct of Public Expenditure Reviews in Caribbean Countries: Applications to Education, Health, Agriculture and Social Protection”.
Velasquez. M., and Hester. P. T. (2013). An Analysis of Multi-Criteria Decision Making Methods. International Journal of Operations Research, 10 (2), 56-66.
Wolfensohn. J. D. (1997). “World Development Report: The State in a Changing World”.
Wagner. E.R. (2007). Fiscal Sociology and the Theory of Public Finance: An Explanatory Essay. Edward Elgar Publishing.
Wanke. P., Barros. C., Macanda. N. P. J. (2016, September). ” Predicting Efficiency in Angolan Banks: A Two-Stage TOPSIS and Neural Networks Approach. South African Journal of Economics Vol. 84:3.
Winston. C. (2006). “Government Failure versus Market Failure: Microeconomic Policy Research and Government Performance”.
Yoon. K. A. (1987). “A Reconciliation among discrete Compromise Situations”.