4620
Improving Accuracy Of The Test Measurement
Through IRT Equating Of Polytomous Item For
Small Scale Test
Friyatmi, Djemari Mardapi
Abstract: The accuracy of the test measurement can be improved by using equivalent tests. This study aims to produce the IRT test equating that is applied for small scale tests and determine the appropriate equating method. The sample of this study was 171 high school students. There are two multiple-choice tests with a polytomous scoring form that tested to the students. The equating uses IRT horizontal equating with the Anchor test design. The results show that the TCC-Stocking Lord method provides more accurate equating results than the others. Although the estimated parameters of the two test forms are relatively similar, the equating results indicate that the difficulty index of Form 1 is higher than Form 2. The equating equation that can be used to compare students’ abilities in Form 1 to Form 2 is θ* = 1,073θ + 0,135.
Index Terms: equating, IRT, polytomous, small scale test.
—————————— ——————————
1
INTRODUCTION
Tests have been used extensively in a variety of assessment practices, especially in educational assessments. There are various objectives for the use of tests in educational institutions, including in the context of selection, diagnostics, and measuring the student's achievement. The achievement test plays a very crucial role because it functions as a tool to measure student success in learning. Therefore the learning achievement test instrument should have high quality attributes to reflect the actual abilities of the students. Achievement tests are often also used as a basis for comparison or mapping of the learning quality. Various forms of examinations [1] play an important role in educational assessments [2]. This is usually done in the form of a large scale test. The practice of large-scale tests in Indonesia is usually routinely carried out in the form of national examinations and national standard school examinations. National exams have been held for decades to determine the graduation level for elementary through high school students [3]. This test is carried out by the central government and is held simultaneously at a certain period in all levels of the institution [4]. However, since 2015 this test no longer functions as a determinant of student graduation [5]. The role of the national exam is then replaced by the national school examination to determine the graduation of students. National-level school exams are managed by schools through the local government, so that between regions have different test instruments in determining student graduation. The policy raises new problems when a comparison of achievement of learning outcomes among students, especially comparisons between schools and between regions. Since the test standards used differ naturally, it is not accurate if student achievements are compared between schools or between regions. The exam results are often used by relevant stakeholders as a determinant of the success or quality of a school or student. Not necessarily a school that has high student test results because their students have high abilities, but it could be due to the test instruments have an easy level of difficulty. The various weaknesses above will affect the test results, so the conclusions drawn can be inaccurate. Accurate information can only be obtained if the quality of the test meets the requirements. In addition to being valid and reliable, the test results should be fair and accurate [6]. The fairness and accuracy of a test can be realized when the test has equal
4621
2
METHOD
This study was exploratory research. It explores the characteristics of school test exams and measures test equating empirically. The sample was 12th-grade high school students in Padang city, Indonesia. The number of sampling is 171 students. There are two test forms on the economic test that tested to the students. It consists of 20 multiple choice items with polytomous scoring in each set had four score categories. Each test form consists of 5 common items. The students only work on one test form. Test form 1 was followed by 96 students and test form 2 was 75 students. The process of test equating uses horizontal equating with Anchor test design. The equating of the two test packages use the IRT model. It consists of 3 steps. The first step is the estimation of test parameters for the two test packages. It was analyzed using the PARSCALE. Next, equating of the two test packages using the equating equation. This stage was carried out with the IRTEQ. Last, estimated ability parameter conversion based on equating equations. IRT parameter estimation contains two parameters i,e item parameters and ability parameters. Item parameters are determined by a suitable model. Some models that are usually used to analyze polytomous data items are Nominal Response Model (NRM), Rating Scale Model (RSM), Partial Credit Model (PCM), Graded Response Model (GRM) and Generalized Partial Credit Model (GPCM)[13, 14]. According to the data attributes, this study uses the GPCM model. The use of IRT in test analysis has three underlying assumptions, namely unidimensional, local independence and invariant parameters [11]. Unidimensional related to the ability of each test item to measure only one ability (Brennan and Kole, 2004). It means that the probability of an item response is a function of the latent characteristics of the examinees. Local independence is realized as the independence of all examinees from the test items in the subpopulation. It means that responses to the two test items do not correlate with each other within homogeneous subpopulations. Local independence assumptions can be detected by proving unidimensional assumptions [13]. Testing the unidimensional is a fundamental trait to be fulfilled in the use of IRT. Therefore assumptions testing in this study is more focused on testing unidimensional assumptions because if these assumptions are met then the local independence can also be fulfilled. Unidimensional testing is carried out through factor analysis using the SPSS. The equivalence of the test set can be done by determining the equating equation. It used to adjust the item parameters, and the ability parameters of the students are as follows.
b* = α b + β θ* = α θ + β
The equating scores of the two test sets can be done if they meet four conditions, namely 1) both tests must measure the same ability, 2) the testee ability must be the same, 3) invariant population, 4) the transformation must be symmetrical [15, 16].
3 RESULTS
AND
DISCUSSION
3.1 Parameter Estimation
Before parameter estimation is analyzed using IRT, the IRT assumption must be accomplished. Unidimensional testing is analyzed to determine whether the test used measures one type of trait. It was analyzed using factor analysis. One of the
things that need to be considered in conducting a factor analysis is the sample adequacy. It can be seen from the KMO value and the Barlett test as shown in Table 1.
TABLE1
KMO and Bartlett's Test
Form 1 Form 2
Kaiser-Meyer-Olkin Measure of
Sampling Adequacy .811 .807
Bartlett's Test of Sphericity: Approx. Chi-Square df Sig. 769.896 190 .000 648.421 190 .000
The analysis showed the KMO value> .6 with a significance of Bartlett's Test < .01 for both test forms. This means that the sample size is sufficient for the IRT analysis. To get items that measure the same dimensions, an extraction process is carried out to produce several factors. Many factors that are formed are indicated by components that have eigenvalue> 1 which are seen in Table 2.
TABLE2
TOTAL VARIANCE EXPLAINED
Form 1
Com-pone nt
Initial Eigenvalues Extraction Sums of Squared
Loadings Total % of Varianc e Cumulativ e % Tota l % of Varianc e Cumulativ e %
1 6.35
3 31.764 31.764
6.35
3 31.764 31.764
2 1.89
8 9.491 41.255
1.89
8 9.491 41.255
3 1.74
4 8.718 49.973
1.74
4 8.718 49.973
4 1.42
7 7.136 57.109
1.42
7 7.136 57.109
5 1.150 5.749 62.858 1.150 5.749 62.858
Form 2
Com-ponen t
Initial Eigenvalues Extraction Sums of Squared
Loadings Total % of Varianc e Cumulativ e % Tota l % of Varianc e Cumulativ e %
1 6.87
8 34.392 34.392
6.67
8 34.392 34.392
2 1.730 8.652 43.045 1.730 8.652 43.045
3 1.54
2 7.712 50.757
1.54
2 7.712 50.757
4 1.45
8 7.288 58.045
1.45
8 7.288 58.045
5 1.14
2 5.710 63.756
1.14
2 5.710 63.756
6 1.02
9 5.145 68.900
1.09
2 5.145 68.900
Extraction Method: Principal Component Analysis.
4622 [17]. Based on the results of the factor analysis, it can be
concluded that the unidimensional assumption has been fulfilled. The fulfillment of unidimensional has indirectly proved the local independence assumptions [13]. Tests on the assumption of parameter invariance also prove that there are no variations in item parameters and the ability parameters of the participants, so it can be concluded that the invariance of the parameter parameters and the ability parameters of participants has been proven. The next step is to determine the estimated parameters of the two test forms using IRT. It produces two parameters namely item parameters and participant parameters. The grain parameter estimation using the GPCM model results in item difficulty index (b), while the item discriminant index (a) is assumed to be the same.
TABLE3
THE ESTIMATED STATISTICAL OF ITEM PARAMETERS
Form 1 Form 2
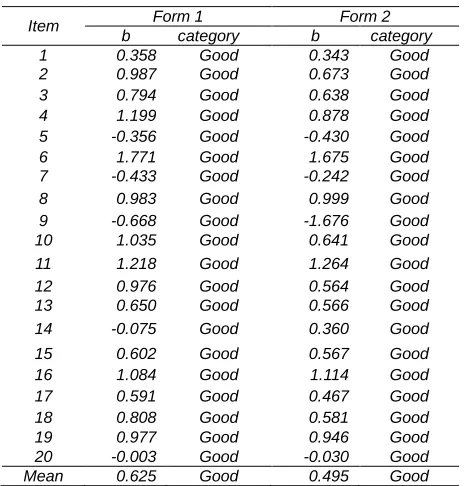
The results show that the mean difficulty index of test form 1 is 0.625 and form 2 is 0.495. It indicates that the level of item difficulty is in a good category because it is in the range of -2 to 2. The estimation of the discriminant index under the GPCM model is estimated the same for all items in each test package, where test form 1 has a discriminant item 0.439 and form 2 is 0.489. The discriminant indexes for the two test forms are similar. Because of the discriminant index has been set at the same for all items, then the equating procedures will ignore the discriminant index and only focus on the difficulty items. The estimated difficulty index for each item in each test forms illustrated in Table 4.
TABLE4
THE ESTIMATION OF ITEM DIFFICULTY
Item Form 1 Form 2
b category b category
1 0.358 Good 0.343 Good
2 0.987 Good 0.673 Good
3 0.794 Good 0.638 Good
4 1.199 Good 0.878 Good
5 -0.356 Good -0.430 Good
6 1.771 Good 1.675 Good
7 -0.433 Good -0.242 Good
8 0.983 Good 0.999 Good
9 -0.668 Good -1.676 Good
10 1.035 Good 0.641 Good
11 1.218 Good 1.264 Good
12 0.976 Good 0.564 Good
13 0.650 Good 0.566 Good
14 -0.075 Good 0.360 Good
15 0.602 Good 0.567 Good
16 1.084 Good 1.114 Good
17 0.591 Good 0.467 Good
18 0.808 Good 0.581 Good
19 0.977 Good 0.946 Good
20 -0.003 Good -0.030 Good
Mean 0.625 Good 0.495 Good
Based on Table 4, it can be seen that all items have a good difficulty level for both forms. The mean difficulty index of form 1 is slightly higher than the form 2. The item parameter indicates that all items have probability chi-square ≥0.05, so it can be concluded that all items are fitted with the GPCM model. The estimation of the students’ ability using the EAP model showed that both test forms had moderate and relatively similar abilities. Students' ability to form 1 is -0.034 and form 2 is -0.031. The results show that the two groups of the students have relatively similar abilities so that they meet the requirements for test equating as required by Linn [15] and Dorans, Moses [16] that the testee abilities must be similar in equating.
3.1 Test Equating Process
The equating method has a function to determine the conversion constant. An equating between two or more sets of tests can be done if the conversion constant is known [11]. The initial step in the equating process is determining the coefficient of the linking item. Based on the IRTEQ, it is known that the mean level of difficulty and discriminant index of linking items are as follows.
TABLE5
THE ITEM PARAMETERS OF LINKING ITEMS
Item Parameter Form 1 Form 2
Difficulty (b) Discrimination (a)
0,596 0,439
0,420 0,489 Correlation coeff. for discrimination of linking items: 0.000 Correlation coeff. for difficulty of linking items: 0.991
The data shows the correlation coefficient for the difficulty of linking items is equaled very high, which is 0.991. While the correlation for distinguishing power is 0 because it is considered the same for all items. The equating process is then carried out by determining the conversion constants, namely α and β. The conversion constants then become the basis in determining the equating equation for each equating method, as illustrated in Table 6.
TABLE6
THE EQUATING EQUATION
Method α β Persamaan konversi
b* θ*
Mean-Mean 1.114 0.128 b*=1,114b+0,128 θ*=1,114 θ+0,128
Mean-Sigma 1.048 0.156 b*=1,048b+0,156 θ*=1,048 θ+0,156
TCC
(Haebara) 1.079 0.151 b*=1,079b+0,151 θ*=1,079θ+0,151
TCC (Stocking & Lord)
1.073 0.135 b*=1,073b+0,135 θ*=1,073 θ+0,135
Based on the conversion equation in the table above, then the estimated parameter parameters can be transformed into a new form. In this case, the test form 1 is transformed into the form 2.
3.1 Transforming Estimated Parameters into a New Form
The transformation of the parameter estimation is carried out by equating the estimated parameter of the test form 1 to form 2. It is shown in Table 7.
TABLE7
TRANSFORMING THE ITEM PARAMETERS INTO NEW FORM
Method Form 1 Form 2 Form 1 (new)
4623
Mean-Sigma 0.625 0.495 0.811
TCC (Haebara) 0.625 0.495 0.825
TCC (Stocking & Lord) 0.625 0.495 0.806
Table 7 shows that the difficulty index of form 1 had a mean of 0.625. When it is equated to test form 2 which has a lower index difficulty, then the estimated parameter of the new form 1 becomes higher than the old form. This equating process proves that the difficulty index of form 1 is more difficult than form 2. The estimated mean parameter parameters of the four equating methods are similar. However, the TCC-Stocking Lord method is more accurate than other methods because its results are close to form 2 that is used as the basis for equating. The results are in line with Hidayati [18] that states the test equating using the TCC (Stocking & Lord) method is better than the mean-mean or mean-sigma method because the TCC method pays attention to the relationship between the parameters items and the true score of the testee. Furthermore, several studies show that the TCC (Stocking & Lord) method provides more accurate equating estimation so that it is widely used in IRT equating studies [19-21]. After the transformation of the equating parameters, the difficulty index of form 1 (new form) and form 2 are relatively close to the linear line. It indicates that the item parameters of the two test forms are equal.
Figure axis labels are often
The transformation process of the students' abilities is relatively similar to the process of transformation of the item parameters. The results of the transformation of the student's abilities are as follows.
TABLE8
TRANSFORMING THE ABILITYPARAMETERS INTO NEW FORM
Method Mean Ability
Form 1 Form 2 Form 1 (new)
Mean-Mean -0.034 -0.031 0.128
Mean-Sigma -0.034 -0.031 0.156
TCC (Haebara) -0.034 -0.031 0.151
TCC (Stocking & Lord) -0.034 -0.031 0.135
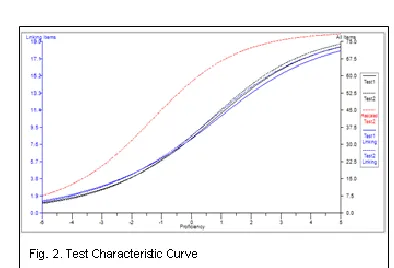
Table 8 shows that the student's ability who took the test form 1 had a mean -0.034. When it is equated to test form 2which has a higher ability, then the ability of the new form 1 becomes higher than the old form. It indicates that the students’ ability who took test form 1 is higher than form 2. Before equating, the test curve characteristics of both forms are separate, and then it becomes relatively closer after the equating process. It is shown
in Fig 2.
4
CONCLUSION
Based on the results, it can be concluded that the equating of the test form for small-scale tests can be applied, so that the accuracy of the measurement results can be realized. The process of equalizing the two test forms proves that the TCC-Stocking Lord method can provide better results than the mean-mean, mean-sigma, TCC-Haebara, and TCC-Stocking & Lord method. The equating results indicated the estimated parameter of the test form 1 is higher than form 2.
5
REFERENCES
[1]. Kumar, A. and N. Raghava, Adaptive Sitting Plan Algorithm Based On Henon Chaotic Map. International Journal of Scientific & Technology Research, 2019. 8(7). [2]. MCA, K.V., Survey Of Data Mining In Socio-Academic
Perspective. International Journal of Scientific & Technology Research, 2013. 2(9): p. 139-145.
[3]. Sutari, V.R. National Examination in Indonesia and Its Backwash Effects: Teachers' Perspectives. in Ninth International Conference on Applied Linguistics (CONAPLIN 9). 2016. Atlantis Press.
[4]. Soewarno, S., et al., Assessing chemistry-learning competencies of students in isolated rural senior high schools by using the national examination: a case study of Simeulue Island, Indonesia. International Journal of Science and Mathematics Education, 2014. 12(4): p. 817-839.
[5]. Maulipaksi, D., UN Bukan Penentu Kelulusan, Ini Pertimbangan Kelulusan Siswa. 2016, Kemendikbud Jakarta.
[6]. von Davier, A.A. and C. Wilson, IRT true-score test equating: A guide through assumptions and applications. Educational and Psychological Measurement, 2007. 67(6): p. 940-957.
[7]. Kolen, M.J. and R.L. Brennan, Test equating, scaling, and linking. 2004, New York: Springer.
[8]. González, J. and M. Wiberg, Applying test equating methods. 2017, New York: Springer.
[9]. Lissitz, R.W. and H. Huynh, Vertical equating for state assessments: Issues and solutions in determination of adequate yearly progress and school accountability. Practical Assessment, Research, and Evaluation, 2002. 8(1): p. 10.
[10]. Azwar, S., Dasar-dasar Psikometri. 2009, Yogyakarta: Pustaka Pelajar.
[11]. Hambleton, R.K. and H. Swaminathan, Item response theory: Principles and Applications. 2013, Boston: Springer Science & Business Media.
4624 and linking: Methods and practices. 2014, New York:
Springer Science & Business Media.
[13]. Retnawati, H., Teori respons butir dan penerapannya 2014, Yogyakarta: Nuha Medika.
[14]. Friyatmi, F., Estimasi parameter tes dengan penskoran politomus menggunakan graded response model pada sampel kecil. Jurnal Inovasi Pendidikan Ekonomi, 2018. 8(1): p. 22-31.
[15]. Linn, R.L., The Standards for Educational and Psychological Testing: Guidance in Test Development, in Handbook of test Development, S.M. Downing and T.M. Haladyna, Editors. 2011, Lawrence Erlbaum Associates, Inc: Mahwah, NJ.
[16]. Dorans, N.J., T.P. Moses, and D.R. Eignor, Principles and Practices of Test Score Equating. 2010, ETS: Princeton.
[17]. Naga, D.S., Pengantar Teori Sekor Pada Pengukuran Pendidikan. 1992, Jakarta: Gunadharma.
[18]. Hidayati, K. PenerapanTeori Respons Butir Dalam Penyetaran Tes. in Seminar Nasional Penelitian, Pendidikan & Penerapan MIPA 2005. Yogyakarta: FMIPA UNY.
[19]. Lee, G. and A.R. Fitzpatrick, A new approach to test score equating using item response theory with fixed c-parameters. Asia Pacific Education Review, 2008. 9(3): p. 248-261.
[20]. Keller, L.A., et al., MCAS equating research report: An investigation of FCIP-1, FCIP-2, and Stocking and Lord equating methods. 2008, Center for Educational Assessment Research Massachusetts.