New Synthetic Aperture Sensing For Sar Radar
Imaging
Seyed Mahdi Hosseini
1, Mohammad Chegini
2, Mahdi heshmatirad
321. Faculty member of Khatam-al-anbia air defense university 2. Faculty member of Khatam-al-anbia air defense university 3. Faculty member of Khatam-al-anbia air defense university
Corresponding Author email: [email protected]
Abstract: In this paper, we introduce a new Synthetic Aperture Radar (SAR) imaging modality that provides a high resolution map of the spatial distribution of targets and terrain based on a significant reduction in the number of transmitted and/or received electromagnetic waveforms. This new imaging scheme, which requires no new hardware components, allows the aperture to be compressed and presents many important applications and advantages among which include resolving ambiguities, strong resistance to counter measures and interception, and reduced on-board storage constraints.
Key word: compressed sensing, SAR
INTRODUCTION
SAR is a radar imaging technology that is capable of producing high resolution images of the stationary surface targets and terrain. The main advantages of SAR are its ability to operate at night and in all weather conditions, hence overcoming limitations of both optical and infrared systems. There are four common modes of SAR: scan, stripmap, spotlight and inverse SAR (ISAR). In this paper, we will mainly focus on the spotlight mode SAR and ISAR.
In spotlight mode SAR, the radar sensor steers its antenna beam to continuously illuminate the terrain patch being imaged. It can provide higher resolution than the stripmap and scan mode SAR because it maps a scene at multiple viewing angles during a single pass [1]. In ISAR, the radar is stationary and the target is moving. The angular motion of the target with respect to the radar can be used to form an image of the target. Differential Doppler shifts of adjacent scatters on a target are observed and the target’s reflectivity function is obtained through the Doppler frequency spectrum [2].
Since a SAR image is a map of the spatial distribution of the reflectivity function of stationary targets and terrain, many SAR images can be sparse or compressible in some representation such as those from a wavelet or a complex wavelet transform. The recently introduced theory of compressed sensing (CS) states that it is possible to recover such sparse images from a small number
Sar Phase Histories
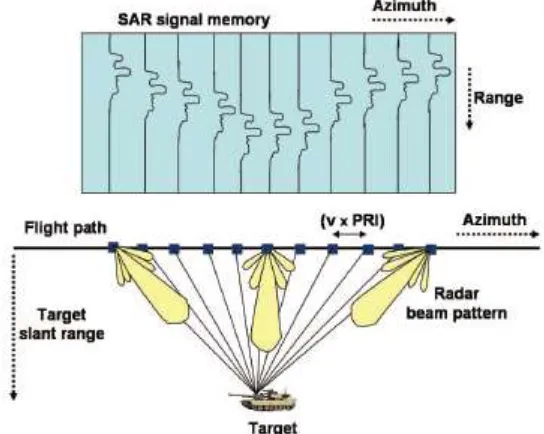
In this section, we give a brief description of SAR [1, 9, 10, 11, 12]. Figure 1 shows a simple diagram of spotlight mode SAR and how received data are placed in a 2D signal array. In SAR, motion of the antenna is used to synthesize a long antenna. As the radar platform advances along its path at constant velocity, pulses are transmitted and received by the radar. Pulses are transmitted at an uniform pulse repetition interval (PRI), which is defined as 1/PRF, where PRF is the pulse repetition frequency. The reflected signal at any instant can be modeled as a convolution of the pulse waveform with the ground reflectivity function [9, 11]. It has been shown that, if the echo signal is mixed with the reference chirp signal and low-pass filtered, the resulting signal canbe viewed as an approximate Fourier transform of the projection of the ground patch [11]. Consequently, the preprocessed SAR histories define a set of samples in the Fourier space (k-space) of the scene on a polar wedge [1, 11, 12]. A reflectivity function (i.e. SAR image) is recovered by appropriately interpolating these polar data to a Cartesian grid and taking a two dimensional inverse Fourier transform. This algorithm is commanly known as the Polar Format Algorithm (PFA) [1]. The two dimensional image formed is interpreted in the dimensions of range and cross-range or azimuth. The range is the direction of signal propagation and the cross-range is the direction parallel to the flight
53 path. Sometimes the range and the cross-range samples are referred to as the fast-time and the slow-time samples, respectively. of random measurements provided that the undersampling results in noise like artifacts in the transform domain and an appropriate nonlinear recovery scheme is used [3, 4]. In this paper, we introduce a new SAR image formation algorithm based on the theory of CS that reduces the number of transmitted and/or received waveforms. We will demonstrate that if the SAR image is assumed to be sparse in some transform domain, then one can reconstruct a good estimate of the reflectivity profile
Figure 1: Spotlight SAR data collection in 2D.
Compressed Sensing
A new framework known as compressed sensing enables the reconstruction of sparse or compressible signals from a small set of non-adaptive, linear measurements. If properly chosen, the number of measurements can be much smaller than the number of Nyquist rate samples [3, 4]. In this section, we give a brief introduction to compressed sensing.
Suppose
x
C
N is K-sparse in a basis or more generally a frame Ψ, so that x = Ψx0, withx
0 0
K
N
, where.
0returns the number of nonzero elements. In the case when x is compressible in Ψ, it can be well approximated by the best K-term representation. Consider a random M × N measurement matrix Φ with M < N and assume that M linear measurements are made such that y = Φx = ΦΨx0 = x0. According to the theory of CS, when the matrix has the Restricted Isometric Property (RIP) [20], it is possible to reconstruct x from a set of M = O(K log(N /K )) linear measurements. A matrix is said to satisfy the RIP of order K with constants δ = δK є (0, 1) if0
'
0 0
1 '
0
arg min
N x R
x
x
y
x
Sar And Isar Examples
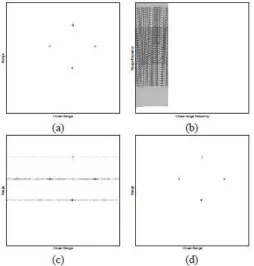
54 data was used. Figure2(c), shows the traditional reconstruction from the compressive measurements by the PFA, which fails to reconstruct the image. Figure 2(d) shows the reconstructed image using our proposed method. We choose Ψ to be the identity matrix for this example. Our reconstruction used the spectral projected gradient (SPGL1) algorithm [23]. As can be seen from Figure 2(d), that we were able to image the reflectivity profile of the point targets as good as PFA did from the full measurement data. Furthermore, we use the Peak Side lobe Ratio (PSR) and the Integrated Side lobe Ratio (ISLR) as measures of performance to evaluate the reconstructed point targets. The PSR determines the difference between the main lobe and the most prominent side lobe. The ISLR measures the ratio of all energy in the main lobe to the total energy in all the side lobes [1].
We used a point target located at the top in the image for comparison. Since the reconstructed point response is a 2D entity, we used principle axis cuts namely the range-cut and the cross-range cut for the analysis. We will refer to the range-cut and the cross range- cut as the range impulse response (RIR) and the cross-range impulse response (CRIR), respectively. There is no degradation in PSR and ISLR for the RIR. However, there is a minor degradation in the CRIR due to the fact that our 2D under sampling scheme is along the cross-range axis.
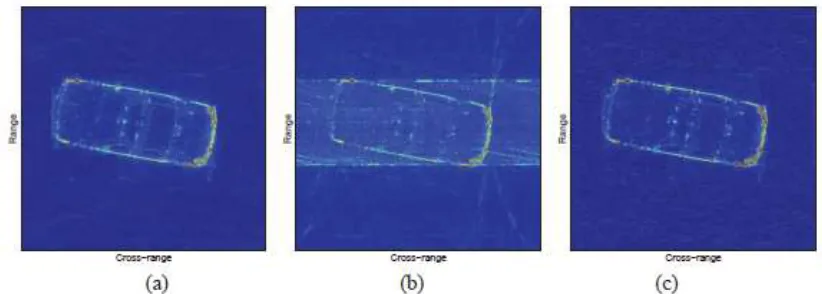
In the second experiment, we used ISAR data collected on a SAAB 9000 car using System Planning Corporation’s Mark V radar1. We reconstructed the image after 60% jittered slow-time under sampling was applied to the data. As can be seen from Figure 3, the reconstructed image from these compressed measurements is identical to the one reconstructed from the full measurements. Figure 3(b), shows how the traditional reconstruction fails to recover the ISAR image.
Figure 2: Point targets example. (a) Traditional PFA based reconstruction from the full simulated data. (b) Random slow-time under sampled phase histories. (c) Reconstructed by the PFA from the compressive measurements. (d)
55 In [4, 3], a theoretical bound on the number of Fourier samples that need to be measured for a good reconstruction has been derived. However, it has been observed by many researchers [14, 20, 24, 25], that in practice Fourier samples in the order of two to five times the number of sparse coefficients suffice for a good reconstruction. Our experiments also support this claim
Applications
The idea of transmitting waveforms at a non-uniform PRI for SAR has been suggested before [7]. This method, however, suffers from the smearing of the image in the cross-range dimension due to the randomness of the PRI. By solving the basis pursuit denoising problem (i.e (3)), we are able to not only reconstruct the image as good as some of the traditional SAR reconstruction methods do from the full data but even at a lower sampling rate. Our method of compressing the synthetic aperture offers many advantages: Since, irregularly transmitted waveforms are much more harder to intercept, our compressive aperture method offers strong countermeasures resistance [7, 26, 27]. Many methods for resolving ambiguities have been suggested. Among them include pulse tagging, PRF switching, and methods based on the Chinese remainder theorem. PRF switching is a simple extension of PRF jittering. Thus, our compressive radar can also be useful in resolving ambiguities [28].
In many SAR systems, radar data is directly stored in a memory for later transmission to the ground. Our compressive SAR has the potential to significantly reduce the amount of data to be stored and transmitted [9, 29].
.
Figure 3: SAAB car ISAR example. (a) Traditional reconstruction with the full data. (b) Traditional reconstruction with the partial data. (c) Reconstructed image using our proposed method from 60% slow-time under sampled
data.
CONCLUSION
We have managed to utilize CS-theory and demonstrated that it is possible to compress the synthetic aperture for radar imaging. Most importantly, not only can our suggested under sampling be used in novel collection schemes to produce high quality images but many new applications such as signals intelligence, resolving ambiguities, and reduced storage constraints are possible because of it.
REFERENCES
A. V. Balakrishnan, “ On the problem of time jitter in sampling,” IRE Trans. Inf. Theory, vol. 8, no. 3, pp. 226–236 , Apr. 1962.
D. C. Munson,Jr., J. D. O’Brien, and W. K. Jenkins, “A tomographic formulation of spotlight-mode synthetic aperture radar, ” Proc. IEEE, vol. PROC-71, pp. 917–925 , Aug. 1983.
D. Donoho, “Compressed sensing,” IEEE Trans. Info. Theory, vol. 52, no. 4, pp. 1289-1306, April 2006.
E. Candes and J. Romberg, “Signal recovery from random projections,” in Proc. of SPIE Computational Imaging III, San Jose, vol. 5674, 2005.
E. Candes, J. Romberg and T. Tao, “Robust Uncertainty Principles Exact Signal Reconstruction from Highly incomplete Frequency: Information,” IEEE Trans. Info. Theory, vol. 52, no. 2, pp. 489-509, Feb. 2006.
56 E. van den Berg andM. P. Friedlander, “SPGL1: A solver for largescale sparse reconstruction”,
http://www.cs.ubc.ca/labs/scl/spgl1/.
G. E. Stimson, Introduction to airborne radar. second edition, Mendham, NJ, SciTech Publishing, Inc., 1998. G. Hennenfent and F. J. Herrmann. “Simply denoise: wavefield reconstruction via jittered undersampling”,
Geophysics, vol. 73, no. 3, pp. v19–v28, June 2008.
H. S. Shapiro, and R. A. Silverman, “ Alias-free sampling of random noise,” SIAM, vol. 8, no. 2, pp. 225–248, June 1959.
I. G. Cumming, and F. H. Wong, Digital processing of synthetic aperture radar data. Norwood, MA, Artech House, 2005.
I. Stojanovic, W. C. Karl and M. C¸ etin, “Compressed sensing of mono-static and multi-static SAR, ” Proc. SPIE, vol. 7337, 2009.
J. A. Fessler and B. P. Sutton, “ Nonuniform fast Fourier transforms using min-max interpolation,” IEEE Trans. Sig. Proc., vol. 51, no. 2, pp. 560–574 , Feb. 2003.
K. Tomiyasu, “Tutorial review of Synthetic-Aperture Radar (SAR) with applications to imaging of the ocean surface, ” Proc. of the IEEE, vol. 66, no. 5, pp. 563–583 , May 1978.
M. C¸ etin and W. C. Karl, “Feature-enhanced synthetic aperture radar image formation based on nonquadratic regularization, ” IEEE Trans. Image Process., vol. 10, no. 4, pp. 623–631 , Apr. 2001.
M. Dippe, and E. Wold, “Antialiasing through stochastic sampling,” SIGGRAPH, vol. 19, no. 3, pp. 69–78, Nov. 1985.
M. Herman and T. Strohmer. “High resolution radar via compressed sensing”, To appear in IEEE Trans. Signal Processing.
M. Lustig, D. Donoho, and J. M. Pauly, “Sparse MRI: The Application of Compressed Sensing for Rapid MR Imaging,” Magnetic Resonance in Medicine,vol. 58, no. 6, pp. 1182-1195, Dec. 2007.
M. M. Bronstein,A. M. Bronstein, M. Zibulevsky and H. Azhari, “Reconstruction in diffraction ultrasound tomography using nonuniform FFT, ” IEEE Trans. Medical Imag., vol. 21, no. 11, pp. 1395–1401 , Nov. 2002.
R. Baraniuk and P. Steeghs, “Compressive radar imaging, Proc. 2007 IEEE Radar Conf., pp. 128133, Apr. 2007. R. J. Anderson, Security Engineering: A Guide to Building Dependable Distributed Systems. Indianapolis, IN,
Wiley, 2008.
R. L. Cook, “ Stochastic sampling in computer graphics,” ACM Transactions on Graphics, vol. 5, no. 1, pp. 51–72 , Apr. 1986.
S. Bhattacharya, T. Blumensath, B. Mulgrew and M. Davis, “Fast encoding of synthetic aperture radar raw data using compressed sensing,” IEEE wrokshop on SSP, Aug. 26–29 2007.
S. Chen, D. Donoho, and M. Saunders, “ Atomic Decomposition by Basis Pursuit,” SIAM J. Sci. Comp., vol. 20, no. 1, pp. 33-61, 1998.
S.G. Mobley, M.W. Maier, “Synthetic aperture radar with a nonuniform pulse repetition interval,” ssst, pp. 498-502, 27th Southeastern Symposium on System Theory (SSST’95), 1995.
V. C. Chen and H. Ling, Time-Frequency Transforms for Radar Imaging and Signal Analysis. Norwood, MA, Artech House, 2002.
W. G. Carrara,R. S. Goodman, and R.M.Majewski, Spotlight Synthetic Aperture Radar: Signal Processing Algorithms. Norwood, MA, Artech House, 1995.
W. W. Goj, Synthetic Aperture Radar and Electronic Warfare, Artech House, 1992