250 |
P a g e
BREAKDOWN AND ROOT CAUSE ANALYSIS OF
CRITICAL MACHINE- A CASE STUDY
Manoj M
1, Dr.G Mallesh
21P.G Student, Department of Mechanical Engg. , SJCE- Mysore, India 2Associate Professor, Department of Mechanical Engg. SJCE-Mysore, India
A
BSTRACTMaintenance can be defined as actions necessary for retaining or restoring a piece of equipment, machine or
system to the specified operating conditions to achieve its maximum useful life. Maintenance ensures that
production plant and equipments are available for production with minimum cost and wastage. Any
organization regardless of the size, technology, products and services must have a clear cut maintenance policy
to meet its individual needs. Preventive maintenance is a set of activities that are performed on plant, equipment, machinery, and systems before the occurrence of a failure in order to protect them and to prevent or
eliminate any degradation in their operating conditions.
Predictive maintenance is the complement of preventive maintenance. Predictive maintenance determines
equipment status before a breakdown occurs. Production may be stopped due to many reasons like breakdown
of machine, maintenance work, labour issues, and inventory problems. It is necessary to reduce the breakdown
of machine or equipments in the company for the efficient production to meet the demands.
The main objective of this project is to study the breakdown of a critical machine in automotive axle the major
breakdowns were observed in Landis threading machine, Hot swage machine and Shot blast machine. Breakdown history of each machine was analyzed form 2010-2014 and noticed that Landis threading machine
contribute major loss to the industry, hence detailed study was carried out to minimize loss.
Production process and machine breakdown was studied using different analysis and inspection tools like fish
bone diagram, why- why analysis and counter measures to determine the machine availability, machine
availability was determined by MTTR and MTBF. Based on the problems root cause analyses were carried out
to develop and improve new preventive maintenance schedule and checklist for a machine.
Keywords - Availability, Breakdown, downtime, Preventive Maintenance and Root Cause analysis,
Fish bone diagram, Why-why analysis
I.
INTRODUCTION
Industries all over the world have entered the era of high technology maintenance management in a desire to
minimize down time and penalty costs. The speed, with which technology advances, requires careful
management consideration. These advances bring with them new management problems that have not been
encountered before and difficulties are being experience in solving them, especially when the cost factor rises
continuously at the end of the line. Since no equipment is composed of failure free parts, there will always be
downtime due to repairs and maintenance. The more complex a piece of equipment, the longer it takes for the
diagnosis and repair of failure. When the repairing or replacing faulty equipment involves an unexpected cause,
251 |
P a g e
As the science and technology gearing day-by-day towards modernization and sophistication, the new incoming
production equipments are increasingly becoming complex in their parts/assemblies mechanisms. At the same
time, the use of maintenance is getting more and more popularity in the industries because of its outstanding
advantages in overcoming the problems related to the equipments.
Machine and equipment breakdowns found in most manufacturing industries in developing countries
like India and the adverse effects on the overall performance of the organization ranging from production loss,
high production cost, obvious inability to meet production deadlines, poor company’s reputation and loss of
integrity which invariably reduces the share capital and the ability to compete with similar industries creates a
window of research for possible remedies. Machine maintenance is gaining importance in industry because of
the need to decrease the possibility of production loss due to machine breakdown schedule preventive
maintenance reduces the regular breakdowns and increases the availability of machine .The goal of maintenance
is to ensure that the performance of the equipment is satisfactory. The major emphasis of this work will be the
development of workable strategies which will drastically reduce or totally eliminate machine and equipment
breakdowns in a production line.
A good maintenance system contributes to efficiency, customer service, high quality, safety, on time
delivery, and customer satisfaction. For complex mechanical equipment containing N units the optimal model
to preventive maintenance cycle policy is proposed to minimize the maintenance cost rate. A conception of the
productionscheduling and preventive maintenance in industries was taken for the research work. Thus, there is
an intense need for manufacturing industries to reduce unexpected breakdowns and remain competitive, and
motivatingmaintenance operations should be integrated into production scheduling models.
II. PROBLEM DEFINITION
The main objective of this project is to study the breakdown of a critical machine in automotive axle the major
breakdowns were observed in Landis threading machine, Hot swage machine and Shot blast machine.
Breakdown history of each machine was analyzed form 2010-2014 and noticed that Landis threading machine
contribute major loss to the industry, hence detailed study was carried out to minimize loss.
Production process and machine breakdown was studied using different analysis and inspection tools like fish
bone diagram, why- why analysis and counter measures to determine the machine availability, machine
availability was determined by MTTR and MTBF. Based on the problems root cause analysis were carried out
to develop and improve new preventive maintenance schedule and checklist for a machine.
III. OBJECTIVE OF THE PRESENT STUDY
To increase the availability of a machine
To reduce the down time of a machine
To maximize production rate
To improve new preventive maintenance schedule and checklist
IV. PROCESS STUDY
Process study is the systematic examination of the methods of carrying out activities such as to improve the
252 |
P a g e
process study has been carried to identify the causes of failure and remedies to overcome these failures without
implementing statistical tools.
4.1. Process Study of Hot Swage Machine
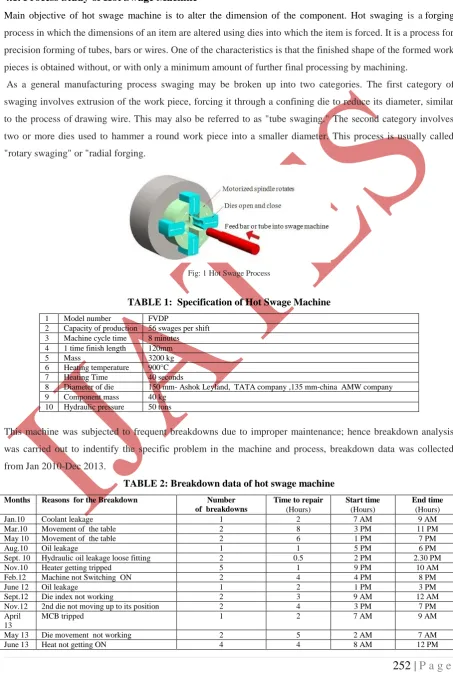
Main objective of hot swage machine is to alter the dimension of the component. Hot swaging is aforging
processin which the dimensions of an item are altered using dies into which the item is forced. It is a process for
precision forming of tubes, bars or wires. One of the characteristics is that the finished shape of the formed work
pieces is obtained without, or with only a minimum amount of further final processing by machining.
As a general manufacturing process swaging may be broken up into two categories. The first category of
swaging involves extrusion of the work piece, forcing it through a confining die to reduce its diameter, similar
to the process of drawing wire. This may also be referred to as "tube swaging." The second category involves
two or more dies used to hammer a round work piece into a smaller diameter. This process is usually called
"rotary swaging" or "radial forging.
Fig: 1 Hot Swage Process
TABLE 1: Specification of Hot Swage Machine 1 Model number FVDP
2 Capacity of production 56 swages per shift 3 Machine cycle time 8 minutes 4 1 time finish length 120mm
5 Mass 3200 kg
6 Heating temperature 900°C 7 Heating Time 40 seconds
8 Diameter of die 150 mm- Ashok Leyland, TATA company ,135 mm-china AMW company 9 Component mass 40 kg
10 Hydraulic pressure 50 tons
This machine was subjected to frequent breakdowns due to improper maintenance; hence breakdown analysis
was carried out to indentify the specific problem in the machine and process, breakdown data was collected
from Jan 2010-Dec 2013.
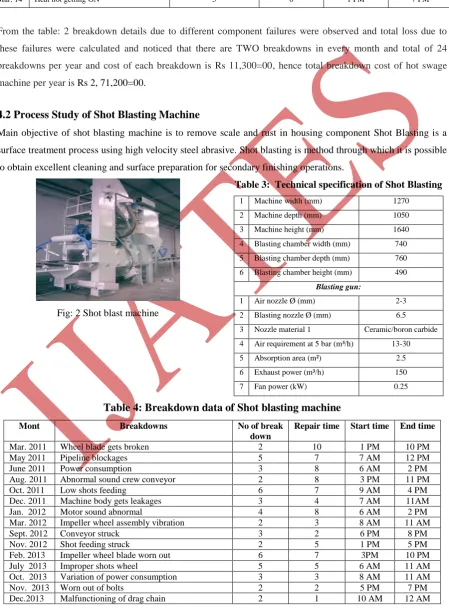
TABLE 2: Breakdown data of hot swage machine Months Reasons for the Breakdown Number
of breakdowns
Time to repair Start time End time (Hours) (Hours) (Hours)
Jan.10 Coolant leakage 1 2 7 AM 9 AM
Mar.10 Movement of the table 2 8 3 PM 11 PM
May 10 Movement of the table 2 6 1 PM 7 PM
Aug.10 Oil leakage 1 1 5 PM 6 PM
Sept. 10 Hydraulic oil leakage loose fitting 2 0.5 2 PM 2.30 PM
Nov.10 Heater getting tripped 5 1 9 PM 10 AM
Feb.12 Machine not Switching ON 2 4 4 PM 8 PM
June 12 Oil leakage 1 2 1 PM 3 PM
Sept.12 Die index not working 2 3 9 AM 12 AM
Nov.12 2nd die not moving up to its position 2 4 3 PM 7 PM
April 13
MCB tripped 1 2 7 AM 9 AM
May 13 Die movement not working 2 5 2 AM 7 AM
253 |
P a g e
July 13 Water leakage from power panel 2 2 4 AM 6 AM
Aug.13 Auto cycle interrupted 1 2 6 PM 8 PM
Sept.13 Water leakage 1 2 1 PM 3 PM
Nov.13 Electrical main panel card defective 2 5 2 PM 7 PM
Dec.13 Hydraulic system getting OFF in auto cycle
4 6 8 AM 4 PM
Jan 14 Movement of the table 3 6 12 PM 6 PM
Feb 14 Die index not working 3 6 2 PM 8 PM
Mar. 14 Heat not getting ON 5 6 1 PM 7 PM
From the table: 2 breakdown details due to different component failures were observed and total loss due to
these failures were calculated and noticed that there are TWO breakdowns in every month and total of 24
breakdowns per year and cost of each breakdown is Rs 11,300=00, hence total breakdown cost of hot swage
machine per year is Rs 2, 71,200=00.
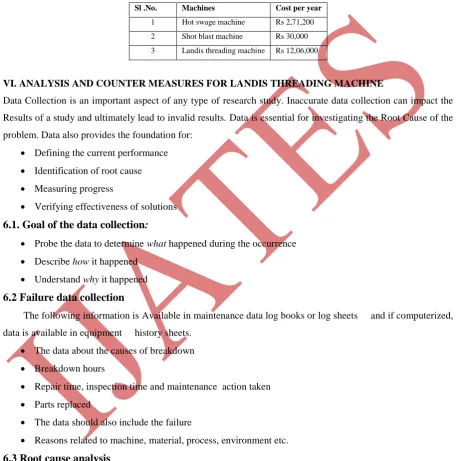
4.2 Process Study of Shot Blasting Machine
Main objective of shot blasting machine is to remove scale and rust in housing component Shot Blasting is a
surface treatment process using high velocity steel abrasive. Shot blasting is method through which it is possible
to obtain excellent cleaning and surface preparation for secondary finishing operations.
Table 3: Technical specification of Shot Blasting
1 Machine width (mm) 1270
2 Machine depth (mm) 1050
3 Machine height (mm) 1640
4 Blasting chamber width (mm) 740
5 Blasting chamber depth (mm) 760
6 Blasting chamber height (mm) 490
Blasting gun:
1 Air nozzle Ø (mm) 2-3
2 Blasting nozzle Ø (mm) 6.5
3 Nozzle material 1 Ceramic/boron carbide
4 Air requirement at 5 bar (m³/h) 13-30
5 Absorption area (m²) 2.5
6 Exhaust power (m³/h) 150
7 Fan power (kW) 0.25
Fig: 2 Shot blast machine
Table 4: Breakdown data of Shot blasting machine
Mont Breakdowns No of break
down
Repair time Start time End time
Mar. 2011 Wheel blade gets broken 2 10 1 PM 10 PM
May 2011 Pipeline blockages 5 7 7 AM 12 PM
June 2011 Power consumption 3 8 6 AM 2 PM
Aug. 2011 Abnormal sound crew conveyor 2 8 3 PM 11 PM
Oct. 2011 Low shots feeding 6 7 9 AM 4 PM
Dec. 2011 Machine body gets leakages 3 4 7 AM 11AM
Jan. 2012 Motor sound abnormal 4 8 6 AM 2 PM
Mar. 2012 Impeller wheel assembly vibration 2 3 8 AM 11 AM
Sept. 2012 Conveyor struck 3 2 6 PM 8 PM
Nov. 2012 Shot feeding struck 2 5 1 PM 5 PM
Feb. 2013 Impeller wheel blade worn out 6 7 3PM 10 PM
July 2013 Improper shots wheel 5 5 6 AM 11 AM
Oct. 2013 Variation of power consumption 3 3 8 AM 11 AM
Nov. 2013 Worn out of bolts 2 2 5 PM 7 PM
254 |
P a g e
Jan. 2013 Improper function of spout unit 4 3 1 PM 4 PM
Feb. 2014 Locking dome nut worn out 3 1 8 PM 9 PM
Mar. 2014 Metallic Shot feed tube inner diameter is less 5 4 12 PM 4 PM
From the table:4 breakdown details due to different component failures were observed and total loss
due to these failures were calculated and noticed that there are FIVE breakdowns in every month and total of 60
breakdowns per year and cost of each breakdown is Rs 500=00, hence total breakdown cost of shot blast
machine per year is Rs 30000=00.
V. PROCESS STUDY OF LANDIS THREADING MACHINE
Main objective of Landis threading is to thread the housing spindle .It is an operation for cutting screw threads on metallic parts. In this operation, as shown in Fig:3, the work piece is held in between the two centres, the
cutting tool is mounted on the tool post and the carriage is connected to the lead screw with the help of a split
nut. The rotation of the lead screw gives the required motion to the carriage relative to the rotation of the work
piece. The depth of cut is selected and the tool is made to move parallel to the axis of rotation of the Work piece
by means of automatic arrangement. By disengaging split nut or half nut, the Carriages brought back to its initial
position to start another cut.
Table 5: Breakdown data of Landis threading machine
SL.
NO.
Problems Number of breakdowns Time to repair
(Hrs)
Start time
(Hrs)
End time
(Hrs)
1. Die holders worn 3 6 9 AM 2 PM
2. Auto lever thread damage 1 4.5 7 PM 11 PM
3. Chaser chip off 1 2 6 PM 8 PM
4. Misalignment of die head 5 4 10 AM 2 PM
5. Worn drive gear 2 6 12 AM 6 PM
6. Die holders worn out 1 9 1 PM 10 PM
7. Die heads bent/tilts t 2 5 7 AM 12 PM
8. Hydraulic power pack not
working
1 1 12 PM 1 PM
9. Dies dull 2 3 6 PM 9 PM
10. Improper cutting fluid flow 2 1 10 AM 11 AM
11. Die holders worn 1 6 1 PM 7 PM
12. Stripping threads 3 5 3 PM 8 PM
13. Incorrect chaser setting 5 7 10 AM 5 PM
14. Die head having play in chaser
mounting unit
2 4 4 PM 8 PM
15. Top clamp not rigid 1 0.5 12.30 PM 1 PM
16. Material hardness variation 1 0.5 3.30 PM 4 PM
17. Incorrect chaser geometry 6 5 9 AM 2 PM
18. Chips fusing to dies 2 .30 7.30 AM 8 AM
19. Teeth on dies worn off 1 .15 11 AM 11.15 AM
20. Die holders worn out 3 8 1 PM 9 PM
From the Table 5 breakdown details due to different component failures were observed and total loss due
255 |
P a g e
breakdowns per year and cost of each breakdown is Rs 15000=00, hence total breakdown cost of Landisthreading machine per year is Rs 12, 06,000=00.
From the above tables breakdown data and reasons for the breakdowns was analyzed and the
production loss of the each machine was calculated and listed in the Table: V From the Table: VI major losses is
due to Landis threading machine and hence detailed analysis of the machine and cause for the failure to be
rectified to reduce the production cost to the industry.
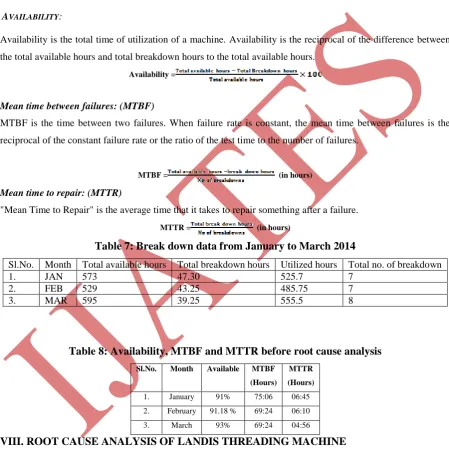
Table 6: Production losses for different machines
Sl .No. Machines Cost per year
1 Hot swage machine Rs 2,71,200
2 Shot blast machine Rs 30,000
3 Landis threading machine Rs 12,06,000
VI. ANALYSIS AND COUNTER MEASURES FOR LANDIS THREADING MACHINE
Data Collection is an important aspect of any type of research study. Inaccurate data collection can impact the
Results of a study and ultimately lead to invalid results. Data is essential for investigating the Root Cause of the
problem. Data also provides the foundation for:
Defining the current performance Identification of root cause Measuring progress
Verifying effectiveness of solutions
6.1. Goal of the data collection:
Probe the data to determine what happened during the occurrence Describe how it happened
Understand why it happened
6.2 Failure data collection
The following information is Available in maintenance data log books or log sheets and if computerized,
data is available in equipment history sheets.
The data about the causes of breakdown Breakdown hours
Repair time, inspection time and maintenance action taken Parts replaced
The data should also include the failure
Reasons related to machine, material, process, environment etc.
6.3 Root cause analysis
Root Cause Analysis is a method that is used to address a problem or non-conformance, in order to get to the
root cause of the problem. It is used to correct or eliminate the
Cause, and prevent the problem from recurring.
6.3.1 Need for root cause analysis
Root Cause Analysis will disclose:
256 |
P a g e
How future failures can be eliminated by:
Changes to procedures
Changes to operation
Training of staff
Design modifications
Verification that new or rebuilt equipment is free of defects which may shorten life:
Tools of root cause analysis:
6.3.2
Fish bone or Cause and Effect diagram
Diagram: Fishbone analysis is an example of root cause analysis specifically, it‘s a type of cause and effect diagram whichhelps you to think through causes of a problem thoroughly.Their major benefit is that they push
you to consider allpossible causes of the problem, rather than just the onesthat are most obvious.
Fig: 4 Fish bone diagram
Causes are usually grouped into major categories to identify these sources of variation. The categories typically
include:
People:Anyone involved with the process. Methods:How the process is performed and the
Specific requirements for doing it, such as policies, procedures, rules, regulations and laws. Machines:Any equipment, computers, tools, etc.required to accomplish the job.
Materials: Raw materials, parts, pens, paper, etc.used to produce the final product. Measurements: Data generated from the process that are used to evaluate its quality. Environment:The conditions, such as location,
Time, temperature, and culture in which the
Process operates.
6.3.3. 5-why analysis
The 5-Why method helps to determine the cause-effect Relationships in a problem or a failure event. It can be
used whenever the real cause of a problem or situation is not clear. Using the 5-Whys is a simple way to try
solving a stated problem without a large detailed investigation requiring many resources. When problems
involve human factors this method is the least stressful on participants. It is one of the simplest investigation
tools easily completed without statistical analysis. Also known as a Why Tree, it is supposedly a simple form of
root cause analysis. By repeatedly asking the question, Why?‘ you peel away layers of issues and symptoms that
can lead to the root cause. You start with a statement of the situation and ask why it occurred. You then turn the
257 |
P a g e
so on. Though this technique is called why –Whys analysis. You may ask more or less Whys before finding the
root of a problem.
6.3.4 Benefits of the 5 Whys
Help identify the root cause of a problem.
Determine the relationship between different root causes of a problem. One of the simplest tools; easy to complete without statistical analysis.
VII.
RESULTS
AND
DISCUSSION
AVAILABILITY:
Availability is the total time of utilization of a machine. Availability is the reciprocal of the difference between
the total available hours and total breakdown hours to the total available hours.
Availability =
Mean time between failures: (MTBF)
MTBF is the time between two failures. When failure rate is constant, the mean time between failures is the
reciprocal of the constant failure rate or the ratio of the test time to the number of failures.
MTBF = (in hours)
Mean time to repair: (MTTR)
"Mean Time to Repair" is the average time that it takes to repair something after a failure.
MTTR = (in hours)
Table 7: Break down data from January to March 2014
Sl.No. Month Total available hours Total breakdown hours Utilized hours Total no. of breakdown
1. JAN 573 47.30 525.7 7
2. FEB 529 43.25 485.75 7
3. MAR 595 39.25 555.5 8
Table 8: Availability, MTBF and MTTR before root cause analysis
Sl.No. Month Available MTBF
(Hours)
MTTR
(Hours)
1. January 91% 75:06 06:45
2. February 91.18 % 69:24 06:10
3. March 93% 69:24 04:56
VIII. ROOT CAUSE ANALYSIS OF LANDIS THREADING MACHINE
Problem Statement: Main causes of spindle thread damage in Landis threading machine were listed using cause and effect diagram
Using cause effect diagram different possible failures were observed and actions were implemented with the
help of Why – Why Analysis some of the failures were listed in the Table 8 and Corrective counter measures
258 |
P a g e
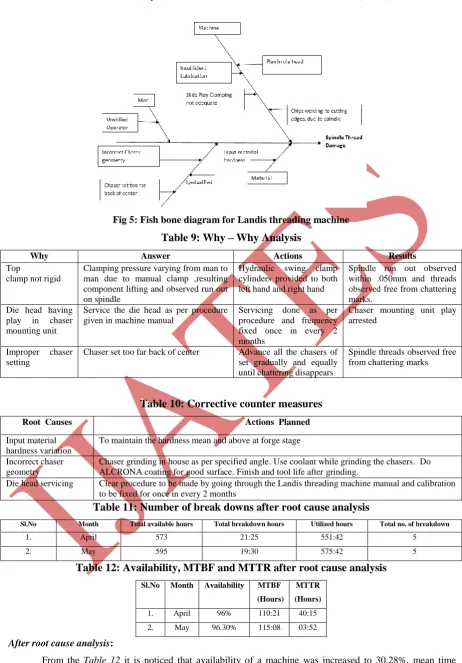
Fig 5: Fish bone diagram for Landis threading machineTable 9: Why – Why Analysis
Why Answer Actions Results
Top
clamp not rigid
Clamping pressure varying from man to man due to manual clamp ,resulting component lifting and observed run out on spindle
Hydraulic swing clamp cylinders provided to both left hand and right hand
Spindle run out observed within .050mm and threads observed free from chattering marks.
Die head having play in chaser mounting unit
Service the die head as per procedure given in machine manual
Servicing done as per procedure and frequency fixed once in every 2 months
Chaser mounting unit play arrested
Improper chaser setting
Chaser set too far back of center Advance all the chasers of set gradually and equally until chattering disappears
Spindle threads observed free from chattering marks
Table 10: Corrective counter measures
Root Causes Actions Planned
Input material hardness variation
To maintain the hardness mean and above at forge stage
Incorrect chaser geometry
Chaser grinding in house as per specified angle. Use coolant while grinding the chasers. Do ALCRONA coating for good surface. Finish and tool life after grinding.
Die head servicing Clear procedure to be made by going through the Landis threading machine manual and calibration to be fixed for once in every 2 months
Table 11: Number of break downs after root cause analysis
Sl.No Month Total available hours Total breakdown hours Utilized hours Total no. of breakdown
1. April 573 21:25 551:42 5
2. May 595 19:30 575:42 5
Table 12: Availability, MTBF and MTTR after root cause analysis
Sl.No Month Availability MTBF
(Hours)
MTTR
(Hours)
1. April 96% 110:21 40:15
2. May 96.30% 115:08 03:52
After root cause analysis:
From the Table 12 it is noticed that availability of a machine was increased to 30.28%, mean time
between the failures is increased by 74.89% and mean time to repair was decreased by 43.03%. Similarly
259 |
P a g e
After implementation of root cause analysis numbers of breakdowns were minimized and it is noticed
that Rs 90,000 to one lakh can be saved per year. Hence preventive maintenance checklist has been
suggested to the company in order to reduce maintenance, inventory to enhance production and profit as shown
in Table 13
Table 13: Preventive Maintenance checklist Suggested
Visual check of mains Electrical Switches, Wiring and/or Conduit (Cracks, broken controls etc.) Arrange for immediate repair
of any faults
Daily
Verify all Guards are secure and function correctly (Check latches, locks, fasteners and/or interlocks) Daily
Ensure workspaces and walk-ways are clear and unobstructed and that no slip-hazards are present Daily
Confirm availability and condition of Personal Protective Equipment Daily
Lubricate lightly according to manufacturer’s specification Daily
Conduct close inspection for damage to Switch Gear Test operation of Switch Gear (Proper function of switch controls) Weekly
Lubricate lightly according to manufacturer’s specification Weekly
Lubricate ways and slides according to manufacturer’s specification Weekly
Conduct close inspection for damage to Switch Gear Test operation of Switch Gear (Proper function of switch controls) Weekly
Lubricate lightly according to manufacturer’s specification Weekly
Lubricate ways and slides according to manufacturer’s specification Weekly
Check the availability of spare parts i.e. belts cutting tools etc Quarterly
Lubricate all points in accordance with the manufacturer's specification Quarterly
Adjust Gibb strips on all slides according to manufacturers specification Quarterly
Check floor space for oil contamination Quarterly
Replace suds (if used) Quarterly
Protect all bare metal surfaces before Term Shutdown Quarterly
Clear away accumulated scarf and waste from inside and around housings, cabinets etc Quarterly
Examine drive belts for Flaws & Correct Tension - Adjust if necessary Quarterly
Check pulleys for Correct Alignment - Adjust if necessary Quarterly
Check security of all Fixed Guards Quarterly
Check gear train (Stud gear, change gear etc.) for correct mesh and alignment - Adjust if necessary Quarterly
Examine bolts used for mounting the motor to the machine. Re-tighten if necessary Quarterly
Check the security of Machine Mountings to the floor or base block Quarterly
Remove any raised metal with appropriate reamer Quarterly
Check condition of line markings defining Operator Zones and Access Walkways Yearly
Review Safety Operating Procedure and update if necessary Yearly
IX.CONCLUSIONS
This paper was intending to determine the breakdown analysis of Hot Swage machine, Shot Blasting machine
and Landis threading machine. It was identified that breakdowns and production loss in Landis threading
machine causes major loss to the company, hence detailed study was carried out to determine availability,
MTTR and MTBF. Root cause analysis like why-why analysis, fish bone diagram and corrective counter
measures are implemented to identify the actual cause of the breakdown. By implementing average availability
260 |
P a g e
This in turn helped to develop and improve a new preventive maintenance schedule and checklist for the
machine to enhance production.
REFERENCES
[1] Anderson, B., & Fagerhaug, T., (2000). Root Cause Analysis: Simplified Tools and Techniques.
Milwaukee: ASQ Quality Press.
[2] Arcaro, J. S. (1997). TQM Facilitator’s Guide. Boca Raton,FL: St. Lucie Press.
[3] Brassard, M., & Ritter, D. (1994).The Memory Jogger II: A Pocket Guide of Tools for Continuous
Improvement and Effective Planning. Salem, NH: GOAL/QPC.
[4] Brassard, M. (1996). The Memory Jogger Plus+: Featuring The Seven Management and Planning Tools.
Salem, NH: Goal/QPC.
[5] Brown, J. I. (1994). Root-Cause Analysis in Commercial Aircraft Final Assembly. Master’s Abstracts
International, 33(6), 1901-. Cox, J. F. III, & Spencer, M. S. (1998). The Constraints Management
Handbook.
[6] Dean, L. G. (2007). Comparison of Common Root Cause Analysis Tools and Methods. Apollo Root Cause
Analysis – A new way of Thinking, 3rd Edition.
[7] Dettmer, H. W. (1997). Goldratt’s Theory of Constraints. Milwaukee: ASQC Press.
[8] Duggett, A. M. (2004). A statistical Comparison of Three Root Cause Tools. Journal of Industrial
Technology.
[9] Robson, M. (1993). Problem Solving In Groups. 2nd Edition. Brookfield, VT: Gower.
[10] Smith, D. (2000). The Measurement Nightmare: How the Theory of Constraints Can Resolve Conflicting
Strategies, Policies, and Measures. Boca Raton, FL: St. Lucie Press.
[11] Sproull, B. (2001). Process Problem Solving: A Guide for Maintenance and Operations Teams. Portland:
Productivity Press.
[12] Wilson, P. F., Dell, L. D., & Anderson, G. F. (1993). Root Cause Analysis: A Tool for Total Quality