OPTIMIZATION OF THE PARAMETERS IN
WELDING OF PLASTICS USING FRICTION
WELDING
Shubham Jain
1, Shashank Singh
2, Saransh Tiwari
3, Anoop Pandey
41,2,3
Student B.Tech,
4Sr. Assistant Professor, Department of Mechanical Engineering,
ABES Engineering College, (India)
ABSTRACT
This paper is the part of study that aims at optimization of process parameters of tensile strength for PE-100
plasticswhich is widely used foe potable water transportation system using Taguchi approach. Nine cylindrical
bars of PE-100 plastics of outer diameter 30mm are welded through friction in each experiment for different
spindle speeds. Revolutions per minute of rotor, weld time, axial force are taken as the process parameters. A
Taguchi orthogonal array is designed with three levels of parameters and analysis of S/N ratios, response table
and regression equations were made with the help of Minitab 17 software. Analysis showed that weld time plays
a pivotal role in the strength of the weldment.
Keywords: DOE, PE-100,S/N Ratio, Taguchi Method etc.
I. INTRODUCTION
Friction welding (FW) is a fairly recent technique that utilizes a non-consumable welding tool to generate
frictional heat and plastic deformation at the welding location, there by affecting the formation of a joint while
the material is in solid state. Friction welding is used with metals and thermoplastics in a wide variety
specifically in aviation and automotive applications[1]. This is particularly useful in water and gas pipeline for a
leak proof joint of high density polyethylene pipes as per PE 100+ association.
Attaining optimum tensile strength in the presence of constraints like blow off length and economics of joining
of plastics is one of the challenging tasks encountered by many growing industries these days. Taguchi method
can help in optimizing these parameters taking into consideration of economy[2].
For tensile strength, the solution is “larger is better” and S/N ratio (signal to noise ratio) is determined by the
following equation:
S/N = -10 *log(Σ(1/Y2)/n) (1)
Where n = No. of Measurements, y = Measured Value which is in MPa.
In this experiment, 3 parameters are chosen having 3 levels. Without using Taguchi method total number of
experiments should be 33=27 numbers. But using Taguchi L9 array as shown in table 1, 9 experiments are
proposed providing nearly same accuracy. These nine experiments will give 98% accurate result. By using this
Table 1: Design of Experiment
S.NO. TIME (SEC) F (N) RPM
1 50 28.72 1490
2 50 25.80 1440
3 50 9.81 1410
4 40 25.80 1490
5 40 9.81 1440
6 40 28.72 1410
7 30 9.81 1490
8 30 28.72 1440
9 30 25.80 1410
II. EXPERIMENTAL SET UP DETAILS
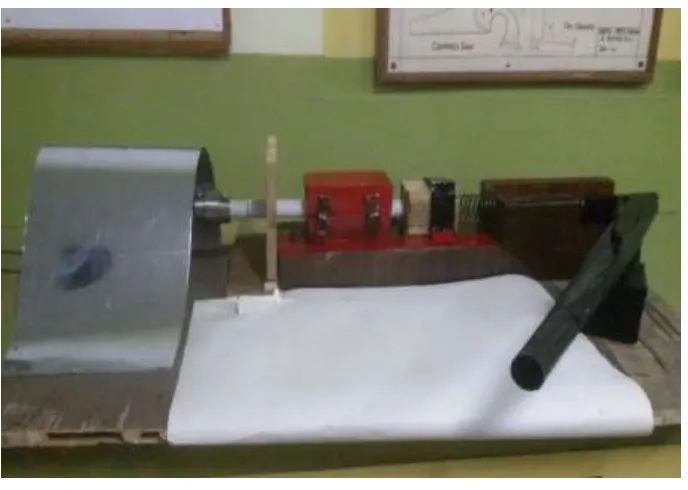
Animage of setup used for producing required welds is shown in figure 1.
Fig. 1: Welding Setup
2.1 Work Material
PE-100 is a High Density Polyethylene plastics having Hydrostatic strength of 10MPa. Table2 shows the
mechanical and thermal properties of PE-100.
Table 2: Mechanical and Thermal properties of PE-100
S.No Parameters Standard
1 Density, kg/cm3
at 23 °C
at 20 °C
954-960
2 Melt Flow Index at 190 °C, g/10 min.:
a) at 212 N (21.6 kgf )
b) at 49 N (5 kgf )
5-7
0,1
3 MFI21,6/MFI2.16 ratio 100-170
4 MFI spread within one batch, %, maximum 10
5 Tensile yield strength, MPa, minimum 21
6 Elongation at break, %, minimum 500
7 Carbon black weight content, % 2,0-2,5
8 Volatile weight content, mg/kg, maximum 350
9 Melting Point 95-100 °C
As seen from the table because of the lower melting point it cannot be welded by conventional fusion welding
methods so, there is a need of friction welding. Proper set of parameters are to be chosen to obtain optimum
tensile strength without degrading the properties of the material [3].It can be well understood that tensile
strength of welded pieces would be less than the continuous piece. Through this optimization process, it is
attempted to obtain optimum tensile strength of the joint closest to the minimum strength mentioned in the table
2.
2.2 Motor and Coupling
A 0.5 HP single phase AC induction motor coupled with stainless steel rigid coupling is deployed to hold the
rotating part of the work piece.
2.3 Spring
Spring with modulus of rigidity 84GPa is used to transfer uniform axial force to the stationary part of the work
piece.
III. EXPERIMENTAL PROCEDURE
The procedure for welding PE-100 having outer diameter = 30 mm and inner diameter = 21mm
can be described best in the three steps as follows:
STEP 1: Component in the spindle is brought up to pre-determined rotational speed and then a pre-determined
axial force is applied.
STEP 2: These conditions are maintained for a pre-determined amount of time until desired temperatures and
material conditions arrives.
STEP 3: Motor is then stopped and axial force is applied until desired upset is obtained. Then the components
are unloaded and the cycle is repeated [4].
After performing experiments 3 values of each parameter i.e. at 3 levels are obtainedso that the efficient weld
Table 3: Welding parameters and levels
Time (Seconds) Axial force (N) RPM
Level 1 50 28.72 1490
Level 2 40 25.8 1440
Level 3 30 9.81 1410
Using Taguchi L9 array and DOE, the experiments are designed as shown in the Table 1 above. Using Ultimate
Testing Machine (UTM) the tensile strength of various welded samples are obtained which are shown in Table
4.
Table 4: Experimental Values of Tensile Strength
S.NO. TIME (SEC) F (N) RPM Tensile Strength. (MPa)
1 50 28.72 1490 12.3
2 50 25.80 1440 11.7
3 50 9.81 1410 11.7
4 40 25.80 1490 11.8
5 40 9.81 1440 11.1
6 40 28.72 1410 11.6
7 30 9.81 1490 8.3
8 30 28.72 1440 9.4
9 30 25.80 1410 6.7
IV. DATA ANALYSIS
After performing experiments, parameters are optimized by using Minitab 17 software. The calculation, results
and graphs of S/N ratio, response table and regression equation are obtained from Minitab 17 software and are
shown in Fig. 2.
S/N plots:
V. RESULT
Following points are observed from fig. 2:
a) S/N ratios increases as weld time increases and reaches maximum at 50 seconds value of weld time.
b) S/N ratio increases as the RPM increases and after 1440 RPM almost becomes constant.
c) S/N ratio decreases as the axial force increases, achieves minimum value at an axial force of 25.80 N
and then increases.
5.1 Response table
Table 5: Response Table for Signal toNoise Ratios obtained @ Minitab 17
LEVEL Time (sec) RPM Axial force
1 18.12 19.72 20.22
2 21.21 20.58 19.77
3 21.51 20.54 20.85
Delta 3.39 0.85 1.08
Rank 1 3 2
Table 6: Response Table for Means obtained @ Minitab 17
LEVEL Time (sec) RPM Axial force
1 8.133 10.00 10.367
2 11.500 10.733 10.067
3 11.900 10.800 11.100
Delta 3.767 0.800 1.033
Rank 1 3 2
As observed form the response table, weld time is ranked 1, axial force ranked 2 and RPM is ranked 3 in
optimization of tensile strength.
5.2 Regression Equation
Regression equation was implemented to obtain the correlation between the welding parameters and tensile
strength of welded samples.
The regression equation is:
T.S (MPa) = -10.6 + 0.1883 TIME (SEC) + 0.0091 RPM + 0.0194 F (N) (2)
From the Plots & SN Ratio table it is clear that optimum conditions for optimum Ultimate Tensile Strength
(UTS) are:
Time = 50 sec
Speed = 1440 RPM
Using These Optimised Conditions the Optimum Tensile Strength Comes Out To Be 12.3 Mpa.
From the response tableit can be concluded that TIME, which gets least attention in most of the literatures turns
out to be the most influential factor in our analysis followed by AXIAL FORCE and SPEED.
VI. CONCLUSION
Weld time as one of the parameters in friction welding has not drawn attention of many researchers [6], while as
witnessed in the study, it has come out to be the most influential parameter. In this piece of study other
parameters such as burn off length, coefficient of friction etc. have not been considered for optimizing tensile
strength, these parameters if taken into account [7] will cause number of experiments to increase accordingly
butprecise results can be obtained. Besides this the process can also be used for welding different grades of
materials with suitably optimized parameters [4].
REFERENCES
[1] Alves, Eder Paduan, Francisco Piorino Neto, and Chen Ying An. "Welding of AA1050 aluminium with
AISI 304 stainless steel by rotary friction welding process." Journal of Aerospace Technology and
Management 2.3 (2010): 301-306.
[2] Can, Ahmet, M. Sahin, and Mahmut KücüK. "Modelling of friction welding." International Scientific
Conference. Vol. 2. 2010.
[3] Kumar, Sandeep, Rajesh Kumar, and Yogesh Kumar Singla. "To study the mechanical behaviour of friction
welding of aluminium alloy and mild steel." International Journal of Mechanical Engineering and Robotics
Research 1.3 (2012): 43-50.
[4] Sassani, F., and J. R. Neelam. "Friction welding of incompatible materials." Welding Journal 67.11 (1988):
264-270.
[5] Kumar, Mr Sachin, Mr Deepak Bhardwaj, and Mr Jagdeep Sangwan. "A Research Paper on Temperature
Modelling of Friction Welding”.
[6] Shrikrishana, Kulkarni Anup, and P. Sathiya. "Finite element modelling and characterization of friction
welding on UNS S31803 duplex stainless steel joints." Engineering Science and Technology, an
International Journal 18.4 (2015): 704-712.
[7] Mercan, Serdar, Sinan Aydin, and Niyazi Özdemir. "Effect of welding parameters on the fatigue properties
of dissimilar AISI 2205–AISI 1020 joined by friction welding." International Journal of Fatigue 81 (2015):