78
Developing A Simple Survey Procedure For
Seismic Risk Evaluation In 2012 Thabeikkyin
Earthquake, Upper Myanmar
Nan Pawt Sai Awar, Dr. Aye Mya Cho
Abstract: Myanmar is located in earthquake prone zones in the world seismic map. The Sagaing fault line crossing north to south of the Myanmar is capable of producing damaged earthquake in present and future. Large earthquakes had recorded in this fault for many years. The 2012 Thabeikkyin earthquake occurred because of a sudden movement of the Sagaing fault. Many buildings were collapsed and damaged during this earthquake. An effective and simple risk evaluation procedure for the buildings did not have yet. This study aims to evaluate seismic risk with a simple survey procedure based on Rapid Screening Procedure for the local houses in Upper Myanmar. This procedure is used for some local houses in earthquake-affected areas during earthquake. The average percentage of the accepted houses in this study is about 84.7%. From the past study, the percentage of no damage to moderate damage in brick-nogging buildings is about 86% (646 buildings of the total 751 buildings). The result shows that most of the local houses are safe and good condition.
Keywords: simple procedure, seismic risk, evaluation, local houses, Thabeikkyin Earthquake
————————————————————
1 Introduction
MYANMAR has experienced many destructive earthquakes in the past. After the 1900, the significant earthquakes of magnitude M>6.0 occurred in Myanmar are as follows: 1912 Maymyo Earthquake, 1927 Yangon Earthquake, 1929 Swa Earthquake, 1930 Bago Earthquake, 1930 Phyu Earthquake, 1931 Kamaing Earthquake, 1946 Tagaung Earthquake, 1956 Sagaing Earthquake, 1975 Bagan Earthquake, 1991 Htichaing Earthquake, 2003 Taungdwingyi Earthquake, 2011 Tarlay Earthquake, 2012 Thabeikkyin Earthquake and 2016 Chauk Earthquake. These earthquakes result in severe property damage and loss of human lives. The occurrence of these earthquakes clearly shows the high seismic hazard in Myanmar. The 2012 Thabeikkyin Earthquake with magnitude 6.8 occurred near Thabeikkyin Town on Sunday, November 11 at 7:42 A.M. The epicentral location is 23.009° N, 95.884° E (Source: USGS, NEIC), 45 miles northeast of Shwebo. According to the field investigation and observations, it caused because the sudden movement of the Sagaing Fault. Although the magnitude of the earthquake was moderate, many buildings such as residential, governmental, schools, hospitals and religious buildings were severely affected not only in Thabeikkyin Town but also in the villages and towns near Thabeikkyin Township. Therefore, this earthquake was called Thabeikkyin Earthquake. During earthquake, there were many buildings such as residential houses, governmental buildings, schools, hospitals, monasteries and pagodas were damaged, and some destroyed. Most buildings surrounding the epicentral area were poorly built with scarcely any earthquake resistant features. Most people were living in non-engineered houses that were mostly built with less consideration to the earthquake risk. The people mostly have less awareness in earthquake threat.
It is therefore important to assess the seismic vulnerability of buildings in potential earthquake affected areas. Simple procedure is needed to evaluate the vulnerability of building rapidly. From this, the seismic risk of the buildings will be evaluated in the affected study areas.
2
S
CREENINGP
ROCEDURES FORE
ARTHQUAKEV
ULNERABILITYFEMA 310 (FEMA, 1988) is the most useful seismic evaluation procedure for existing buildings. The evaluation procedure is based on precise approach to determine the extent of structural damage of existing structural conditions. D. C. Rai [6] describe that FEMA 310 considers two levels of performance defined as life safety and immediate occupancy during design earthquake. For life safety performance, the building can sustain significant damage to both structural and nonstructural components with some margin against either partial or total structural collapse such that level of risk for life-threatening injury and being trapped is low. Immediate occupancy building performance means very limited damage to both structural and nonstructural components during the design earthquake. In general, there are three level processes for the seismic evaluation of existing buildings for reducing margin of safety, as described below:
1. Rapid visual screening (RVS) or Level 1 (Tier 1) procedure requires only visual evaluation and small additional information known as ―Walk down Evaluation‖ which is not involve any numerical analysis. This procedure can be quickly used to decide whether the building complies with the provisions of the FEMA 310. This procedure is recommended for all buildings.
2. Simplified vulnerability assessment (SVA) or Level 2 (Tier 2) procedure is also known as Preliminary assessment methodologies (PMA). This procedure requires the use of computer and simple engineering analysis to estimate the potential seismic hazard of the buildings. This procedure is recommended for all buildings with high concentration of people.
3. Detailed vulnerability assessment (DVA) or Level 3 (Tier 3) procedure requires detailed engineering analysis (mostly by computer software). This procedure is recommended for all important and lifeline buildings.
____________________________
Dr. Aye Mya Cho is a professor in Department of Civil Engineering in Mandalay Technological University, Myanmar.
79 2.1 Rapid Visual Screening (RVS) Assessment
The rapid visual screening (RVS) method is designed to use without any structural calculation. This method includes the scoring system to identify the primary lateral load-resisting system of structure. The screening is based on numerical seismic hazard and vulnerability score. The scores are based on the expected ground shaking levels in the areas as well as the seismic design and construction practices for the town or the area. The scores use probability concepts and are consistent with the advanced assessment methods. It is easy to use and rapid assessment of building‘s risk.
The RVS method can be used in both urban and rural areas. However, the various construction practices are more easily quantifiable for urban areas and the reliability of the RVS results for rural areas may be low. Therefore, it is more desirable to use RVS methodology for non-standard constructions in rural areas only with adequate carefulness. Because the RVS methodology is also not intended for structures other than buildings such as bridges and lifeline facilities, the detailed evaluation method is suggested to use for these structures. Some very weak forms of non-engineered buildings in urban areas are not required RVS to estimate their vulnerability for their low seismic vulnerability. Therefore, it is preferable that the RVS methodology can be used for non-engineered buildings in rural areas only with some modification.
2.2 Advantages of RVS Method
According to Prof. Ravi Sinha and Prof. Alok Goyal [1], the results from rapid visual screening can be utilized as an integral part of the earthquake disaster risk management programme of a region for a variety of application. The main advantages of this method are:
1. To identify whether a particular building needs further evaluation for assessment of its seismic vulnerability. 2. To rank a city‘s or community‘s (or organization‘s) seismic
rehabilitation needs.
3. To design seismic risk management program for a city or a community.
4. To plan building safety evaluation efforts after earthquake. 5. To develop building-specific seismic vulnerability
information for purpose such as regional rating, prioritization for redevelopment etc.
6. To identify simplified retrofitting requirements for a particular building (to collapse prevention level) where further evaluations are not feasible.
7. To increase awareness among people regarding seismic vulnerability of buildings.
2.3 The RVS Methodologies
The objective of the RVS procedure is generally to inspect seismic vulnerability level of a particular building based on the cut-off points as a level either has acceptable or hazardous or should be studied further in detail. A procedure for rapid visual screening (RVS) was first proposed by Federal Emergency Management Agency in FEMA-154 on 1988 for identifying, recording and ranking buildings that are probably seismically dangerous in the US (FEMA, 1988a) which was further modified in 2002 (FEMA 2002) to facilitate new technological improvement and also experience lessons from previous earthquake hazards. RVS procedure has been widely used in many other countries with some modification related to the local condition. FEMA RVS uses a methodology to examine
the main structural system and the use of materials in the building with a score based on basic structural hazard (BSH) by modifying optional condition in the building with performance modification factors which will modify the score (PMFs). Structural hazard score is a measure of the probability of major seismic damage being 60% or greater of the building value in FEMA-155/ATC 13-1985 (FEMA, 1988b).
Basic Structural Hazard Score= -log (probability of damage >= 60%)
The calculated probabilities of collapse versus final score, S, described by Y. Wang and K. A. Goettel [9] is shown in Table 1. If the probability of damage exceeding 60%, given value for the building site, is, for example, 0.001, then the Basic Structural Hazard score is 3. If the probability is 0.01, then it is 2, and so on. The final score as structural score ‗S‘ is calculation (subtraction) of basic score (defined by main system and material) and modification aspect found as PMFs.
S(Structural Score) = BSH(Basic Structural Hazard)+PMFs (Performance Modification Factor)
FEMA RVS scores range from 0-4 based on logarithmic calculation. Low ‗S‘ score means that the building is vulnerable and needs for further detailed analysis. High ‗S‘ score shows that the building is probably safe from earthquake damage. The cutoff value of 2.0 is typically suggested by FEMA 154, which means 1% chance of collapse at ground shaking. The seismic performance of a building could be modified by many factors to be different from the regular. A set of Performance Modification Factors (PMFs) are subtracted from Basic Structural Hazard in order to find a final structural score ‗S‘. PMFs considers all important aspects such as floor number, construction quality, irregularities in vertical or plan in the structural system, soft storey, pounding, cladding, soil/ground condition and ambience (FEMA, 1998a).
3 S
TUDYA
REASAccording to 2012 Thabeikkyin earthquake, some areas were affected during earthquake, namely Mandalay, Inwa, Amarapura, Sagaing, Thabeikkyin, Kyauk Myaung and Singu in Mandalay District and Sagaing District, and especially Thabeikkyin Township, Kyauk Myaung Township and Singu Township had severely damaged. Field investigations have been carried out Twin Nge village, Ma Lae village, Thabeikkyin Town, Kyauk Myaung Town, Ma Lar village and Singu Town. These are the most affected areas during earthquake. Location of earthquake epicenter and main affected areas are shown in Fig. 1 and location of earthquake occurrence and study areas are shown in Fig. 2.
TABLE1:CALCULATED PROBABILITIES OF COLLAPSE VERSUS
FINAL SCORE,S
80
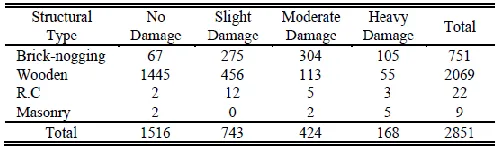
During field investigation, buildings were classified as R.C, brick-nogging, masonry and wooden buildings according to their structural types. Wooden building type is the most constructed building type. However, it can be seen that the most damaged structural type of building was brick-nogging (brick walls framed with timber posts) from field survey and recorded photographs. They can also be classified as residential buildings and non-residential buildings such as governmental offices, hospital (including dispensaries), school and religious buildings by the usage of buildings. During collecting data, the information about the damage of residential buildings was gathered the most in this study. Statistic data about the structural types of buildings and the damage statistics of buildings in the study areas are described in Table 2 and Table 3.
The damages are arranged for three damage grades namely slight, moderate and heavy to classify the damage degree based on EMS-98 [7]. Each damage grade depends on the range of damage affected in each building and the structural type of building. The classifications of damages are as follows: slight damage (fine cracks in plaster; falling of small pieces of plaster), moderate damage (fine and/or large cracks in walls; the vertical and diagonal cracks at wall intersection; spalling of
TABLE2:STATISTIC DATA ABOUT THE STRUCTURAL TYPES OF
BUILDINGS IN THE STUDY AREAS
TABLE3:DAMAGE STATISTICS OF BUILDINGS IN THE STUDY
AREAS Fig. 1. Location of Epicenter and Main Affected Areas
of the Earthquake
81 fairly large pieces of plaster; falling of parts of walls and gable
walls), heavy damage (large and deep diagonal cracks in most walls; large and deep vertical cracks at wall intersection; falling of gable walls; partial or total collapse of one or more walls; collapse of building partitions; tilting of the building; total collapse of the building) [7].
4 RVS
S
CORE FORB
RICK-
NOGGINGB
UILDINGSIn this study, RVS score for brick-nogging buildings only are emphasized and calculated according to FEMA P-155 [4]. There are 17 building types in FEMA P-155 (Third Edition). The factors for RVS score for brick-nogging building are depended on light wood frame single- or multiple-family dwellings of one or more stories in height (W1) of FEMA P-155.
4.1. RVS Basic Score
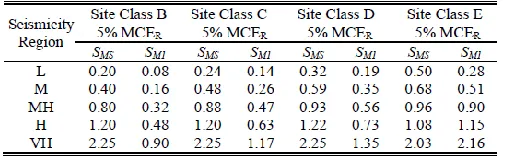
Basic scores are generally calculated for five unique seismicity regions in the Third Edition. Five seismicity regions are considered: Low, Moderate, Moderately High, High, and Very High. These seismicity regions are delimited by ranges of spectral response acceleration parameters. Table 4 shows the ranges for Ss, spectral response acceleration parameter for 5%-damped maximum considered earthquake (MCER) at a
period of 0.2 seconds, and S1, spectral response acceleration parameter for 5%-damped MCER at a period of 1 second,
assuming Soil Type B. Table 5 presents SS and S1 values and the resulting seismicity region for the study areas. The SS and S1 values were obtained from the U.S. Seismic Design Maps
web application on the USGS website
(http://geohazards.usgs.gov/designmaps/ww/) using the latitude and longitude shown corresponding to a point within
each study area. To calculate the basic scores, the median spectral acceleration values from Table 4 (assumed to be based on Soil Type B) are adjusted by multiplying SS by Fa (the short-period site coefficient) and S1 by Fv (one-second period site coefficient). The resulting values are shown in Table 6 and used to develop an initial spectrum. The coefficient for soil type B is equal to unity. To find the basic score, the capacity curves are firstly developed for one-storey and two-storey brick-nogging buildings. The capacity curve is defined by the yield capacity and ultimate capacity points, (Dy, Ay) and (Du, Au) respectively. OSHPD HAZUS (OSHPD refers California Office of Statewide Health Planning and Development) provides the following equations to define building capacity:
(1)
(2)
(3)
(4)
Where Cs is the seismic design coefficient, γ is yield strength factor, 1 is modal weight factor, Te is elastic period in seconds, λ is overstrength factor, and μ is ductility factor. The values of Cs, γ, 1, Te, λ and μ are obtained from Appendix A Tables A-1 through A-5 in FEMA P-155. Fig. 3 and Fig. 4 show the building capacity curves of one-storey and two-storey wood-frame buildings. To develop the capacity curve, it has to be used the following equation. With a small increment of D, the spectral acceleration A is as follow: A = (D/Dy) x Ay (5)
If D is greater than Dy, the spectral acceleration A is as follow: A = b[1-((D-Du)/a) 2 ]1/2+k (6)
TABLE4:RANGE AND MEDIAN MCERSPECTRAL RESPONSE ACCELERATION VALUES IN EACH SEISMICITY REGION
TABLE6
MEDIAN SPECTRAL ACCELERATION VALUES IN EACH SEISMICITY
REGION FOR SOIL TYPE B,C,D AND E
TABLE5:SEISMICITY REGIONS IN THE STUDY AREAS
1 /
s
y C
A
2
8 .
9 y e
y A T
D
y
u A
A
y
u D
82
The transition from yield point to ultimate point of the capacity curve is assumed elliptical by the following equation.
(7)
Therefore, the constant values a, b and k are calculated from (8) through (10).
(8)
(9)
(10)
For one-storey building, Ay and Dy values are 0.50625g and 0.608 in, and Au and Du values are 1.0125 g and 7.296 in. The elliptical portion of capacity curve, the values of k, b and a are 0.45, 0.5625 and 6.7217. Also for two-storey building, Ay and Dy values are 0.46875 g and 0.663 in, and Au and Du values are 0.9375 g and 7.96 in. The elliptical portion of capacity curve, the values of k, b and a are 0.4167, 0.5208 and 7.3336. The selected study areas are in Very High seismicity region (in
Table 5). We choose High and Very High seismicity regions for the calculation. Therefore, the input spectral acceleration values for Ss,avg and S1,avg are 1.20 g and 0.48 g for High seismicity region, and 2.25 g and 0.90 g for Very High seismicity region according to Table 4. The next step is to compute modified input spectral acceleration response values, SMS and SM1. From Table 6, the medium spectral acceleration values, SMS and SM1 are 1.20 g and 0.48 g for High seismicity region, and 2.25 g and0.90 g for Very High seismicity region. Soil Type is assumed Type B. To develop a 5%-damped response spectrum, it has to use the following equations [4]. At short period (acceleration domain), 0 < T < TS:
SA (T) = SMS/RA (11)
At long period (velocity domain), TS < T < TVD:
SA (T) = (SM1/T)/RV (12)
SD (T) = 9.8 x SA x T 2
(13)
where:
SA(T) = spectral acceleration response in g at period, T SD(T) = spectral displacement response in inches at period, T TS = the transition period between the constant acceleration
and the constant velocity regions of the response spectrum = (SM1/SMS) x (RA/RV)
RA = reduction factor in acceleration domain RV = reduction factor in velocity domain
βeff = effective damping = elastic damping (βE) + hysteretic damping (βH )
βH = hysteretic damping = κ(Area/2πDA)
To develop a 5%-damped response spectrum, it has to find the following values. For the High seismicity region, SMS=1.20 g, SM1=0.48 g, βeff=5%,
RA = = 1.00
RV = = 1.00
TS = = 0.4
TABLE7:5%-DAMPED RESPONSE SPECTRUM FOR SOIL TYPE
B IN HIGH SEISMICITY REGION Fig. 3. Building Capacity Curve for One-storey Building
Fig. 4. Building Capacity Curve for Two-storey Building
1 2 2 2 2 b k A a D D u
y u
y y y u u y y y y u u y y u y y D D D A A A D D D A A A k k A b k A D D b A D a 2 2 2 2 2 ) 5 ln( 68 . 0 21 . 3 12 . 2 ) ln( 68 . 0 21 . 3 12 . 2
eff
) 5 ln( 41 . 0 31 . 2 65 . 1 ) ln( 41 . 0 31 . 2 65 . 1
eff
00 . 1 00 . 1 20 . 1 48 . 0
1
83
For the Very High seismicity region, SMS=2.25 g, SM1=0.90 g, βeff=5%,
RA = 1.00 RV = 1.00 TS = 0.4
The demand response spectrum is assumed 5% damping in the previous step. The next step is to calculate the peak response, i.e., the intersection of the demand and capacity curves. The peak response is calculated by developing a ―βeff -damped locus demand spectrum‖. In FEMA P-155, the calculation processes are shown as follow: start at a
displacement value ‗D‘ with very small increment, compute the acceleration value ‗A‘ on the capacity curve for each value of ‗D‘, compute the period ‗T’ =(D/9.8A)1/2
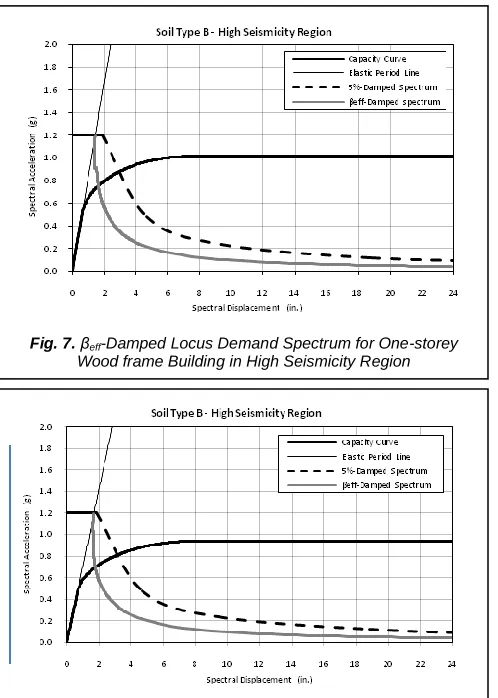
from D and A, compute the area enclosed by the hysteresis loop up to the given (D, A) point, compute the effective damping ‗βeff‘ based on the area, compute RA and RV based on βeff, compute the demand curve point (SA, SD) reduced according to RA and RV, overlay the capacity curve on the βeff-damped spectrum and take the intersection as the peak response. Fig. (7) to Fig. (10) show βeff-damped locus demand spectrum for wood frame one-storey and two-one-storey buildings in High and Very High seismicity regions.
From the overlay of the capacity curve and demand spectrum shown in Fig. (7) through Fig. (10) the peak responses are taken as 1.642 in, 1.78 in, 3.86 in and 4.23 in. This is compared to the elastic displacement, De, as shown in Table 9. After getting the peak response values, the fragility curves are developed with the medium value of the Complete (C) structural damage state with the following equation.
(14)
Values for ∆C, HR, 2 and 3 are determined by using the Appendix A tables in FEMA P-155. The medium values of the Complete structural damage state are 9.45 in and 13.39 in for one-storey and two-storey in High seismicity region, and 9.45 in and 13.39 in Very High seismicity region. To develop the fragility curves, the lognormal standard deviation (beta) factor
TABLE8:5%-DAMPED RESPONSE SPECTRUM FOR SOIL TYPE
B IN VERY HIGH SEISMICITY REGION
Fig. 6. 5%-Damped Response Spectrum for Very High Seismicity Region
) /
( 2 3
,C C R
d H
S
Fig. 5. 5%-Damped Response Spectrum for High Seismicity Region
Fig. 6. 5%-Damped Response Spectrum for Very High Seismicity Region
Fig. 7. βeff-Damped Locus Demand Spectrum for One-storey Wood frame Building in High Seismicity Region
84 is determined by the following equation.
(15)
βC,D is determined using Appendix A Table A-10 in FEMA P-155. βCAP and βT,C are taken as 0.3 and 0.4. X is taken as 0.75 for all FEMA P-154 calculations. D and De are taken above. The βC.P values of the one- and two-storey buildings in High and Very High seismicity regions are 0.81024, 0.8216, 0.7798 and 0.7895. The resulting fragility curves are defined by the following equation and are shown in Fig. 11 through Fig. 14.
P [Complete Damage = (16)
After this, the probability of complete damage is determined at each peak response. Therefore, the probabilities of complete damage are 0.0154 and 0.007 for one- and two-storey wood frame building in High seismicity region, and 0.1254 and 0.0722 for one- and two-storey wood frame building in Very High seismicity region. From the resulting values, the probability of collapse is determined by using the following equation.
P [COL] = Collapse Factor x P [Complete Damage] (17)
The collapse factor for wood frame is 0.05 according to Appendix Table A-11 in FEMA P-155. So, the probabilities of collapse are 0.00077 and 0.00035 for one- and two-storey wood frame building in High seismicity region, and 0.00627 and 0.00361 for one- and two-storey wood frame building in Very High seismicity region. To get the associated basic score, we have to calculate the relate probability of collapse with the following equation.
S = -log10 (P [COL]) (18)
The associated scores are 3.11 and 3.48 for one- and two-storey wood frame building in High seismicity region, and 2.20 and 2.44 for one- and two-storey wood frame building in Very High seismicity region. The basic score is taken as the average of the one-storey and two-storey results. Therefore, the basic score for wood frame building in High seismicity region is (3.22 + 3.48)/2=3.285, approximately 3.3, and the basic score for wood frame building in Very High seismicity )
(
1
)
( 2
, 2 2
, 2 2
,
, CAP TC
e C T CAP D C P C
D D X
C d P
C S
D
, ,
ln 1
Fig. 11. Fragility Curve for One-storey Wood frame Building in High Seismicity Region
Fig. 12. Fragility Curve for Two-storey Wood frame Building in High Seismicity Region
Fig. 13. Fragility Curve for One-storey Wood frame Building in Very High Seismicity Region
85 region is (2.2 + 2.44)/2=2.32, approximately 2.3.
4.2. Performance Modifying Factors
The performance modifying factors are aimed to adjust in individual weakness found in each building. These are related to the forecasting of damages under the insufficient condition both for structural and non-structural point of view of the building. The PMFs are different from the basic score which is more related to the damage probability. In this study, the Javanese houses performance modifying factors [3] are referenced to specify the performance modifying factors because the characteristics of the modern Javanese house are similar to that of the local house in these study areas. Three main aspects are considered in PMFs in Javanese houses. They are structural system and configuration, construction technique and material chooses. Each aspect is assumed to have the same contribution to the building performance. So one third should be considered for the performance deficiency. To simply the aspects, the first and second aspects are changed to main structural irregularities and roof structural irregularities. Material quality in general can be checked by appearance quality. Soil condition is considered as environmental seismic aspect [3]. Soil type under the seismic wave amplification aspect accounts for 20 to 50 percent from medium stiff soil to soft-weak soil [FEMA1988] or 12 or 50 percent [IAEE2004]. However, from the November 11th 2012 Thabeikkyin earthquake, it was very little related to the failure of foundation on the soil. The buildings are mostly one-storey or two-storey, so the effect of soil to the foundation is less than the multi-storey buildings. Moreover, the characteristics of the soil are composed by sediments surrounding by rock on the mountains. So, the significant level should be specified for the soil. Because of this reason, the range of soil are specified from 10 to 30 percentage (from medium to soft types) for the performance of the building under earthquake for all seismicity regions in this study. Structural system of the building is the most related aspect to the stability of building under earthquake. Mezzy. M, et.al (2004) said that the vertical and plan irregularities is considered for 30 percent variation for the horizontal dimension at any story. So, this can be assumed that any vertical irregularity of the building provides 30 percent deficiency in building performance because the area is mutually related to the weight of the building. From FEMA‘s PMFs percentage to the basis score, the vertical irregularities for wood-framed buildings lessen about 25 percent from the basic score while plan irregularities lessen about 35 to 40 percent from the basic score. For local houses under the November 11th 2012 earthquake, 50 to 80 percent of building populations were damaged according to the surveyed data. Local brick-nogging buildings (wood-framed with brick-infilled walls) were damaged about 25 percent of all surveyed building populations and about 90 percent of all surveyed brick-nogging building populations. It was believed that almost all local brick-nogging buildings were damaged nearly to 100 percent. For these reasons, incomplete structural system totally with main supporting system and main roof system will take responsible up to 60 percent. For the aim of use, 35 and 25 percent are divided for main and roof structural system like Javanese houses. Material quality and construction standard used in the building is another essential aspect to the building performance. Low quality material, deteriorated material (e.g., for wood) and poor joint will easily damage to the building
although everything is done in proper system. Although the correlation between deteriorated material and seismic safety has not been studied in detail, but the skilled persons had all observed examples of buildings with weakened structural capacity due to material deterioration [3]. For non-engineered houses, Shaw, R., et.al, (2004) discovered that the damages of the building under earthquake were 31 percent because of material usage and 26 percent was related to its quality. Because of this case, 30 percent maximum will be specified for material or appearance quality. Table 10 shows the performance modifying factors specified for the typical local houses.
As mentioned above, the damage probabilities are categorized from score 0 to 4. The score of 0 to 4 is also taken into account from completely damage to least damage. Damage
probability and predicted damage score are correlated as follow: score 4 (least/ignored damage), score 3 (slight damage), score 2 (moderate damage), score 1 (heavy damage) and score 0 (totally collapse). Cut-off level is the limit state that the building can be classified as ‗accepted‘ or ‗need further detailed investigation‘. For this study, cut-off level 2 by means of 1 percent probability to have more than 60 percent damage is accepted which is based on FEMA suggestion.
5 RVS
S
CORE FORT
YPICALL
OCALH
OUSESTo examine the damage probability of the typical local houses in study areas, the RVS score chart has two parts. The first part is for defining the Basic Score (BS) for the type of the house. The second part is for the weakness found in the building that decreases the performance of the building as Performance Modifying Factors (PMFs). Soil type, appearance qualities, main and roof structural irregularities are the general modifier aspects applied on the building which come in negative percentage. Table 11 shows the summary of the RVS chart for typical local houses.
86 Field application is made in six selected study areas. The aim
is to verify and examine the earthquake vulnerability of the local houses. From the study areas, 727 houses samples data are collected according to the RVS method. From the six study areas sample gathered, the RVS results are shown in Table 12. The selected study areas are located in Very High seismicity region.
Final grades for RVS are mostly high. More than 60% accepted houses are found in the areas. The average percentage of the accepted houses is about 84.7%. For vulnerability examination of the local houses, only brick-nogging (wood frame brick-infilled wall) structural type is selected in this study. From the result, local houses in the study areas are generally in good condition. From the past study [7] and [8], the percentage of no damage to moderate damage in brick-nogging buildings is about 86% (646 buildings of the total 751 buildings). It can be seen that the percentages of accepted buildings in RVS procedure in this study and the past study [8] are not so different and near similar. In order to keep the procedure up to date, more modification and adaption are needed related to the actual seismicity condition in the field.
6
C
ONCLUSIONIn this study, the RVS for typical local houses is developed and proved work with the samples. It is very important especially in developing countries. Applied in the affected study areas from November 11th 2012 Thabeikkyin earthquake, RVS has result that most of the buildings have good performance from vulnerability. Based on this RVS chart, other earthquake-affected areas can be studied and collected data to emphasize that the RVS method in this study can prove to be the powerful and useful tool enough as one of the essential tools in seismic risk evaluation. Considering the safety aspect according to earthquake problem, this finding should change the supervision of housing development in the future.
A
CKNOWLEDGMENTThe authors would like to express the deepest gratitude to Dr. Nilar Aye, Professor and Head of Department, Department of Civil Engineering, Mandalay Technological University, for her valuable guidance and approval to submit as a requirement for their research. Special thanks go to Prof. Junji Kiyono from Kyoto University, Prof. Maki Koyama from Gifu University and teachers from Urban Planning Department, Japan, for their valuable guidance and valuable suggestions. The authors also take to mention thank to all of teachers and staff of Department of Civil Engineering, Mandalay Technological University. Finally, the authors thank to all who helped them with necessary assistance for this paper.
R
EFERENCES[1] R. Sinha and A. Goyal, ―A National Policy for Seismic Vulnerability Assessment of Buildings and Procedure for Rapid Visual Screening of Buildings for Potential Seismic
Vulnerability,‖ available at
http://www.civil.iitb.ac.in/~rsinha/Vulnerability_Assessment.pdf.
[2] H. Sucuoglu and U. Yazgan, ―Simple Survey Procedures for Seismic Risk Assessment in Urban Building Stocks,‖ Seismic Assessment and Rehabilitation of Existing Buildings, S.T Wasti and G. Ozcebe, eds., Journal of Earth and Environmental Sciences – Vol 29: Kiuwer Academic Publishers, pp. 97-118, 2003.
[3] N.C. Idham, ―Seismic Vulnerability Assessment in Vernacular Houses: The Rapid Visual Screening Procedure for Non Engineered Building with Application to Java Indonesia,‖ PhD dissertation, Dept. of Architecture, Eastern Mediterranean University, North Cyprus, 2011.
[4] FEMA, ―FEMA P-155: Rapid Visual Screening of Buildings for Potential Seismic Hazards: Supporting Documentation,‖ California: Applied Technology Council, Third Edition, 2015.
[5] FEMA, ―FEMA 440: Improvement of Nonlinear Static Seismic Analysis Procedures,‖ Federal Emergency Management Agency, Washington D.C, 2005.
[6] D.C. Rai, ―Review of Documents on Seismic Evaluation of Existing Buildings,‖ Document No. : IITK-GSDMA-EQ03-V1.0.
[7] N. P. S. Awar, J. Kiyono, K. M. Aung and M. Koyama,
TABLE11:THE SUMMARY OF THE RVSCHART FOR TYPICAL
LOCAL HOUSES
87 ―Damage Pattern of Typical Local Houses in the 2012
Thabeikkyin Earthquake, Myanmar,‖ Proc. of the Fifth International Conference on Science and Engineering (ICSE 2014), December 29-30, Yangon, Myanmar, 2014.
[8] N. P. S. Awar and K. M. Aung, ‖Development of Damage Rate and Damage Index Functions for Brick-nogging and Wooden Buildings in 2012 Thabeikkyin Earthquake,‖ Proceedings of the International Conference on Civil, Architectural and Environmental Engineering (CAEE-16), June 23-24, Bangkok, Thailand, 2016.