https://doi.org/10.5194/esd-8-1047-2017 © Author(s) 2017. This work is distributed under the Creative Commons Attribution 3.0 License.
More homogeneous wind conditions under strong
climate change decrease the potential for inter-state
balancing of electricity in Europe
Jan Wohland1,2, Mark Reyers3, Juliane Weber1,2, and Dirk Witthaut1,2
1Forschungszentrum Jülich, Institute for Energy and Climate Research (IEK-STE), 52428 Jülich, Germany
2Institute for Theoretical Physics, University of Cologne, 50937 Cologne, Germany
3Institute for Geophysics and Meteorology, University of Cologne, Cologne, Germany
Correspondence to:Jan Wohland ([email protected])
Received: 19 May 2017 – Discussion started: 24 May 2017
Revised: 19 September 2017 – Accepted: 19 October 2017 – Published: 29 November 2017
Abstract. Limiting anthropogenic climate change requires the fast decarbonization of the electricity system. Renewable electricity generation is determined by the weather and is hence subject to climate change. We sim-ulate the operation of a coarse-scale fully renewable European electricity system based on downscaled high-resolution climate data from EURO-CORDEX. Following a high-emission pathway (RCP8.5), we find a robust but modest increase (up to 7 %) of backup energy in Europe through the end of the 21st century. The absolute increase in the backup energy is almost independent of potential grid expansion, leading to the paradoxical ef-fect that relative impacts of climate change increase in a highly interconnected European system. The increase is rooted in more homogeneous wind conditions over Europe resulting in intensified simultaneous generation shortfalls. Individual country contributions to European generation shortfall increase by up to 9 TWh yr−1, re-flecting an increase of up to 4 %. Our results are strengthened by comparison with a large CMIP5 ensemble using an approach based on circulation weather types.
1 Introduction
Massive reductions of greenhouse gas emissions are needed in order to reach the temperature goals defined in the Paris Agreement (UNFCCC, 2015; Schleussner et al., 2016b). With a share of around 35 % of current emissions being caused by the electricity system (Bruckner et al., 2014), its decarbonization is the key to any mitigation strategy. How-ever, today’s pledges are not yet sufficient to limit warming to below 2◦C, not to mention 1.5◦C (Rogelj et al., 2016).
In addition to the need of mitigating carbon emissions, a second interaction between the energy system and the climate system exists and becomes increasingly important with higher penetrations of renewable energies. Volatile re-newable energy generation is driven by weather conditions which are subject to climate change. Large backup facil-ities are needed to guarantee a stable supply of electric-ity during periods of low wind and solar power
genera-tion (Rodriguez et al., 2014). Furthermore, climate change affects the demand for electric power (Auffhammer et al., 2017) as well as the operation conditions for thermoelectric and hydroelectric power plants which serve as backup (van Vliet et al., 2016, 2012). However, feedback effects of large-scale wind fleets on atmospheric flows are limited (Vautard et al., 2014).
2017), among other things, might impede fast decarboniza-tion. Different climatic futures are hence plausible and miti-gation strategies need to work in all of them. Therefore, we are led to the question of how sensitive a fully renewable electric power system is to climate change, and, in particu-lar, how severely could strong climate change impact such a system.
Anthropogenic climate change affects the large-scale at-mospheric flow and thus the operation conditions for renew-able power generation. State-of-the-art global climate mod-els reveal that changes in zonal wind depend on the tem-perature structure of the lower atmosphere (Haarsma et al., 2013) and that zonal-mean zonal wind and eddy kinetic en-ergy decline almost linearly in time due to polar amplifica-tion (Coumou et al., 2015). There are also natural sources of variability at up to decadal timescales. Some of them originate from ocean–atmosphere interactions in the Atlantic and are potentially predictable (Haekkinen et al., 2011; Pe-ings and Magnusdottir, 2014). The North Atlantic Oscillation has been shown to directly influence the operation of inter-connected renewable electricity systems (Ely et al., 2013). Predictability of such natural variations is of great interest for system integration and efforts are undertaken to assess and improve forecasting skills (Moemken et al., 2016).
To assess the impact of climate change on the operation of renewable power systems, downscaled climate model output is needed. It comes at a high temporal and spatial resolution and is better suited than global model output to capture lo-cal features such as land–sea transitions or mountains (Rum-mukainen, 2016). Temporal resolutions at the sub-daily scale are needed since electricity consumption varies strongly dur-ing the day. Changes in wind energy yields and capacity fac-tors have been assessed based on dynamical (Tobin et al., 2015, 2016) and statistical–dynamical downscaling outputs (Reyers et al., 2015, 2016). Tobin et al. (2016) evaluate the EURO-CORDEX data archive and find that changes in the annual wind energy yield across Europe are of the order of 5 % and models do not agree on the sign of change. Follow-ing a different approach that allows for the inclusion of the output of 22 global climate models, Reyers et al. (2016) re-port an increasing intra-annual gradient between winter and summer wind generation and different trends in northern and central Europe as compared to southern Europe.
Assessing changes in solar power generation is arguably more difficult due to, among other things, unresolved pro-cesses in relatively coarse climate models and uncertain pa-rameterizations (e.g., Chiacchio et al., 2015; Herwehe et al., 2014). Acknowledging this difficulty and associated uncer-tainties, an evaluation of the EURO-CORDEX data finds lim-ited impacts of climate change on solar photovoltaic (PV) potentials (Jerez et al., 2015). Southern Europe, having the highest potential for PV, sees only small changes, as an in-crease in downwelling irradiation is counteracted by a de-creasing efficiency due to warming. In contrast, the output of concentrated solar power systems (CSPs) is expected to
increase by around 10 % because the efficiency of CSP in-creases with temperature (Crook et al., 2011).
While wind and solar power sources have shown remark-able development in the last decades, system integration mains a huge challenge (Huber et al., 2014). In a highly re-newable power system the timing of generation events be-comes crucial. Even in an European electricity system that is on average fed by 100 % renewables, roughly one-quarter of the energy is produced at the wrong time and has to be curtailed (Rodriguez et al., 2014, 2015a).
It is thus necessary to consider indicators such as the vari-ability and synchronicity of generation in addition to total energy yields (Monforti et al., 2016; Bruckner et al., 2014; Bloomfield et al., 2016). Several validated time series of re-newable generation based on reanalysis data are available to assess the power system operation (Pfenninger and Staffell, 2016; Staffell and Pfenninger, 2016; Gonzalez Aparcio et al., 2016). However, these data sets are restricted to current cli-matic conditions and might thus be misleading for long-term planning of the electricity system.
In this article we study the impact of climate change on the operation conditions for future fully renewable power tems. We combine the analysis and simulation of power sys-tems with high-resolution regional climate modeling results to quantify changes in wind power generation. We adopt a coarse-scale view on the power system to uncover the large-scale impacts of climate change. The coarse-large-scale perspec-tive neglects details that are irrelevant for the balancing of de-mand with wind generation such as supply of reactive power or different voltage levels in the grid. The focus of this study is to address the potential of transnational power transmis-sion to cover local balancing needs.
Our results reveal the sensitivity of fully renewable power systems to climate change. They should not be mistaken with a forecast and rather be considered a thought experiment to assess potential risks and to answer the following question: what happens to a fully renewable electricity system if miti-gation actions are ineffective or come too late?
2 Methods
Modeling the operation of a fully renewable power system under climate change
In-tercomparison Project Phase 5 (CMIP5) and publicly avail-able (Taylor et al., 2011). We use near-surface wind speeds at 0.11◦spatial and 3 h temporal resolution and hence capture
intra-day effects. In the spirit of a sensitivity analysis, we evaluate the representative concentration pathway RCP8.5. It describes atmospheric greenhouse gas concentrations fol-lowing a business-as-usual strategy and leads to approxi-mately 4.3◦C warming at the end of the century as com-pared to pre-industrial values (Stocker et al., 2013). In view of inter-model spread and other uncertainties, a strong cli-mate change scenario bears the advantage of high signal-to-noise ratios.
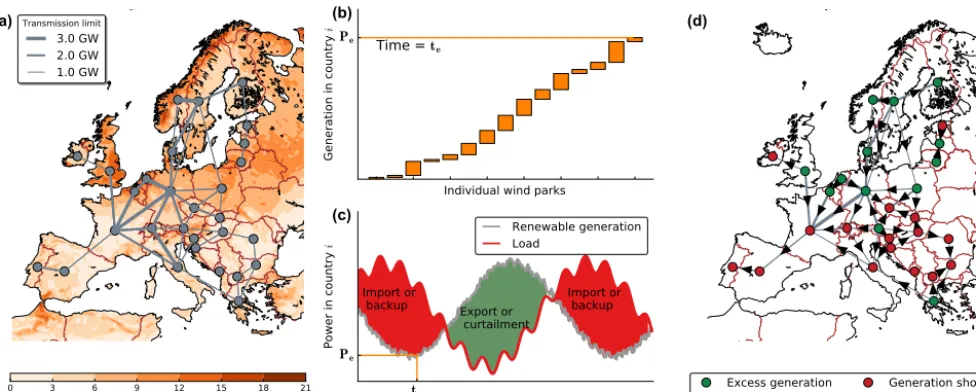
The approach used in this study is illustrated in Fig. 1. The climate data is used to calculate the aggregated wind power generation time series for each country in the interconnected European power grid (grey circles in Fig. 1a). Near-surface wind speeds are scaled up to hub height (80 m) based on a power law and a standard power curve is used to obtain the power generation of the wind turbines, both as in Tobin et al. (2016; see also Supplement S1). The power curve assumes a cut-in velocity of 3.5 m s−1, a rated velocity of 12 m s−1 and a cut-out velocity of 25 m s−1. Wake losses are not ac-counted for. The country-wise aggregated wind power is ob-tained by summing the generation of 100 MW wind parks until the system is fully renewable on average. The wind park size was chosen as a compromise between increasing turbine capacities (Wiser et al., 2016) and the need for a sufficient amount of distinct parks. Wind parks are deployed semi-randomly following the approach of Monforti et al. (2016). In order to single out climate-change-induced alterations, we fix the technological parameters such as hub heights or turbine efficiencies, and we do not account for changes in the con-sumption such as load shifting or sector coupling throughout the 21st century. Tests including validated historical PV time series (Pfenninger and Staffell, 2016) reveal that the inclu-sion of PV does not change the overall results (see Supple-ment S2). For the sake of simplicity, we thus decide to restrict the analysis to wind-driven power systems in this paper.
Wind power generation strongly fluctuates over various timescales as shown in Fig. 1c. In periods of scarcity, energy has to be imported from other countries or generated from lo-cal dispatchable power plants. We refer to the latter as backup energy. In the situation depicted in Fig. 1a, scarcity in south-ern Europe can mainly be compensated for by imports from northern Europe. Transnational balancing of this kind often requires large transmission capacities. Moreover, the import of electric energy requires a respective exporter which has a surplus at the same time. Backup energy in future renewable power systems is thus essentially determined by the temporal and spatial heterogeneity of wind and solar power throughout the system.
In addition to enhanced spatial balancing via imports and exports, an extension of storage facilities will reduce backup energy (Rasmussen et al., 2012). However, storage assets are more costly than grid expansion (Schlachtberger et al., 2017;
Brown et al., 2016). Since a cost-optimal solution will thus favor grid expansion, we focus on spatial effects and transna-tional balancing. An assessment of climate change effects on storage following a similar approach is presented by Weber et al. (2017).
To quantify backup energy, we adopt a coarse-scale view of the transmission system (see, e.g., Rodriguez et al., 2015a, 2014). We consider each countryito be a node in the Euro-pean transmission network and define a nodal mismatch for each point in timet=1, 2, . . . as
Mi(t)=Pi(t)−Di(t), (1)
wherePi(t) is intermittent renewable generation andDi(t) is the load (here hourly data for 2015 averaged over 3 h time steps from ENTSO-E; European Network of Transmission System Operators for Electricity, 2015). The assumption of a fully renewable system means that all countries generate as much electricity as needed on average (Rte
ts Mi(t)dt=0). The assumption of a fully renewable system means that all coun-tries generate as much electricity as needed on average (inte-gral), wheretsandteare defined in Table 1. Furthermore, we assume all countries to run a loss-free and unlimited trans-mission network within their borders.
If a country has a negative mismatch (Mi<0, red circles in Fig. 1d), it tries to import energy. If it has a positive mis-match (Mi >0, green circles in Fig. 1d), it tries to export energy. For each countryithe power balance must be satis-fied:
Mi(t)+Bi(t)+Fi(t)=Ci(t). (2)
The mismatchMi can be compensated for either by power generation from conventional backup power plants (Bi≥0), the curtailment of renewable power generation (Ci≥0) or by imports (Fi >0) or exports (Fi<0). To utilize renewable generation in an optimal way, countries will first try to bal-ance power using imports and exports. However, a perfect balancing of all nodes is impossible if there is a continent-wise shortage or overproduction. Furthermore, cross-border flows along lines are bound by the directional net transfer ca-pacities (NTCs; see Supplement S1 for details), which may also impede balancing for some nodes. Power balance must then be satisfied by local means: in the case of a short-age, power must be backed up by conventional generators (Bi>0). Similarly, if excess power can not be exported, it has to be curtailed (Ci>0). We recognize that the technical details of backup generation often matter for implementation (Schlachtberger et al., 2016), but we focus on gross electric-ity needs in this study.
(a) Transmission limit
3.0 GW 2.0 GW 1.0 GW
0 3 6 9 12 15 18 21
Wind speed at hub height [m s-1]
(d)
Excess generation Generation shortfall
te
Time
Pe
Po
we
r i
n
co
un
try
i
Import or
backup Export or
curtailment
Import or backup
(c)
Renewable generation Load
Individual wind parks
Pe
Ge
ne
ra
tio
n
in
co
un
try
i
Time = t
e (b)Figure 1.Approach of the study.(a)Wind fields from high-resolution climate models and the 2010/2011 net transfer capacities are used as input to the model.(b) The wind speeds are first translated into generation of individual wind parks using local wind fields and then aggregated to a national level for each country.(c)In combination with country-specific load data, the nodal mismatch for every country and time step is computed. If generation exceeds the load (green area), countries can export energy until lines reach their transmission capacity. Remaining energy has to be curtailed (dumped). If generation is lower than load, electricity will be imported. If importing is not an option due to transmission limits or lack of available excess energy in other countries, backup energy has to be provided by dispatchable power plants.(d)A minimization of the total backup energy of all countries then yields a flow pattern in Europe.
a multi-year timescale while still ensuring that elapsed time between periods is long enough to consider them distinctly (see Table 1). Since GCMs do not reproduce natural varia-tions synchronously (Farneti, 2017), robust signals found in the ensemble are very unlikely to be rooted in natural vari-ations with a recurrence time of a couple of decades (such as the Atlantic Meridional Oscillation or the North Atlantic Oscillation; see Peings and Magnusdottir, 2014, for a discus-sion of their role in mediating atmospheric conditions). The backup energyEBper period is defined as the sum over all backup powers in a given period:
EB(period)= X
t∈period
minX
i
Bi(t), (3)
such that Eq. (2) is satisfied for all countriesi and the line limits are respected.
The European amount of backup energy is identical to the amount of curtailment over a full period. This is a direct con-sequence of the assumptions made and can be formally de-rived by summing Eq. (2) over all countries and integrating over an entire period. SinceRtsteMi(t)dt=0 (each country is fully renewable on average) and P
iFi =0 (all imports to one country Fj=c are exports from another Fk= −c), it follows that
te Z
ts X
i
Bi(t)dt=
te Z
ts X
i
Ci(t)dt. (4)
A change of the backup energy thus directly implies a change in total curtailment.
We use climate model ensembles to account for model un-certainties. Interpreting the ensemble output by means of the ensemble mean can be misleading as a single model might dominate the ensemble. In such cases, the model mean would be in disarray with the majority of models and hence would not be representative of the ensemble. We thus assess the robustness of changes by means of inter-model agreement. We label a signal “robust” if all models agree on the sign of change and use “high agreement” if all but one model agree. In the evaluation of the large CMIP5 ensemble we adopt lan-guage defined for the latest IPCC report and label a change “likely” if at least 66 % of models agree (Mastrandrea et al., 2010).
Figure 2.The impact of climate change on backup energy under different grid expansion scenarios. Different realizations of the European inter-state grid expansion are given by the grid expansion coefficientα. Whileα=0 denotes the isolated case without an inter-country transmission network,α=1 reproduces the configuration as of today andα= ∞represents unlimited European transmission. Different markers refer to distinct 20-year time periods (see Table 1), and colors denote different climate models.(a)Backup energy as a function of grid expansion expressed in units of the total European loadDtot=R PiDi(t)dt.(b)Absolute change of backup energy by the end of the
century.(c)Relative change of backup energy by the end of the century.
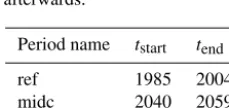
Table 1.Periods used in this study. The reference period ref ends before 2005 because GCMs in CMIP5 are driven by historic emis-sions only until this date and follow different representative concen-tration scenarios afterwards.
Period name tstart tend
ref 1985 2004
midc 2040 2059
endc 2080 2099
3 Results and discussion
3.1 Energy: increasing backup energy
A cost-efficient way of power balancing is given by transna-tional imports and exports. Remarkably, we find that strong climate change impedes the potential of this balancing mea-sure in most of Europe (see Fig. 2). We report that backup en-ergy in Europe increases under strong climate change by the end of the century. This finding is robust across all EURO-CORDEX ensemble members. Since we consider a scenario
where 100 % of electricity is generated from renewables on average, an increase in backup energy is accompanied by an increase in excess energy which has to be curtailed.
magnitude of change which varies by up to 1 order of magni-tude depending on the climate model (see Fig. 2b, α= ∞). In particular, changes for CNRM are generally weak and HadGEM2 features only a slight overall increase with grid expansion. However, remarkably, all models agree on the sign of change at the end of the century such that we con-sider the direction of change very likely.
In conclusion, we find that the effectiveness of transna-tional balancing decreases due to climate change. This de-crease is due to more homogeneous wind generation as we will show in the climate section of this paper. Moreover, a control simulation including PV generation from Pfenninger and Staffell (2016) yields similar results although the magni-tude of change is reduced by roughly a factor of 2 and only four out of five models agree on the sign of change (see Sup-plement S2). Results are barely sensitive to changes in the load time series as an assessment using constant loads re-veals (see Supplement S3).
Spatial distribution of mismatch contributions
To obtain a more detailed view, we evaluate transnational balancing potentials separately for each country. We calcu-late the likeliness that a given country has a local scarcity (Mi<0) while Europe as a whole suffers from a lack of generation (P
iMi<0). This corresponds to events where a country would favor importing electricity but can not due to a continent-wide scarcity. These events require conven-tional backup even in the case of unlimited transmission in-frastructure and thus give a lower bound for backup energy. The approach allows us to identify those countries which are most responsible for overall scarcity. Mathematically speak-ing, we restrict our analysis to time stepsTi with local and Europe-wide scarcity:
Ti=
(
t: X
j
Mj(t)<0 andMi(t)<0 !)
. (5)
The negative mismatch contribution occurrence νi corre-sponds to the joint probability of country iand Europe ex-periencing generation shortfall at the same time:
νi=
P t∈Ti
NT
, (6)
whereNT is the number of time steps. We define the annual energy that is lacking (i.e., generation shortfall) in countryi during European scarcity as
Li=
P
t∈Ti|Mi(t)|
20y , (7)
where we chose the absolute value of Mi for convenience of interpretation. Li is given in TWh yr−1. A high value
of Li characterizes a country which would favor import-ing a large quantity of energy durimport-ing European scarcity, whereas a low value ofLi indicates a country whose gen-eration shortfall can often be balanced by imports. In or-der to compare values ofLi with loads, we provide country values forDi in the Supplement S5. The European sum is P
iDi≈3100 TWh yr−1.
Values forνandLduring the reference period are shown in Fig. 3a, b. Large consumers like Germany and France are also the dominant contributors to European scarcity in terms of missing energy (see Fig. 3a). The German contribu-tion corresponds to approximately 8 % of the European an-nual load of 3100 TWh. However, the role of these countries, for example, in comparison to eastern Europe or Benelux, is less pronounced if only the occurrence of negative mismatch events ν is considered (see Fig. 3b). The reason for their strong impact onL is thus primarily rooted in the high ab-solute values of their mismatches rather than their frequency. Moreover, a large consumer also has a bigger influence on the Europe-wide mismatches which implies that the condi-tions in Eq. (5) are not independent. For example, the Euro-pean mismatch can be negative because of an elevated Ger-man mismatch and in such a situation a high contribution toLwould be observed. Interestingly, there is considerable spread regardingν in different countries (Fig. 3b). Greece and Norway contribute the least often to European scarcity (less than 40 %) while central Europe contributes around 50– 60 % of the time.
Next, we focus on changes until the end of the 21st cen-tury:
1νi=νi|endc−νi|refand1Li=Li|endc−Li|ref. (8)
In France, Benelux, Scandinavia, the UK, Ireland and most countries in central Europe the negative mismatch contribu-tion occurrence ν and the respective negative energy con-tribution L increase (see Fig. 3c, d). In these countries it becomes more likely that a Europe-wide scarcity coincides with a local scarcity and the amount of required backup en-ergy increases. In turn, these countries can not alleviate the overall shortage by exporting excess generation. This points to a stronger homogeneity of wind power generation in cen-tral Europe which is discussed in more detail below. An in-crease in the occurrenceν can also be observed for eastern and southeastern Europe, excluding Greece, with high inter-model agreement (see Fig. 3d). However, these increases are weak in terms of energy contributions (see Fig. 3c).
0.0 38.1 76.1 114.2 152.2 190.3 228.3 266.4
Re
fe
re
nc
e m
ag
nit
ud
e
Lref
35.0 39.7 44.4 49.0 53.7 58.4 63.1 67.7
νref
[%
]
9.2 6.1 3.1 0.0 3.1 6.1 9.2
Ch
an
ge
in
m
ag
nit
ud
e
∆
L
3 2 1 0 1 2 3
∆
ν
[%
]
Figure 3.Country contributions in times of overall and local generation shortfall and their change until end of century. Values denote the inter-model mean. Shading indicates inter-model agreement as follows: no hatches indicate perfect agreement on sign of change; striped: four out of five models agree; hatching: less than four agree.(a)Lacking energyLrefduring local and overall scarcity in the reference period (see Eq. 7).(b)Simultaneous occurrence of local and overall generation shortfallνref(see Eq. 6).(c, d)Changes of the quantities given in (a, b)until end of century (see Eq. 8). Red colors denote unfavorable changes (stronger or more frequent contribution of a country to overall scarcity) while blue colors denote favorable changes.
interesting as Grams et al. (2017) show that a combination of wind parks allocated in the North Sea and the Balkans al-lows for substantial reduction in volatility under current cli-matic conditions. Based on our results, this positive effect from incorporating the Balkans would further be enhanced under strong climate change.
We stress that our findings do not refute the efficiency of transmission grid expansions in general. In any case backup energy decreases monotonously with the grid expansion, but the magnitude of the decrease is subject to climatic condi-tions. Furthermore, we assume a homogeneous expansion of the grid, although an optimal system design will probably lead to heterogeneous grid expansions and heterogeneous al-locations of generation capacities. Our results suggest that such an optimal system will include stronger interconnec-tions to Spain and Greece to reduce backup energy. Also, on a country level, certain extensions can be incentivized while others are downgraded. For instance, for France it can become more favorable to extend the connections to Spain rather than to Germany (see Fig. 3c). Despite this, and in
light of regulatory and powerful social acceptance issues, re-garding grid extensions (Battaglini et al., 2012), we consider a future grid which resembles the current one in its funda-mental characteristics a reasonable first guess.
3.2 Climate: increasing correlations of wind resources As reported above, we find an increase in backup energy due to strong climate change in a wind-powered electricity sys-tem. This increase is solely rooted in changes of wind re-sources since all other parameters are kept constant.
1Rendc(A,B)=Rendc(A,B)−Rref(A,B), (9)
whereRperiod(A,B) denotes the average of all point-to-point correlations between country A and country B in a given period. The computation is repeated for all possible combi-nations (A,B). We calculate 1Rendc(A,B) for each climate model separately and show the model mean if not stated oth-erwise.
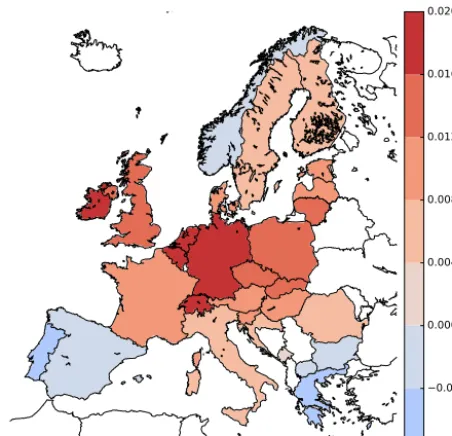
To reveal general patterns, we first consider the average correlation change of a fixed country A by averaging Eq. (9) over all countries B excluding A (see Fig. 4). There is a gen-eral tendency towards higher correlations of wind speeds for central Europe in the ensemble mean. This change is most pronounced in Germany, Switzerland, Benelux and Ireland. Decreasing correlations only occur at the fringes of the con-tinent and they are strongest in Portugal and Greece. Positive correlation changes occur in most countries and the maxi-mum positive change is approximately 3 times larger in mag-nitude than the maximum negative change. Interestingly, the overall pattern is similar to the mismatch contribution anal-ysis (see Fig. 3). This similarity is not a trivial finding since the mismatch contribution analysis accounts for the nonlin-ear turbine power curve and the collective behavior of the entire electricity grid while the correlation analysis is solely based on wind speeds. Summarizing, we find more homoge-neous wind conditions over most of the continent while the fringes decouple slightly. Results for mid-century are weaker but clearly similar (see Supplement Fig. S5).
Assessing pairwise correlation changes between countries, we find that the correlation increase over central Europe has at least a high agreement in the EURO-CORDEX ensemble (see Fig. 5). Some country combinations (e.g., DE–CZ, FR– CZ, BE–UK, FR–NL) even show robust trends. For exam-ple, in Germany the correlations to all neighboring countries plus the UK, Ireland and eastern Europe increase with high agreement. The importance of this finding is strengthened by the fact that central Europe plays an important role for the power system: Germany, France, the United Kingdom, Poland and Benelux account for more than half of the Eu-ropean load. Correlations between Germany and Greece de-crease with high model agreement. In contrast, changes be-tween Germany and the Iberian Peninsula, Italy and Norway are uncertain.
The decoupling of Portugal and Greece which is found in the aggregated plot (Fig. 4) is only robust in a few country combinations and models disagree regarding some important pairs (e.g., PT–DE, PT–FR, PT–UK; GR–IT, GR–UK; and ES–FR, ES–DE). The uncertainty with respect to the corre-lation changes between these countries is thus high.
However, a robust trend is found in Scandinavia, where Norway, Finland and Sweden become more highly corre-lated. This change also partly holds for the Baltic region. At the same time Scandinavia decouples robustly from some
0.008 0.004 0.000 0.004 0.008 0.012 0.016 0.020
∆
R
endc
Figure 4.Correlation changes of wind time series averaged over all models (difference between end of century and reference corre-lations). A more detailed assessment, which in particular addresses inter-model spread, is shown in Fig. 5.
parts of southern Europe (e.g., SE–GR, NO–ES). In the con-text of large-scale European grid expansions, these alter-ations might enhance the value of high-voltage direct current (HVDC) lines between these distinct regions.
Correlation increases in Scandinavia are also robust in the middle of the century (see Supplement Fig. S6). However, inter-model agreement for correlation increases in central Europe is lower although the overall pattern is still conceiv-able. The decoupling of Portugal and Greece can be seen in the inter-model mean, while agreement across models is rare.
3.3 Climate: complementing EURO-CORDEX with CMIP5 using circulation weather types
The EURO-CORDEX data set includes only a five-member subset of all CMIP5 GCMs and might thus not be representa-tive of the entire CMIP5 ensemble. Moreover, subgroups of GCMs can be biased in the same way since they did not de-velop separately, but along the same lines. The most drastic example is the sharing of code by CNRM and EC-EARTH, which are both part of the EURO-CORDEX ensemble and run the same atmosphere module (Knutti et al., 2013).
BE FR BG DK HR
DE HU FI NL PT
NO LV LT RO PL
GR CH EE IT CZ
AT IE ES ME MK
SK SI UK SE
0.041 0.027 0.014 0.000 0.014 0.027 0.041
∆
R
en
dc
Figure 5.Country-specific change of wind speed correlations at the end of the 21st century including inter-model agreement. Colors denote the model-average correlation change of a country to the reference country (highlighted in black and given in the respective heading). Shading indicates inter-model agreement as follows: no hatches indicate perfect agreement on sign of change; striped: four out of five models agree; hatching: less than four agree.
intervals averaged over, model uncertainty is likely to be the dominant source of uncertainty here.
In order to rule out the possibility that our findings are biased due to the (arbitrary) choice of GCMs that were scaled down for EURO-CORDEX, we follow a statistical– dynamical approach which was developed by Reyers et al. (2015, 2016) to downscale a large CMIP5 ensemble for wind energy applications. This approach is based on a circulation weather type (CWT) classification methodology (Jones et al., 1993). Daily mean sea level pressure (MSLP) values at 16 GCM grid points around a central point located in Germany are used to assign the near-surface atmospheric flow over Eu-rope to either a directional flow (north, northeast, east, etc.) or a rotational flow (anticyclonic, cyclonic). Aside from the direction of the atmospheric flow af parameter is calculated, which is representative of the instantaneous pressure gradient
and thus for the general wind speed conditions over Germany and the surrounding countries:
f =
q dP2
z +dPm2, (10)
< 5 5 .. 10
10 .. 15 15 .. 20 >20
0 20 40 60 80 100
Backup energy/load [%]
Europe
< 5 5 .. 10
10 .. 15 15 .. 20 >20
0 20 40 60 80
100 Germany and its neighbors
< 5 5 .. 10 10 .. 15 15 .. 20 >20
Horizontal pressure gradient proxy
f[
hPa 1000km]
0.04 0.03 0.02 0.01 0.00 0.01 0.02 0.03 0.04
Ch
an
ge
of
oc
cu
rre
nc
e
[N
]
to
t
ACCESS1-3 CCSM4 CNRM-CM5 CSIRO Can
EC-EARTH FGOALS-g2 GFDL-CM3 GFDL-ESM2G GFDL-ESM2M
HadGEM2-CC HadGEM2-ES INM IPSL-CM5ALR IPSL-CM5AMR
MIROC-ESM MIROC-ESMCH MIROC5 MPI-ESM-LR
MPI-ESM-MR MRI-CGCM3 NorESM1-M Model-mean
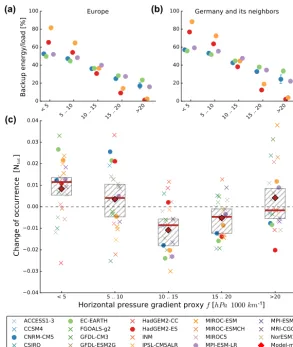
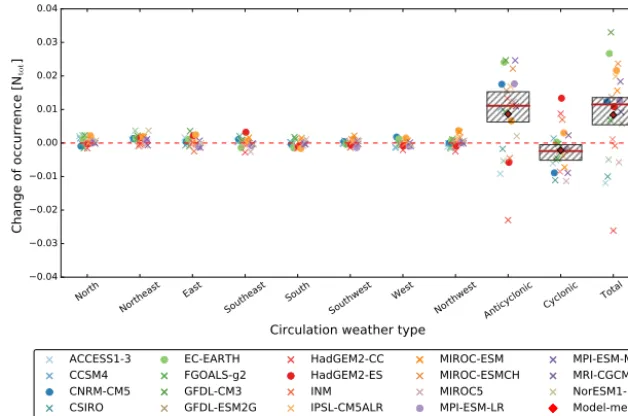
Figure 6.Backup energy and change of occurrence as a function of thef parameter.(a)Backup energy versusf parameter for the entire domain. Circles denote the mean over the three considered periods for each model and error bars indicate the standard deviation thereof. Error bars are, however, most often smaller than the circle size.(b)Same as(a)but restricted to Germany and its neighbors.(c)Change of occurrence of differentf parameter values. The change of occurrence is computed as the difference between end of century and the reference period and is given in units of the total number of time stepsNtot. Red diamonds denote the ensemble mean, red lines the ensemble median and hatched boxes indicate the 33rd to 67th percentile. If a box lies completely above/below zero, the sign of the change can be considered as likely.
Analyzing the five individual GCMs contributing to the EURO-CORDEX ensemble reveals a link between the CWTs and the backup energy derived from dynamically downscaled data (see Eqs. 1, 2, 3). We find that backup en-ergy decreases monotonously with increasing f parameter values (see Fig. 6a, b). All models in the EURO-CORDEX ensemble agree on this result which is also physically plau-sible as the pressure gradient drives the atmospheric circula-tion. This statement holds for Germany and its neighbors and for Europe as a whole. We see this as evidence that the CWT analyses in this particular case can be applied to the entire continent in the sense that thef parameter is a reasonable proxy for the European backup energy.
The majority of CMIP5 models (16 out of 22) predict an increase in events with low f parameter values by the end of the century (see Fig. 6c). Following the likelihood
classification developed for the latest IPCC report (Mas-trandrea et al., 2010), it is thus likely that low f param-eter values become more abundant. This trend originates mainly from more frequent anticyclonic pressure configu-rations (see Fig. 7). For this CWT, spatial homogeneity of wind resources is higher as compared to all other CWTs (see Supplement Fig. S7). In such a homogeneous situation, it is plausible that backup energy is elevated since countries are more likely to experience shortfall of generation simultane-ously. In contrast, medium (10≤f[hPa/1000 km] ≤15) and high (15≤f[hPa/1000 km] ≤20)fparameters are likely to occur less frequently since 17 models agree on these signals. We thus conclude that the majority of CMIP5 models agree with the main finding of increasing backup energy.
re-North
Northeast East Southeast South Southwest West Northwest Anticyclonic Cyclonic Total
Circulation weather type 0.04
0.03 0.02 0.01 0.00 0.01 0.02 0.03 0.04
Ch
an
ge
of
oc
cu
rre
nc
e [
N
]
to
t
ACCESS1-3 CCSM4 CNRM-CM5 CSIRO Can
EC-EARTH FGOALS-g2 GFDL-CM3 GFDL-ESM2G GFDL-ESM2M
HadGEM2-CC HadGEM2-ES INM IPSL-CM5ALR IPSL-CM5AMR
MIROC-ESM MIROC-ESMCH MIROC5 MPI-ESM-LR
MPI-ESM-MR MRI-CGCM3 NorESM1-M Model-mean
Figure 7.Changes of relative occurrence of primary CWTs with lowf parameter values (f ≤5 hPa/1000 km). Changes are differences in occurrence between end of century and the reference period and are given in units of the total number of time stepsNtot. Boxes indicate the 33rd to 67th percentile and are only shown if changes are substantial. Red diamonds denote the ensemble mean and red lines denote the ensemble median.
port that the GCMs contributing to EURO-CORDEX are within the spread of the remaining CMIP5 ensemble (except for HadGEM with very strong f parameters) and are thus generally representative of the larger ensemble (see Fig. 6). However, they also show comparably strong changes in the occurrence of specificf parameters. The CMIP5 overall pro-jection regarding backup energy might thus be lower than re-sults reported in this paper. In order to test this speculative hypothesis, a consistent downscaling of all CMIP5 models would be necessary, which is far beyond the scope of this article but should be tackled in future works.
4 Conclusions
A future highly renewable electricity system will be gov-erned by weather conditions. If mankind fails to reduce car-bon emissions fast, climate change will impede the operation of a wind-driven system in Europe. This conclusion is based on three separate lines of evidence.
1. A coarse-scale electricity model fed with EURO-CORDEX climate data shows robust increases in backup energy.
2. Spatial correlations in wind time series in EURO-CORDEX data across central Europe are found to in-crease. Countries are thus more likely to experience generation shortfall simultaneously.
3. Building upon a statistical–dynamical downscaling technique and a 22-member CMIP5 ensemble we find a likely increase in circulation weather types with low
f parameters values. They are associated with low Europe-wide wind generation.
It has to be stressed that results are for the end of the 21st cen-tury and based on a strong climate change scenario (RCP8.5). They should be thought of as a sensitivity test. While the in-creases of backup energy are robust, they are also restricted to relative increases of 7 % (see Fig. 2). A fully renewable electricity system will hence not become unfeasible due to catastrophic changes.
In the emerging field of linking energy and climate re-search, many additional questions are to be addressed in or-der to deliver a more holistic assessment. We simulated a wind-driven electricity system and performed a control sim-ulation with a fixed share of PV. Time series for the latter were taken from a validated data set based on reanalysis data (Pfenninger and Staffell, 2016). Ideally, future works would assess the combined effects of climate change on wind and solar generation. They could also include concentrated solar power since this technology bears advantages for system in-tegration (Pfenninger et al., 2014). Load shifting, sector cou-pling and storage are further topics for more detailed assess-ments.
Data availability. The climate data (EUROCORDEX and CMIP5) are accessible via the ESGF: https://esgf-data.dkrz. de/search/cordex-dkrz/. Hourly load data are provided by the European Network of Transmission System Operators for Electricity at https://www.entsoe.eu/db-query/consumption/ mhlv-all-countries-for-a-specific-month. The current net transfer capacities for Europe are made available by the same body at https://www.entsoe.eu/fileadmin/user_upload/_library/ntc/archive/ NTC-Values-Winter-2010-2011.pdf.
The Supplement related to this article is available online at https://doi.org/10.5194/esd-8-1047-2017-supplement.
Author contributions. JaW performed the simulations, analyzed the data, produced all figures and wrote most of the manuscript. DW conceived and supervised the research and contributed to the writ-ing, in particular regarding the electricity system. MR supplied the CWT analysis and wrote parts of the CWT chapter. All authors con-tributed ideas, gave feedback and helped to improve the manuscript.
Competing interests. The authors declare that they have no con-flict of interest.
Acknowledgements. We thank Martin Greiner, Gorm Bruun An-dresen, Smail Kozarcanin, Tom Brown, David Schlachtberger and Christoph Ball for stimulating discussions. We owe Julia Brugger gratitude for checking the final manuscript. We also acknowledge the World Climate Research Programme’s Working Group on Regional Climate, and the Working Group on Coupled Modeling, former coordinating body of CORDEX and responsible panel for CMIP5. We thank the climate modeling groups for producing and making available their model output. We acknowledge the Earth System Grid Federation infrastructure an international effort led by the U.S. Department of Energy’s Program for Climate Model Diagnosis and Intercomparison, the European Network for Earth System Modelling and other partners in the Global Organization for Earth System Science Portals (GO-ESSP). The authors gratefully acknowledge the computing time granted by the JARA-HPC Vergabegremium on the supercomputer JURECA (Jülich Supercomputing Centre, 2016) at Forschungszentrum Jülich. We gratefully acknowledge support from the Helmholtz Association (via the joint initiative “Energy System 2050 – A Contribution of the Research Field Energy” and the grant no. VH-NG-1025 to Dirk Witthaut).
The article processing charges for this open-access publication were covered by a Research
Centre of the Helmholtz Association.
Edited by: Somnath Baidya Roy Reviewed by: two anonymous referees
References
Anderson, K. and Peters, G.: The trouble with negative emissions, Science, 354, 182–183, 2016.
Auffhammer, M., Baylis, P., and Hausman, C. H.: Climate change is projected to have severe impacts on the fre-quency and intensity of peak electricity demand across the United States, P. Natl. Acad. Sci. USA, 114, 1886–1891, https://doi.org/10.1073/pnas.1613193114, 2017.
Battaglini, A., Komendantova, N., Brtnik, P., and Patt, A.: Perception of barriers for expansion of electricity grids in the European Union, Energy Policy, 47, 254–259, https://doi.org/10.1016/j.enpol.2012.04.065, 2012.
Becker, S., Rodriguez, R., Andresen, G., Schramm, S., and Greiner, M.: Transmission grid extensions during the build-up of a fully renewable pan-European electricity supply, Energy, 64, 404–418, https://doi.org/10.1016/j.energy.2013.10.010, 2014.
Bloomfield, H. C., Brayshaw, D. J., Shaffrey, L. C., Coker, P. J., and Thornton, H. E.: Quantifying the increasing sensitivity of power systems to climate variability, Environ. Res. Lett., 11, 124025, https://doi.org/10.1088/1748-9326/11/12/124025, 2016. Brown, T., Schierhorn, P.-P., Troester, E., and Ackermann, T.:
Op-timising the European transmission system for 77 % renew-able electricity by 2030, IET Renew. Power Gen., 10, 3–9, https://doi.org/10.1049/iet-rpg.2015.0135, 2016.
Bruckner, T., Bashmakov, I. A., Mulugetta, Y., Chum, H., de la Vega Navarro, A., Edmonds, J., Faaij, A., Fungtammasan, B., Garg, A., Hertwich, E., Honnery, D., Infield, D., Kainuma, M., Khen-nas, S., Kim, S., Nimir, H. B., Riahi, K., Strachan, N., Wiser, R., and Zhang, X.: Energy Systems, in: Climate Change 2014: Mit-igation of Climate Change. Contribution of Working Group III to the Fifth Assessment Report of the Intergovernmental Panel on Climate Change, edited by: Edenhofer, O., Pichs-Madruga, R., Sokona, Y., Farahani, E., Kadner, S., Seyboth, K., Adler, A., Baum, I., Brunner, S., Eickemeier, P., Kriemann, B., Savolainen, J., Schlömer, S., von Stechow, C., Zwickel, T., and Minx, J. C., Cambridge University Press, Cambridge, UK and New York, NY, USA, 2014.
Chiacchio, M., Solmon, F., Giorgi, F., Stackhouse, P., and Wild, M.: Evaluation of the radiation budget with a regional climate model over Europe and inspection of dimming and brightening: Eval-uation of the radiation budget, J. Geophys. Res.-Atmos., 120, 1951–1971, https://doi.org/10.1002/2014JD022497, 2015. Coumou, D., Lehmann, J., and Beckmann, J.: The weakening
sum-mer circulation in the Northern Hemisphere mid-latitudes, Sci-ence, 348, 324–327, 2015.
Crook, J. A., Jones, L. A., Forster, P. M., and Crook, R.: Cli-mate change impacts on future photovoltaic and concentrated solar power energy output, Energ. Environ. Sci., 4, 3101, https://doi.org/10.1039/c1ee01495a, 2011.
Davis, S. J., Caldeira, K., and Matthews, H. D.: Fu-ture CO2 Emissions and Climate Change from Exist-ing Energy Infrastructure, Science, 329, 1330–1333, https://doi.org/10.1126/science.1194210, 2010.
European Network of Transmission System Operators for Elec-tricity: Hourly load values for all countries for a specific month (in MW), available at: https://www.entsoe.eu/db-query/ consumption/mhlv-all-countries-for-a-specific-month (last ac-cess: 21 November 2016), 2015.
Farneti, R.: Modelling interdecadal climate variability and the role of the ocean, Wiley Interdisciplinary Reviews: Climate Change, 8, e441, https://doi.org/10.1002/wcc.441, 2017.
Gonzalez Aparcio, I., Zucker, A., Careri, F., Monforti, F., Huld, T., and Badger, J.: EMHIRES dataset; Part 1: Wind power genera-tion, Tech. Rep. EUR 28171 EN, Joint Research Center, 2016. Grams, C. M., Beerli, R., Pfenninger, S., Staffell, I., and Wernli, H.:
Balancing Europe’s wind-power output through spatial deploy-ment informed by weather regimes, Nature Climate Change, 7, 557–562, https://doi.org/10.1038/nclimate3338, 2017.
Gutowski Jr., W. J., Giorgi, F., Timbal, B., Frigon, A., Jacob, D., Kang, H.-S., Raghavan, K., Lee, B., Lennard, C., Nikulin, G., O’Rourke, E., Rixen, M., Solman, S., Stephenson, T., and Tan-gang, F.: WCRP COordinated Regional Downscaling EXperi-ment (CORDEX): a diagnostic MIP for CMIP6, Geosci. Model Dev., 9, 4087–4095, https://doi.org/10.5194/gmd-9-4087-2016, 2016.
Haarsma, R. J., Selten, F., and van Oldenborgh, G. J.: An-thropogenic changes of the thermal and zonal flow struc-ture over Western Europe and Eastern North Atlantic in CMIP3 and CMIP5 models, Clim. Dynam., 41, 2577–2588, https://doi.org/10.1007/s00382-013-1734-8, 2013.
Haekkinen, S., Rhines, P. B., and Worthen, D. L.: Atmospheric Blocking and Atlantic Multidecadal Ocean Variability, Science, 334, 655–659, 2011.
Hagspiel, S., Jaegemann, C., Lindenberger, D., Brown, T., Chere-vatskiy, S., and Troester, E.: Cost-optimal power system exten-sion under flow-based market coupling, Energy, 66, 654–666, https://doi.org/10.1016/j.energy.2014.01.025, 2014.
Hawkins, E. and Sutton, R.: The potential to narrow uncertainty in regional climate predictions, B. Am. Meteorol. Soc., 90, 1095– 1107, https://doi.org/10.1175/2009BAMS2607.1, 2009. Hawkins, E., Smith, R. S., Gregory, J. M., and Stainforth, D. A.:
Ir-reducible uncertainty in near-term climate projections, Clim. Dy-nam., 46, 3807–3819, https://doi.org/10.1007/s00382-015-2806-8, 2016.
Herwehe, J. A., Alapaty, K., Spero, T. L., and Nolte, C. G.: Increasing the credibility of regional climate simula-tions by introducing subgrid-scale cloud-radiation in-teractions, J. Geophys. Res.-Atmos., 119, 5317–5330, https://doi.org/10.1002/2014JD021504, 2014.
Huber, M., Dimkova, D., and Hamacher, T.: Integra-tion of wind and solar power in Europe: Assess-ment of flexibility requirements, Energy, 69, 236–246, https://doi.org/10.1016/j.energy.2014.02.109, 2014.
Jacob, D., Petersen, J., Eggert, B., Alias, A., Christensen, O. B., Bouwer, L. M., Braun, A., Colette, A., Déqué, M., Georgievski, G., Georgopoulou, E., Gobiet, A., Menut, L., Nikulin, G., Haensler, A., Hempelmann, N., Jones, C., Keuler, K., Ko-vats, S., Kröner, N., Kotlarski, S., Kriegsmann, A., Martin, E., van Meijgaard, E., Moseley, C., Pfeifer, S., Preuschmann, S., Radermacher, C., Radtke, K., Rechid, D., Rounsevell, M., Samuelsson, P., Somot, S., Soussana, J.-F., Teichmann, C., Valentini, R., Vautard, R., Weber, B., and Yiou, P.:
EURO-CORDEX: new high-resolution climate change projections for European impact research, Reg. Environ. Change, 14, 563–578, https://doi.org/10.1007/s10113-013-0499-2, 2014.
James, R., Washington, R., Schleussner, C.-F., Rogelj, J., and Conway, D.: Characterizing half-a-degree difference: a re-view of methods for identifying regional climate responses to global warming targets: Characterizing half-a-degree differ-ence, Wiley Interdisciplinary Reviews: Climate Change, 8, e457, https://doi.org/10.1002/wcc.457, 2017.
Jerez, S., Tobin, I., Vautard, R., Montávez, J. P., López-Romero, J. M., Thais, F., Bartok, B., Christensen, O. B., Colette, A., Déqué, M., Nikulin, G., Kotlarski, S., van Meijgaard, E., Teich-mann, C., and Wild, M.: The impact of climate change on pho-tovoltaic power generation in Europe, Nat. Commun., 6, 10014, https://doi.org/10.1038/ncomms10014, 2015.
Jones, P. D., Hulme, M., and Briffa, K. R.: A comparison of Lamb circulation types with an objective classification scheme, Int. J. Climatol., 13, 655–663, 1993.
Jülich Supercomputing Centre: JURECA: General-purpose super-computer at Jülich Supercomputing Centre, Journal of Large-Scale Research Facilities, 2, A62, https://doi.org/10.17815/jlsrf-2-121, 2016.
Knutti, R., Masson, D., and Gettelman, A.: Climate model geneal-ogy: Generation CMIP5 and how we got there, Geophys. Res. Lett., 40, 1194–1199, https://doi.org/10.1002/grl.50256, 2013. Mastrandrea, M. D., Field, C. B., Stocker, T. F., Edenhofer, O.,
Ebi, K. L., Frame, D. J., Held, H., Kriegler, E., Mach, K. J., Matschoss, P. R., Plattner, G.-K., Yohe, G. W., and Zwiers, F. W.: Guidance note for lead authors of the IPCC fifth assessment report on consistent treatment of uncertainties, available at: http://pubman.mpdl.mpg.de/pubman/item/escidoc:2147184/ component/escidoc:2147185/uncertainty-guidance-note.pdf (last access: 13 April 2017), 2010.
Moemken, J., Reyers, M., Buldmann, B., and Pinto, J. G.: Decadal predictability of regional scale wind speed and wind energy potentials over Central Europe, Tellus A, 68, 29199, https://doi.org/10.3402/tellusa.v68.29199, 2016.
Monforti, F., Gaetani, M., and Vignati, E.: How synchronous is wind energy production among European countries?, Re-newable and Sustainable Energy Reviews, 59, 1622–1638, https://doi.org/10.1016/j.rser.2015.12.318, 2016.
Peings, Y. and Magnusdottir, G.: Forcing of the wintertime atmospheric circulation by the multidecadal fluctuations of the North Atlantic ocean, Environ. Res. Lett., 9, 034018, https://doi.org/10.1088/1748-9326/9/3/034018, 2014.
Pfenninger, S. and Staffell, I.: Long-term patterns of Eu-ropean PV output using 30 years of validated hourly reanalysis and satellite data, Energy, 114, 1251–1265, https://doi.org/10.1016/j.energy.2016.08.060, 2016.
Pfenninger, S., Gauché, P., Lilliestam, J., Damerau, K., Wagner, F., and Patt, A.: Potential for concentrating solar power to pro-vide baseload and dispatchable power, Nature Climate Change, 4, 689–692, https://doi.org/10.1038/nclimate2276, 2014. Rasmussen, M. G., Andresen, G. B., and Greiner, M.:
Stor-age and balancing synergies in a fully or highly renew-able pan-European power system, Energy Policy, 51, 642–651, https://doi.org/10.1016/j.enpol.2012.09.009, 2012.
applica-tions to decadal hindcasts and climate change projecapplica-tions, Int. J. Climatol., 35, 229–244, https://doi.org/10.1002/joc.3975, 2015. Reyers, M., Moemken, J., and Pinto, J. G.: Future changes
of wind energy potentials over Europe in a large CMIP5 multi-model ensemble, Int. J. Climatol., 36, 783–796, https://doi.org/10.1002/joc.4382, 2016.
Rodriguez, R. A., Becker, S., Andresen, G. B., Heide, D., and Greiner, M.: Transmission needs across a fully renew-able European power system, Renew. Energ., 63, 467–476, https://doi.org/10.1016/j.renene.2013.10.005, 2014.
Rodriguez, R. A., Becker, S., and Greiner, M.: Cost-optimal design of a simplified, highly renewable pan-European electricity system, Energy, 83, 658–668, https://doi.org/10.1016/j.energy.2015.02.066, 2015a.
Rodriguez, R. A., Dahl, M., Becker, S., and Greiner, M.: Local-ized vs. synchronLocal-ized exports across a highly renewable pan-European transmission network, Energy, Sustainability and So-ciety, 5, 21, https://doi.org/10.1186/s13705-015-0048-6, 2015b. Rogelj, J., Luderer, G., Pietzcker, R. C., Kriegler, E., Schaeffer,
M., Krey, V., and Riahi, K.: Energy system transformations for limiting end-of-century warming to below 1.5◦C, Nature Cli-mate Change, 5, 519–527, https://doi.org/10.1038/ncliCli-mate2572, 2015.
Rogelj, J., den Elzen, M., Hoehne, N., Fransen, T., Fekete, H., Winkler, H., Schaeffer, R., Sha, F., Riahi, K., and Mein-shausen, M.: Paris Agreement climate proposals need a boost to keep warming well below 2◦C, Nature, 534, 631–639, https://doi.org/10.1038/nature18307, 2016.
Rummukainen, M.: Added value in regional climate modeling, Wiley Interdisciplinary Reviews: Climate Change, 7, 145–159, https://doi.org/10.1002/wcc.378, 2016.
Schlachtberger, D., Becker, S., Schramm, S., and Greiner, M.: Backup flexibility classes in emerging large-scale renewable electricity systems, Energ. Convers. Manage., 125, 336–346, https://doi.org/10.1016/j.enconman.2016.04.020, 2016. Schlachtberger, D., Brown, T., Schramm, S., and Greiner,
M.: The benefits of cooperation in a highly renewable European electricity network, Energy, 134, 469–481, https://doi.org/10.1016/j.energy.2017.06.004, 2017.
Schleussner, C.-F., Lissner, T. K., Fischer, E. M., Wohland, J., Perrette, M., Golly, A., Rogelj, J., Childers, K., Schewe, J., Frieler, K., Mengel, M., Hare, W., and Schaeffer, M.: Differen-tial climate impacts for policy-relevant limits to global warming: the case of 1.5◦C and 2◦C, Earth Syst. Dynam., 7, 327–351, https://doi.org/10.5194/esd-7-327-2016, 2016a.
Schleussner, C.-F., Rogelj, J., Schaeffer, M., Lissner, T., Licker, R., Fischer, E. M., Knutti, R., Levermann, A., Frieler, K., and Hare, W.: Science and policy characteristics of the Paris Agree-ment temperature goal, Nature Climate Change, 6, 827–835, https://doi.org/10.1038/nclimate3096, 2016b.
Staffell, I. and Pfenninger, S.: Using bias-corrected reanalysis to simulate current and future wind power output, Energy, 114, 1224–1239, https://doi.org/10.1016/j.energy.2016.08.068, 2016. Stocker, T. F., Qin, D., Plattner, G.-K., et al.: Technical sum-mary, in: Climate Change 2013: The Physical Science Basis. Contribution of Working Group I to the Fifth As-sessment Report of the Intergovernmental Panel on Climate Change, 33–115, Cambridge University Press, available at: http://pubman.mpdl.mpg.de/pubman/item/escidoc:1977530/
component/escidoc:1977527/WG1AR5_TS_FINAL.pdf (last access: 3 March 2017), 2013.
Strandberg, G., Bärring, L., Hansson, U., Jansson, C., Jones, C., Kjellström, E., Kolax, M., Kupiainen, M., Nikulin, G., Samuelsson, P., Ullerstig, A., and Wang, S.: CORDEX scenar-ios for Europe from the Rossby Centre regional climate model RCA4, SMHI, Sveriges Meteorologiska och Hydrologiska Insti-tut, 2015.
Taylor, K. E., Stouffer, R. J., and Meehl, G. A.: An Overview of CMIP5 and the Experiment Design, B. Am. Meteorol. Soc., 93, 485–498, 2011.
Tobin, I., Vautard, R., Balog, I., Bréon, F.-M., Jerez, S., Ruti, P. M., Thais, F., Vrac, M., and Yiou, P.: Assessing climate change impacts on European wind energy from ENSEMBLES high-resolution climate projections, Climatic Change, 128, 99–112, https://doi.org/10.1007/s10584-014-1291-0, 2015.
Tobin, I., Jerez, S., Vautard, R., Thais, F., van Meijgaard, E., Prein, A., Deque, M., Kotlarski, S., Maule, C. F., Nikulin, G., Noel, T., and Teichmann, C.: Climate change impacts on the power gener-ation potential of a European mid-century wind farms scenario, Environ. Res. Lett., 11, 034013, https://doi.org/10.1088/1748-9326/11/3/034013, 2016.
Trump, D. J.: Presidential Executive Order on Promot-ing Energy Independence and Economic Growth, available at: https://www.whitehouse.gov/the-press- office/2017/03/28/presidential-executive-order-promoting-energy-independence-and-economi-1 (last access: 4 June 2017), 2017.
UNFCCC: Adoption of the Paris Agreement, FCCC/CP/2015/10/Add.1, 2015.
van Vliet, M. T. H., Yearsley, J. R., Ludwig, F., Voegele, S., Let-tenmaier, D. P., and Kabat, P.: Vulnerability of US and European electricity supply to climate change, Nature Climate Change, 2, 676–681, https://doi.org/10.1038/nclimate1546, 2012.
van Vliet, M. T. H., Wiberg, D., Leduc, S., and Riahi, K.: Power-generation system vulnerability and adaptation to changes in cli-mate and water resources, Nature Clicli-mate Change, 6, 375–380, https://doi.org/10.1038/nclimate2903, 2016.
van Vuuren, D. P., van Soest, H., Riahi, K., Clarke, L., Krey, V., Kriegler, E., Rogelj, J., Schaeffer, M., and Tavoni, M.: Carbon budgets and energy transition pathways, Environ. Res. Lett., 11, 075002, https://doi.org/10.1088/1748-9326/11/7/075002, 2016. Vautard, R., Thais, F., Tobin, I., Bréon, F.-M., de Lavergne,
J.-G. D., Colette, A., Yiou, P., and Ruti, P. M.: Regional climate model simulations indicate limited climatic impacts by oper-ational and planned European wind farms, Nat. Commun., 5, 3196, https://doi.org/10.1038/ncomms4196, 2014.
Weber, J., Wohland, J., Reyers, M., Moemken, J., Hoppe, C., Pinto, J. G., and Witthaut, D.: Impact of climate change on backup and storage needs in a wind-dominated European power system, in review, 2017.