Nonlin. Processes Geophys., 17, 319–327, 2010 www.nonlin-processes-geophys.net/17/319/2010/ doi:10.5194/npg-17-319-2010
© Author(s) 2010. CC Attribution 3.0 License.
Nonlinear Processes
in Geophysics
Assessing microstructures of pyrrhotites in basalts by multifractal
analysis
S. Xie1,2,3, Q. Cheng1,3, S. Zhang1,4, and K. Huang2
1State Key Laboratory of Geological Processes and Mineral Resources (GPMR), China University of Geosciences (CUG), Wuhan, 430074, China
2Earth Science Faculty, China University of Geosciences (CUG), Wuhan, 430074, China
3Department of Earth and Space Science and Engineering, York University, Toronto, ON, M3J 1P3, Canada 4Institute of Resources and Environment, Shijiazhuang University of Economics, Hebei, 050031, China Received: 25 March 2010 – Revised: 28 June 2010 – Accepted: 29 June 2010 – Published: 19 July 2010
Abstract. Understanding and describing spatial arrange-ments of mineral particles and determining the mineral dis-tribution structure are important to model the rock-forming process. Geometric properties of individual mineral parti-cles can be estimated from thin sections, and different mod-els have been proposed to quantify the spatial complexity of mineral arrangement. The Gejiu tin-polymetallic ore-forming district, located in Yunnan province, southwestern China, is chosen as the study area. The aim of this pa-per is to apply fractal and multifractal analysis to quan-tify distribution patterns of pyrrhotite particles from twenty-eight binary images obtained from seven basalt segments and then to discern the possible petrological formation en-vironments of the basalts based on concentrations of trace elements. The areas and perimeters of pyrrhotite particles were measured for each image. Perimeter-area fractal anal-ysis shows that the perimeter and area of pyrrhotite particles follow a power-law relationship, which implies the scale-invariance of the shapes of the pyrrhotites. Furthermore, the spatial variation of the pyrrhotite particles in space was characterized by multifractal analysis using the method of moments. The results show that the average values of the area-perimeter exponent (DAP), the width of the multifractal
spectra (1(D(0)−D(2))and 1(D(qmin)−D(qmax))) and the multifractality index (τ00(1)) for the pyrrhotite particles reach their minimum in the second basalt segment, which implies that the spatial arrangement of pyrrhotite particles in Segment 2 is less heterogeneous. Geochemical trace ele-ment analysis results distinguish the second basalt segele-ment sample from other basalt samples. In this aspect, the
frac-Correspondence to: S. Xie
tal and multifractal analysis may provide new insights into the quantitative assessment of mineral microstructures which may be closely associated with the petrogenesis as shown by the bulk-rock geochemical analysis.
1 Introduction
In nature, many objects can be viewed as random two-component systems. For example, sedimentary rocks are composed of pore and solid components. Soil systems also can be separated into pores and solid particles. Correspond-ingly, image analytical techniques (Gerard, 1992; Flavior et al., 1998) have been extensively used to recognize and sep-arate these two components. Since the concept of fractal emerged (Mandelbrot, 1977), various fractal and multifrac-tal models have been proposed to characterize the spatial va-riety of different patterns for pore and solid components in both sedimentary rocks (Muller and McCauley, 1992; Mc-Cauley, 1992; Muller et al., 1995; Muller, 1996; Xie et al., 2010a; Kron, 1986) and soils (Bird et al., 2006; Pachepsky et al., 2000; Perrier et al., 1999).
320 S. Xie et al.: Assessing microstructures of pyrrhotites in basalts by multifractal analysis Generally, metallic ore-bearing rocks are composed of ore
minerals and gangue minerals. Ore minerals usually refer to the utilizable metallic or non-metallic minerals within ores, such as chromites in chromium ores, chalcopyrrhotites and bornites in copper ores, and asbestos in asbestine ores as well. Gangue minerals, called as useless minerals, often re-fer to materials so intimately associated with ore that it has to be mined with, and later removed by various crushing, grinding and separation processes. In such a sense, ores can also be separated into two components in a two-dimensional space, one is the solid gangue mineral component and the other is the metallic mineral component. Thus, binary im-age techniques can also be used to recognize these two parts and the mineral structures can be characterized by different statistical methods as well. By Number-Area (N-A) model, Perimeter-Area (P-A) model, box-counting fractal model and multifractal models, the microstructures of rocks and ores during deformation and replacement have been studied and the complexity and irregularity of minerals shown by the fractal and multifractal dimensions provide information on mineral genesis (Wang, 2008). With the discrete multifrac-tal technique, Wang (2008) explored the transfer relation-ship between the sphalerite and carbonate particles across the sphalerite band structure during growth by Markov Chain model. Box-counting dimensions, generalized fractal dimen-sions and multifractal spectra have been calculated to char-acterize the spatial structure of the pyrites in two ore-bearing skarn samples and then to discuss the link between the multi-fractal parameters and the ore-forming potentials of the rocks under consideration (Xie et al., 2009). The generalized P-A model in combination with cumulative N-P-A fractal model and shape indexes are also used to distinguish between cas-siterites of different phases in tin-deposits (Zuo et al., 2009). In this paper, we consider twenty-eight binary images of thin sections from seven ore-bearing basalt segments, and analyze the spatial distribution patterns of pyrrhotite miner-als in the basalts by parameter-area (P-A) model and multi-fractal analysis using the method of moments. On the other hand, we demonstrate how multifractal distribution patterns of metallic minerals could be correlated with the petrogenic processes of the basalts together with the geochemical bulk-rock trace element analysis.
2 Geological background
The study area is the Gejiu tin district located in the southeast of Yunnan province. The Gejiu super-large Tin-polymetallic deposit in the eastern Gejiu area is an impor-tant tin-dominated ore concentration center and has more than 20 kinds of other nonferrous and rare metal resources, such as Cu, Pb, Zn, W, Ag, Bi, In, and so on. Because of the complex geological settings and abundant mineral re-sources, Gejiu area has attracted international extensive in-terests in recent decades (Yu et al., 1988; Chen, 2007). Gejiu
tin-polymetallic ore deposit has the characteristics of typical volcano-sedimentary ore deposits (Li et al., 2006).
The volcanic activities mainly occurred during three stages in the Middle Triassic period, including Anisian stage, La-dinian stage and Norian stage. By and large, the basalts of Anisian stage distribute extensively in the eastern Gejiu area, whereas the basalts of Ladinian stage and Norian stage are in western Gejiu area. The Anisian basalts in Gejiu formation of the first section (T2g1)mainly occurred in layers among the carbonates of the same strata. The basalt rock mass con-formably contacts each other. Some folds are present along the contact lines. It is reported that the Anisian basalt played an important role in the formation of Gejiu tin-polymetallic ore deposits (Li et al., 2007). The Anisian basalts were successively present in Qibeishan, Laochang and Gejiu tin-copper polymetallic deposit, and the genesis of these basalts from different segments has been debated. In Gejiu tin-copper deposit, the Anisian basalts, which are weakly ore-bearing, were present in seven segments underground. Ta-ble 1 shows the outcrop depths of these basalts in different segments. In this work, eight samples were continuously col-lected. As shown in Table 1, two samples were from the sec-ond segment and one sample per segment from the other six segments.
For all the basalt samples, polished sections were made (as listed in Table 1), microscopic examination was conducted, and metallic minerals were observed. All the samples are biotite tremolitic basalts. It is found that, besides a small amount of pyrites and chalcopyrites, the major metallic min-erals are pyrrhotites which amount to 10–20 wt%.
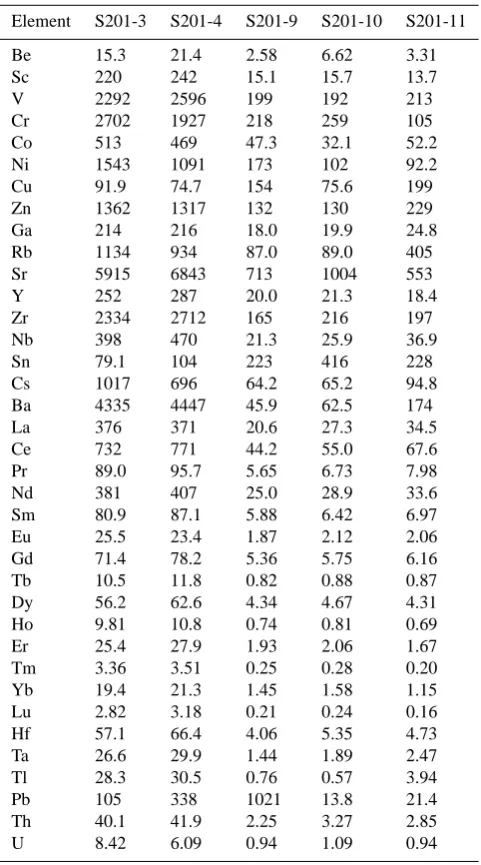
All the eight basalt samples were sent to the state key lab of Geological Processes and Mineral Resources at China University of Geosciences to measure the concentrations of 37 trace elements using laser ablation-inductively coupled plasma-mass spectrometry (LA-ICP-MS). Detailed operat-ing conditions for the laser ablation system and the ICP-MS instrument and data reduction can be refereed to Liu et al. (2008). However, due to the high concentrations of Pb and some associated elements, which may affect the stability of the instrument, only those data from five basalt samples were reported (Table 1). The five samples include Sample 201-3 and Sample 201-4 from the second basalt segment, and Sample 201-9, 201-10 and 201-11 from the fifth, sixth and seventh basalt segment, respectively.
3 Image processing
S. Xie et al.: Assessing microstructures of pyrrhotites in basalts by multifractal analysis 321 detected. Some quite small separate particles unrelated to pyrrhotite aggregates have been deleted
and removed. It can reasonably approximate the extracted outline of the pyrrhotite aggregates, as shown in Fig. 1b. Likewise, other images were processed with the same steps and then further calculation and analysis can be performed.
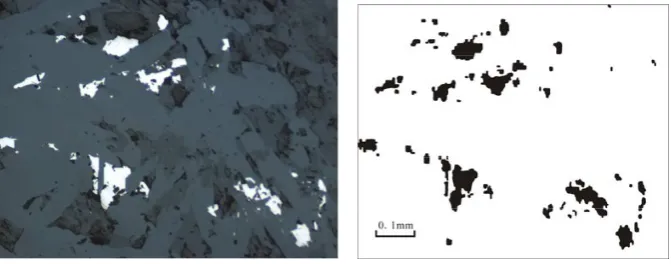
Fig.1. (a) The digital image of the sample from the second basalt segment under the Environmental Scanning Electron Microscope (ESEM). (b)Rock binary image, the pyrrhotite particle with black pixels and the gangue
mineral in white. This figure only extracts the major pyrrhotite particles from the ESEM image in Fig. 1a in order to eliminate the distortion by the magnification scale. And used for calculation in the paper are the pyrrhotite particles shown as the black pixels.
4 Fractal and multifractal analysis
4.1 P-A fractal analysis
The Perimeter-area (P-A) model, or island-arcs model, was firstly put forward by Mandelbrot (Mandelbrot B., 1977, 1983). It relates the perimeters and areas within a set of irregular self-similar geometrical shapes. The P-A model was used to analyze the geometry of cloud areas and characterize the degree of complexity of the cloud shapes (Lovejoy, 1982). A general form of P-A was proposed and originally applied for characterizing copper porphyry alteration zones with both irregular areas and perimeters (Cheng et al., 1994). This modified model has been also applied to characterize the distributions of trace elements in minerals (Zhang et al., 2001) and shapes for minerals (Wang et al., 2006; Wang, 2008; Zuo et al., 2009).
The original form of P-A proposed by Mandelbrot (Mandelbrot B., 1977, 1983) was
P
D
A P 2
1
∝ , (1)
where Dp is the fractal dimension of perimeter P. It was found that this model is only valid for regular areas but not for fractal areas. For fractal areas the more general form was proposed by Cheng et al.(1994):
AP
D
A P 2
1
∝ , (2)
where P is the perimeter and A is the area of one pyrrhotite particle in the thin section, “∝” means “proportional to”, and DAP = DP/DA is the ratio of the fractal dimension of perimeter DP
over the fractal dimension of area DA. It can be seen that only if the area is a normal area with
dimension 2, then DAP = DP, accordingly the general form becomes the original one. More discussions about the new model are refereed to Cheng (1995).
On log-log plots, the data of P and A can be plotted and the linear relationship between them
4
Fig. 1. (a) The digital image of the sample from the second basalt segment under the Environmental Scanning Electron Microscope (ESEM). (b) Rock binary image, the pyrrhotite particle with black pixels and the gangue mineral in white. This figure only extracts the major pyrrhotite
particles from the ESEM image in (a) in order to eliminate the distortion by the magnification scale. And used for calculation in the paper are the pyrrhotite particles shown as the black pixels.
Table 1. Basic information about the samples used for analysis.
Basalt Segment 1 2 3 4 5 6 7
Depth underground (m) 432.77–446.89 448.89–466.82 467.82–473.97 489.45–491.70 493.17–496.67 498.42–500.67 503.74–512.19
Sample Label 201-1 201-3 201-4 201-5 201-6 201-9 201-10 201-11
Polished section √ √ √ √ √ √ √ √
Trace element analysis √ √ √ √ √
Information System) techniques. The pyrrhotite image of the samples from Segment 2 is used here as an example to introduce the steps of image processing. The pyrrhotite pho-tomicrograph was taken using plane reflected light, digitized as a 256-grey scale black-white image (Fig. 1a), and then converted into a binary image according to the grey scales (Fig. 1b). Repeated empirical experiments have indicated that the outlines with 120-grey scale are adequate to separate pyrrhotite aggregates from gangue minerals. Other metal-lic particles, such as sphalerites and chalcopyrites which are too few and sparse, are not included in the calcula-tion. The perimeters and the coverage spaces of these ex-tracted pyrrhotite particles can be readily detected. Some quite small separate particles unrelated to pyrrhotite aggre-gates have been deleted and removed. It can reasonably ap-proximate the extracted outline of the pyrrhotite aggregates, as shown in Fig. 1b. Likewise, other images were processed with the same steps and then further calculation and analysis can be performed.
4 Fractal and multifractal analysis
4.1 P-A fractal analysis
The Perimeter-area (P-A) model, or island-arcs model, was firstly put forward by Mandelbrot (Mandelbrot, 1977, 1983). It relates the perimeters and areas within a set of irregular self-similar geometrical shapes. The P-A model was used to
analyze the geometry of cloud areas and characterize the de-gree of complexity of the cloud shapes (Lovejoy, 1982). A general form of P-A was proposed and originally applied for characterizing copper porphyry alteration zones with both ir-regular areas and perimeters (Cheng et al., 1994). This mod-ified model has been also applied to characterize the distribu-tions of trace elements in minerals (Zhang et al., 2001) and shapes for minerals (Wang et al., 2005; Wang, 2008; Zuo et al., 2009).
The original form of P-A proposed by Mandelbrot (Man-delbrot, 1977, 1983) was
P∝A12DP, (1)
whereDp is the fractal dimension of perimeterP. It was
found that this model is only valid for regular areas but not for fractal areas. For fractal areas the more general form was proposed by Cheng et al. (1994):
P∝A12DAP, (2)
whereP is the perimeter andAis the area of one pyrrhotite particle in the thin section, “∝” means “proportional to”, andDAP =DP/DA is the ratio of the fractal dimension of
perimeterDP over the fractal dimension of areaDA. It can
be seen that only if the area is a normal area with dimension 2, thenDAP =DP, accordingly the general form becomes
322 S. Xie et al.: Assessing microstructures of pyrrhotites in basalts by multifractal analysis can be shown. Then the area-perimeter exponent DAP can be calculated by fitting a straight line
using the least-squares method. The slope of the P-A line can be estimated with the value of ½DAP
according to Eq.(1). Usually, DAP ranges from 1 to 2.
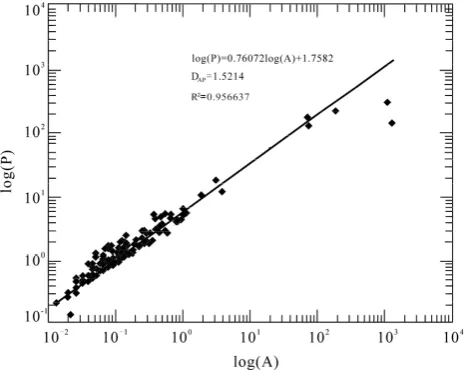
The image in Fig. 1b is applied to measure the perimeters and areas of the pyrrhotite particles under MapGIS, a GIS software platform developed by China University of Geosciences. According to Eq.(2), the values of the perimeters and the areas are plotted in the log-log diagram (shown in Fig. 2) and these dots can be fitted with a straight line. Consequently, the DAP value can
be calculated based on the slope of the fitted straight line. All the DAP values have been obtained
for the 28 digital images and all the average DAP values from different segments are listed in Table
2.
Fig.2. P-A analysis results of the pyrrhotite particles from Segment 6
Table 2. Average DAP values of the pyrrhotite particles from the seven basalt samples
1 2 3 4 5 6 7
DAP 1.3576 1.2591 1.5639 1.3632 1.3414 1.4878 1.3035
Table 2 shows that all the DAP values are ranging from 1 to 2, which implies the irregularity
of the metallic pyrrhotite particles at the microscale levels. The average DAP value for Segment 2
is 1.25 and reaches a minimum, while the other average DAP values greater than 1.3. This may
imply that the shapes of the pyrrhotite particles in Segment 2 are less irregular.
4.2 Multifractal analysis
In this study, we also compute multifractal dimensions. In terms of multifractal analysis, similarly
5
Fig. 2. P-A analysis results of the pyrrhotite particles from
Seg-ment 6.
On log-log plots, the data ofP andAcan be plotted and the linear relationship between them can be shown. Then the area-perimeter exponentDAP can be calculated by fitting a
straight line using the least-squares method. The slope of the P-A line can be estimated with the value of 1/2DAP
accord-ing to Eq. (2). Usually,DAP ranges from 1 to 2.
The image in Fig. 1b is applied to measure the perimeters and areas of the pyrrhotite particles under MapGIS, a GIS software platform developed by China University of Geo-sciences. According to Eq. (2), the values of the perime-ters and the areas are plotted in the log-log diagram (shown in Fig. 2) and these dots can be fitted with a straight line. Consequently, theDAP value can be calculated based on the
slope of the fitted straight line. All theDAP values have been
obtained for the 28 digital images and all the averageDAP
values from different segments are listed in Table 2.
Table 2 shows that all theDAP values are ranging from 1
to 2, which implies the irregularity of the metallic pyrrhotite particles at the microscale levels. The averageDAP value for
Segment 2 is 1.25 and reaches a minimum, while the other averageDAP values greater than 1.3. This may imply that
the shapes of the pyrrhotite particles in Segment 2 are less irregular.
4.2 Multifractal analysis
In this study, we also compute multifractal dimensions. In terms of multifractal analysis, similarly to pore structure analysis for soil pore systems (Bird et al., 2006) and car-bonate pore systems (Xie et al., 2010a), we define here a measure associated with the metallic particles of the digital images. There are some other examples involving definition of binary pattern as multifractal measures such as fractures (Agterberg et al., 1996), alteration zones, rocks, and so on. Simply, a grid box with sizeδcan be made to superimpose
over the part of the metallic mineral spaces (the black pixels as shown in Fig. 1b) in the studied images. Supposed that a grid box containsmi pixels, wheremi takes a value from 1
toδ×δ. Then the measure, denoted herein byµi(δ), of the ith box covering the metallic pyrrhotite particles, is defined asmi/M, where M is the total number of pyrrhotite particle
pixels in the image. Thus, a partition function,χq(δ), with
the momentq ofµi(δ)can be constructed as the following
equation (Halsey, 1986; Bird et al., 2006):
χq(δ)= n(δ)
X
i=1
(µi)q= n(δ)
X
i=1
(mi
M)
q=
δ×δ
X
j=1
Nj( j
M)
q, (3)
wheren(δ)is the number of small boxes covering the metal-lic particle pixels, andNj is the number of boxes containing j pixels. The sum in Eq. (3) can be calculated over all the boxes.
In this way, there exists the power-law relationship be-tween the partition functionχq(δ)and the box sizeδ,
χq(δ)∝δτ (q), (4)
whereτ (q)is the mass exponent of orderqwhich can be ob-tained by plotting the data ofχq(δ)andδon log-log diagrams
as the limit whenδ→w. Directly from the mass exponent
τ (q)and the orderq, the generalized multifractal dimensions can be expressed as:
D(q)=τ (q)
1−q (q6=1), (5)
whenq=1 the information dimension,D(1), is obtained as following:
D(1)=lim
r→0
N (r)
P
i=1
µi(δ)logµi(δ)
logr . (6)
According to Eq. (5), the correlation dimension,D(2), is ob-tained whenq=2.
The generalized multifractal spectrum function,f (α), can then be calculated through Legendre transform (Evertsz and Mandelbrot, 1992):
f (α(q))=α(q)q−τ (q), (7)
where the so-called singularity exponent, α(q), can be ef-fectively deduced byα(q)=∂τ (q)/∂q. For multifractal dis-tribution patterns, the spectrumf(α) has a concave down-ward curvature with α-values falling into a range. In case of single fractal distribution measures,α(q)will remain the same for all the boxes of the same sizes covering the metallic particle, and the multifractal spectrumf(α) will be a single point. Anyway, whenq=0, thef(α) value will reach the maximum and the corresponding value is the box-counting dimensionD(0).
S. Xie et al.: Assessing microstructures of pyrrhotites in basalts by multifractal analysis 323
Table 2. AverageDAP values of the pyrrhotite particles from the seven basalt samples.
1 2 3 4 5 6 7
DAP 1.3576 1.2591 1.5639 1.3632 1.3414 1.4878 1.3035
et al., 2010).
In homogeneous structures, Dq are close to one another, whereas for a monofractal structure
they are equal. A difference, w=D(-10)-D(10), was defined as the width of the multifractal spectra
and suggested to be an important predictive parameter (Tarquis et al., 2002). A greater w means a
wider spectrum and a more heterogeneous distribution of the spatial structures (Muller et al., 1995;
Vidal et al., 2006). In the same way, the widths of the multifractal spectra, w=D(-3)-D(3) and
w=D(0)-D(2), are also defined here to characterize the multifractality of the distribution of the
pyrrohite particles in this study.
The properties of the function of the mass exponentτ(q), have also been found to be useful
for describing multifractality(Cheng, 1999). Represented by τ″(1)=τ(2)-2τ(1)+τ(0), the
multifractality index (MI) is calculated and proved to be associated with spatial analysis parameters (Cheng, 1999).
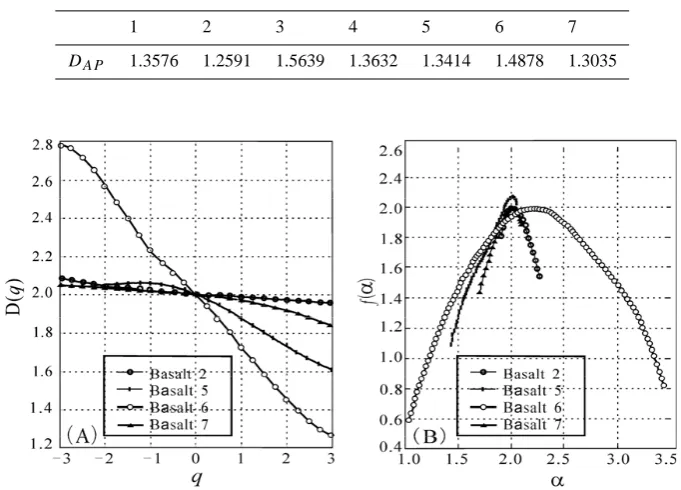
Fig.3. Multifractal analysis results. (a) Estimation of the spectra of generalized fractal dimensions when -3<q<3
for the mineral distribution patterns in the thin sections from the basalt samples of the second, the fifth, the sixth and the seventh segment, respectively. The D(q) in the calculated spectra have been obtained with regression fits where the determination coefficient R2 is higher than 0.955. (
b) Multifractal spectra for the spatial distribution
patterns of pyrrhotite particles.
For each image of the studied metallic mineral particles, we calculate the multifractal
parameters of all the mineral particles with q ranging from -3 to 3 in increments of 0.2 to construct
the partition function χq(δ). With standard errors less than 0.075, Fig.3a shows correlation
coefficients and is the plot of the generalized fractal dimensions D(q) vs the moment q for the
images from Segment 2, 5, 6 and 7, respectively. It can be seen clearly that all the D(q)-q plots are
relatively smooth, with some fluctuating while others are constrained to a limited range. Fig.3b is the multifractal spectrum curves for the pyrrhotite particles at microscales in basalt samples. It shows that the multifractal spectrum curves are continuous and fluctuate in a relatively broad range, which presents the inhomogeneous distribution patterns of the pyrrhotite particles.
Eight fractal and multifractal parameters have been calculated to characterize the spatial
7
Fig. 3. Multifractal analysis results. (a) Estimation of the spectra of generalized fractal dimensions when−3< q <3 for the mineral distribution patterns in the thin sections from the basalt samples of the second, the fifth, the sixth and the seventh segment, respectively. TheD(q)in the calculated spectra have been obtained with regression fits where the determination coefficientR2is higher than 0.955. (b) Multifractal spectra for the spatial distribution patterns of pyrrhotite particles.
andτ(q) (Tarquis et al., 2006; Vidal et al., 2008; Cheng, 1999; Xie et al., 2010b).
In homogeneous structures,Dq are close to one another, whereas for a monofractal structure they are equal. A dif-ference, w=D(−10)−D(10), was defined as the width of the multifractal spectra and suggested to be an impor-tant predictive parameter (Tarquis et al., 2006). A greater
wmeans a wider spectrum and a more heterogeneous distri-bution of the spatial structures (Muller et al., 1995; Vidal et al., 2006). In the same way, the widths of the multifractal spectra,w=D(−3)−D(3)andw=D(0)−D(2), are also defined here to characterize the multifractality of the distri-bution of the pyrrohite particles in this study.
The properties of the function of the mass exponentτ(q), have also been found to be useful for describing multifractal-ity (Cheng, 1999). Represented byτ”(1)=τ (2)−2τ (1)+
τ (0), the multifractality index (MI) is calculated and proved to be associated with spatial analysis parameters (Cheng, 1999).
For each image of the studied metallic mineral particles, we calculate the multifractal parameters of all the mineral particles withqranging from−3 to 3 in increments of 0.2 to construct the partition functionχq(δ). With standard errors
less than 0.075, Fig. 3a is the plot of the generalized frac-tal dimensionsD(q)vs the momentq for the images from Segment 2, 5, 6 and 7, respectively. It can be seen clearly
that all theD(q)−q plots are relatively smooth, with some fluctuating while others are constrained to a limited range.
Figure 3b is the multifractal spectrum curves for the pyrrhotite particles at microscales in basalt samples. It shows that the multifractal spectrum curves are continuous and fluc-tuate in a relatively broad range, which presents the inhomo-geneous distribution patterns of the pyrrhotite particles.
Eight fractal and multifractal parameters have been calcu-lated to characterize the spatial distribution patterns of the pyrrhotites for all the 28 basalt digital images and the aver-age values for each basalt segment have been listed in Ta-ble 3. These parameters shown in TaTa-ble 3 can discern the spatial invariance of the pyrrhotite particles. It is clearly ob-served thatD(0) > D(1) > D(2), which implies that the dis-tribution patterns of the pyrrhotite particles have a tendency to multifractality (Vidal et al., 2008). As Table 3 shows, for Segment 2, the values of the information dimension D(1)
324 S. Xie et al.: Assessing microstructures of pyrrhotites in basalts by multifractal analysis
Table 3. Multifractal parameters for characterizing the spatial structures of the pyrrhotite particles’ areas.
Basalt segment 1 2 3 4 5 6 7
D(−3) 2.1198 2.0552 2.2328 2.1240 2.0556 2.2419 2.0996
D(3) 1.6896 1.8723 1.3596 1.5728 1.7988 1.6711 1.8093
D(0) 2.0000 2.0000 2.0000 2.0000 2.0000 2.0000 2.0000
D(1) 1.8906 1.9527 1.7984 1.8578 1.9497 1.9068 1.9546
D(2) 1.7657 1.9036 1.5499 1.6889 1.8807 1.7916 1.8993
1(D(0)−D(2)) 0.2343 0.0964 0.4501 0.3111 0.1193 0.2084 0.1007
1(D(−3)−D(3)) 0.4301 0.1830 0.8732 0.5512 0.2568 0.5708 0.2903
Multifractality −0.1808 −0.0783 −0.3666 −0.2460 −0.1143 −0.2009 −0.1186
Zr/4 Y
Nb*2
AI
AII
B
C
D
Fig. 4. Discrimination
type MORB; D = Nb-Zr-Y diagram (Meschede, 1986) for basalts from the four segments.
(AI, AII = fields of intraplate alkali basalts; AII, C = fields of intraplate tholeiites; B = field of P-field of N-type MORB; C, D = P-fields of volcanic arc basalts.)
0.1 1.0 10.0 100.0 1000.0 10000.0
La C e Pr Nd S m Eu Gd Tb Dy Ho Er Tm Yb Lu
Ro
c
k
/C
ho
n
d
r
it
e
S 201-3 S 201-4 S 201-9 S 201-10 S 201-11
Fig. 5. Chondrite-normalized REE distribution patterns
Fig. 5 does show th s. It can be seen that all
the s
(Normalizing values from Sun and Mc Donough(1989)) e Chondrite-normalized REE distribution pattern
amples show slightly sloping chondrite-normalized REE patterns, rich in light rare earth elements (LREE, La-Sm) but depleted in heavy rare earth elements (HREE, Eu-Lu), with ((La)N/(Yb)N values ranging from 7.1 to 21.5. Samples 201-4 and 201-11 have weakly negative Eu
anomalies. The REE distribution patterns of samples 201-3 and 201-4 are similar to each other and their total REE contents are 1883.38ppb and 1973.74ppb, respectively, and higher than those of other samples raging from 118.17 to167.92ppb.
Fig. 4. Discrimination Nb-Zr-Y diagram (Meschede, 1986) for
basalts from the four segments. (AI, AII = fields of intraplate alkali basalts; AII, C = fields of intraplate tholeiites; B = field of P-type MORB; D = field of N-type MORB; C, D = fields of volcanic arc basalts.)
5 Petrological trace element analysis
The concentrations analyzed by LA-ICP-MS in Table 4 are used to test the petrological characteristics of these samples in an attempt to demonstrate the difference exists in the spa-tial microstructure.
Firstly, high field strength elements (HFSEs) and rare earth elements (REEs), which are relatively immobile un-der altered and metamorphosed conditions, are used herein for distinguishing samples into tectonic settings. As shown in Fig. 4, the discrimination Nb-Zr-Y diagram (Meschede, 1986) reflects well that all the five samples fall into the field of intraplate alkali basalts, which shows that these samples originate from similar tectonic sources. It should be noted that there seems to be only four dots in Fig. 4. Actually, the dots representing Sample 201-3 and Sample 201-4 are close to each other.
Zr/4 Y
Nb*2
AI
AII
B
C D
Fig. 4. Discrimination
type MORB; D = Nb-Zr-Y diagram (Meschede, 1986) for basalts from the four segments.
(AI, AII = fields of intraplate alkali basalts; AII, C = fields of intraplate tholeiites; B = field of P-field of N-type MORB; C, D = P-fields of volcanic arc basalts.)
0.1 1.0 10.0 100.0 1000.0 10000.0
La C e Pr Nd S m Eu Gd Tb Dy Ho Er Tm Yb Lu
Ro
c
k
/C
ho
n
d
r
it
e
S 201-3 S 201-4 S 201-9 S 201-10 S 201-11
Fig. 5. Chondrite-normalized REE distribution patterns
Fig. 5 does show th s. It can be seen that all
the s
(Normalizing values from Sun and Mc Donough(1989)) e Chondrite-normalized REE distribution pattern
amples show slightly sloping chondrite-normalized REE patterns, rich in light rare earth elements (LREE, La-Sm) but depleted in heavy rare earth elements (HREE, Eu-Lu), with ((La)N/(Yb)N values ranging from 7.1 to 21.5. Samples 201-4 and 201-11 have weakly negative Eu anomalies. The REE distribution patterns of samples 201-3 and 201-4 are similar to each other and their total REE contents are 1883.38ppb and 1973.74ppb, respectively, and higher than those of other samples raging from 118.17 to167.92ppb.
10
Fig. 5. Chondrite-normalized REE distribution patterns.
(Normal-izing values from Sun and Mc Donough, 1989.)
Figure 5 does show the Chondrite-normalized REE dis-tribution patterns. It can be seen that all the samples show slightly sloping chondrite-normalized REE patterns, rich in light rare earth elements (LREE, La-Sm) but de-pleted in heavy rare earth elements (HREE, Eu-Lu), with ((La)N/(Yb)Nvalues ranging from 7.1 to 21.5. Samples
201-4 and 201-11 have weakly negative Eu anomalies. The REE distribution patterns of samples 201-3 and 201-4 are similar to each other and their total REE contents are 1883.38 ppb and 1973.74 ppb, respectively, and higher than those of other samples raging from 118.17 to167.92 ppb.
Figure 6 is the spider diagram of primitive mantle-normalized trace element concentrations. In Fig. 6, both the samples 201-3 and 201-4 show identical patterns with incompatible elements enriched, but high field strength el-ements (HFSEs, U and Th) and heavy rare earth elel-ements (HREE, Eu-Lu) of these two samples are relatively depleted. However, the samples 201-9, 201-10 and 201-11 are different from the above two samples.
In this aspect, the geochemical characteristics of the basalt samples from Segment 2 are quite different from those from Segments 5, 6 and 7. For the samples from Segment 5, 6 and 7, the basalts are relatively enriched with large ion lithophile elements (Rb, Sr, Pb) and HFSEs (U and Th), and show strong negative Ba and positive Pb anomalies, indicating an
S. Xie et al.: Assessing microstructures of pyrrhotites in basalts by multifractal analysis 325
0.1 1.0 10.0 100.0 1000.0 10000.0
Rb Ba Th U Nb Ta La Ce Pb Pr Sr Nd Zr Hf Sm Eu Gd Tb Dy Y Ho Er Tm Yb Lu
Ro
c
k
/P
r
im
it
iv
e
M
a
n
tl
e
S201-3 S201-4 S201-9 S201-10 S201-11
Fig. 6. Spider diagrams of Primitive mantle-normalized trace element concentrations
Fig. 6 is the spider ent concentrations. In Fig.6,
of the basalt samples from Segment 2 are quite
Conclusions
rent basalt samples from different segments in Gejiu area to make thin sections,
evel exhibit fractal and
rocks from different origins may have different micro-structures, which could result (Normalizing values from Sun and Mc Donough(1989))
diagram of primitive mantle-normalized trace elem
both the samples 201-3 and 201-4 show identical patterns with incompatible elements enriched, but high field strength elements (HFSEs, U and Th) and heavy rare earth elements (HREE, Eu-Lu) of these two samples are relatively depleted. However, the samples 201-9, 201-10 and 201-11 are different from the above two samples.
In this aspect, the geochemical characteristics
different from those from Segments 5, 6 and 7. For the samples from Segment 5, 6 and 7, the basalts are relatively enriched with large ion lithophile elements (Rb, Sr, Pb) and HFSEs (U and Th), and show strong negative Ba and positive Pb anomalies, indicating an affinity with continental crust. But for the basalt samples of Segment 2, neither are the Ba anomalies negative on the spider diagrams, nor are the U values enriched in the samples 201-3 and 201-4.
6
We chose diffe
then acquired images under the Environmental Scanning Electron Microscope (ESEM), and measured their basic physical parameters of the pyrrhotite particles. The perimeters and areas of the pyrrhotites were obtained by digital image processing. P-A fractal model and the method of moments were used to inquire the microstructure of the pyrrhotite particles. Together with the bulk-rock trace element analysis, several conclusions can be reached:
(1) For all the basalt samples, the pyrrhotite particles at the microscale l
multifractal behaviors. The P-A fractal analysis shows that the areas and the perimeters of the pyrrhotite particles follow a power-law relationship and the DAP value of the pyrrhotite particles in
the second basalt segment is smaller than those in other basalt segments. The multifractal analysis indicates well that the multifractal parameters of the pyrrhotite particles of the second basalt sample are quite different from other samples, and the multifractality of the spatial distribution patterns of the pyrrhotites at microscales are weaker than those from other basalt segments. The bulk-rock trace element analysis also distinguishes the basalt segment 2 from other basalt segments.
(2) The
11
Fig. 6. Spider diagrams of Primitive mantle-normalized trace
el-ement concentrations. (Normalizing values from Sun and Mc Donough, 1989.)
affinity with continental crust. But for the basalt samples of Segment 2, neither are the Ba anomalies negative on the spi-der diagrams, nor are the U values enriched in the samples 201-3 and 201-4.
6 Conclusions
We chose different basalt samples from different segments in Gejiu area to make thin sections, then acquired im-ages under the Environmental Scanning Electron Microscope (ESEM), and measured their basic physical parameters of the pyrrhotite particles. The perimeters and areas of the pyrrhotites were obtained by digital image processing. P-A fractal model and the method of moments were used to in-quire the microstructure of the pyrrhotite particles. Together with the bulk-rock trace element analysis, several conclu-sions can be reached:
1. For all the basalt samples, the pyrrhotite particles at the microscale level exhibit fractal and multifractal behav-iors. The P-A fractal analysis shows that the areas and the perimeters of the pyrrhotite particles follow a power-law relationship and the DAP value of the pyrrhotite
particles in the second basalt segment is smaller than those in other basalt segments. The multifractal analy-sis indicates well that the multifractal parameters of the pyrrhotite particles of the second basalt sample are quite different from other samples, and the multifractality of the spatial distribution patterns of the pyrrhotites at mi-croscales are weaker than those from other basalt seg-ments. The bulk-rock trace element analysis also distin-guishes the basalt segment 2 from other basalt segments. 2. The rocks from different origins may have different micro-structures, which could result in different mineral structures at the microscale level. In other words, the spatial micro-structural complexity of the mineral parti-cles may be closely related to the inherent microstruc-tures of the wallrocks. In this perspective, fractal and
Table 4. Concentrations (10−9) of the trace elements from the basalt samples.
Element S201-3 S201-4 S201-9 S201-10 S201-11
Be 15.3 21.4 2.58 6.62 3.31
Sc 220 242 15.1 15.7 13.7
V 2292 2596 199 192 213
Cr 2702 1927 218 259 105
Co 513 469 47.3 32.1 52.2
Ni 1543 1091 173 102 92.2
Cu 91.9 74.7 154 75.6 199
Zn 1362 1317 132 130 229
Ga 214 216 18.0 19.9 24.8
Rb 1134 934 87.0 89.0 405
Sr 5915 6843 713 1004 553
Y 252 287 20.0 21.3 18.4
Zr 2334 2712 165 216 197
Nb 398 470 21.3 25.9 36.9
Sn 79.1 104 223 416 228
Cs 1017 696 64.2 65.2 94.8
Ba 4335 4447 45.9 62.5 174
La 376 371 20.6 27.3 34.5
Ce 732 771 44.2 55.0 67.6
Pr 89.0 95.7 5.65 6.73 7.98
Nd 381 407 25.0 28.9 33.6
Sm 80.9 87.1 5.88 6.42 6.97
Eu 25.5 23.4 1.87 2.12 2.06
Gd 71.4 78.2 5.36 5.75 6.16
Tb 10.5 11.8 0.82 0.88 0.87
Dy 56.2 62.6 4.34 4.67 4.31
Ho 9.81 10.8 0.74 0.81 0.69
Er 25.4 27.9 1.93 2.06 1.67
Tm 3.36 3.51 0.25 0.28 0.20
Yb 19.4 21.3 1.45 1.58 1.15
Lu 2.82 3.18 0.21 0.24 0.16
Hf 57.1 66.4 4.06 5.35 4.73
Ta 26.6 29.9 1.44 1.89 2.47
Tl 28.3 30.5 0.76 0.57 3.94
Pb 105 338 1021 13.8 21.4
Th 40.1 41.9 2.25 3.27 2.85
U 8.42 6.09 0.94 1.09 0.94
multifractal may provide new information on the gene-sis conditions of ore crystals since different genetic con-ditions could result in different spatial structures of min-erals in space.
Acknowledgements. This research has been financially supported
326 S. Xie et al.: Assessing microstructures of pyrrhotites in basalts by multifractal analysis
been supported with the help of Tin-company in Yunnan Province, China. The concentrations of trace elements were measured in the state key lab of Geological Processes and Mineral Resources at China University of Geosciences with the help of Y. Liu.
Edited by: S. Lovejoy
Reviewed by: F. Agterberg and two other anonymous referees
.
References
Agterberg, F. P., Cheng, Q., Brown, A., and Good, D.: Multifractal modeling of fractures in the Lac du Bonnet Batholith, Manitoba, Computers and Geosciences, 22(5), 497–507, 1996.
Bird, N., Diaz, C. M., Saa, A., and Tarquis, M.: Fractal and mul-tifractal analysis of pore-scale images of soil, J. Hydrol., 322, 211–219, 2006.
Cheng, Q., Agterberg, F. P., and Ballantyne, S. B.: The separation of geochemical anomalies for background by fractal methods, Journal of Geochemical Exploration, 51, 109–130, 1994. Cheng, Q.: The perimeter-Area Fractal Model and Its Application
to Geology, Mathematical Geology, 27, 69–82, 1995.
Cheng, Q.: Multifractality and spatial statistics, Computers and Geosciences, 25(9), 949–961, 1999.
Cheng, Q.: Mapping singularities with stream sediment geochemi-cal data for prediction of undiscovered mineral deposits in Gejiu, Yunnan Province, China, Ore Geology Reviews, 32(1–2), 314– 324, 2007.
Evertsz, C. J. G. and Mandelbrot, B. B.: Multifractal measures (Ap-pendix B) [A]. In: Peitgen H-O, Jurgens H, Saupe D, eds. Chaos and fractals[C]. New York: Springer Verlag, 922–953, 1992. Flavio, S. A., Stefan, L., and Gregor, P. E.: Quantitative
Character-ization of Carbonate Pore Systems By Digital Image Analysis, AAPG Bulletin, 82(10), 1815–1836, 1998.
Gerard, R. E., Philipson, C. A., Manni, F. M., and Marshall, D. M.: Petrographic image analysis: and alternate method for determin-ing petrophysical properties, in: Automated pattern analysis in petroleum exploration: New York, edited by: Palaz, I. and Sen-gupta, S. K., Springer Verlag, 249–263, 1992.
Hakon, W.: Volume, Shape, and Roundness of Rock Particles, J. Geol., 40(5), 443–451, 1932.
Halsey, T. C., Jensen, M. H., and Kadanoff, L. P.: Fractal measures and their singularities – the characterization of strange sets. Phys-ical Review A 33(2), 1141–1151, 1986.
Krohn, C. E. and Thompson, A. H., Fractal sandstone pores: Au-tomated measurements using scanning-electron-microscope im-ages. Phys. Rev. B, 33, 6366–6374, 1986.
Li, Y., Qin, D., and Dang, Y.: Lithological Features of Basalt in Gejiu Eastern Area, Yunnan Province, Sci. Technol. Rev., 24(2), 70–72, 2006.
Li, Y., Qin, D., Dang, Y., Hong, T., and Yan, Y.: The distribu-tion of the Indo-Chinese basalts in time and space in the eastern Gejiu, Journal of Chengdu university of Technology, 34(1), 23– 28, 2007.
Liu, Y., Hu, Z., Gao, S., G¨unther, D., Xu, J., Gao, C., and Chen, H.: In situ analysis of major and trace elements of anhydrous minerals by LA-ICP-MS without applying an internal standard, Chemical Geology, 257, 34–43, 2008.
Lovejoy, S.: Area–perimeter relation for rain and cloud areas, Sci-ence, 216(4542):185–187, 1982.
Mandelbrot, B. B.: Fractals: form, chance, and dimension, Free-man, San Francisco, 1977.
Mandelbrot, B. B.: The fractal geometry of nature (updated and augmented edition), Freeman, New York, 1983.
McCauley, J. L.: Models of permeability and conductivity of porous media, Physica A, 187, 18–54,1992.
Meschede, M.: A method of discriminating between different types of mid-ocean ridge basalts and continental tholeiite with the Nb-Zr-Y diagram, Chemical Geology, 56, 207–218, 1986.
Muller, J. and McCauley, J. L.: Implication of fractal geometry for fluid flow properties of sedimentary rocks. Transp. Porous Me-dia, 8, 133–147, 1992.
Muller, J., Huseby K. O., and Saucier A.: Influence of Multifractal scaling of pore geometry on permeabilities of sedimentary rocks. Chaos, Solitons and Fractals, 5(8), 1485–1492, 1995.
Muller, J.: Characterization of pore space in chalk by multifractal analysis, J. Hydrol., 187, 215–222, 1996.
Pachepsky, Y., Crawford, J. W., and Rawls W. J.: Fractals in soil science: Developments in Soil Science, Elsevier Science, Ams-terdam, Hardbound, 2000.
Perrier, E., Bird, N., and Rieu, M.: Generalizing the fractal model of soil structure: the pore-solid fractal approach, Geoderma, 88(3– 4), 137–164, 1999.
Sun, S. S. and McDonough, W. F.: Chemical and isotopic systemat-ics of oceanic basalts: implications for mantle composition and processes, in: Magmatism in Ocean Basins, edited by: Saunders, A. D. and Norry, M. J., Geol. Soc. Spec. Publ., London, 313–345, 1989.
Tarquis, A. M., McInnes, K. J., Key, J. R., Saa, A., Garc´ıa, M. R., and D´ıaz, M. C.: Multiscaling analysis in a structured clay soil using 2D images, J. Hydrol., 322(1–4), 236–246, 2006. Vidal V´azquez, E., Garc´ıa Moreno, R., Miranda, J. G. V., D´ıaz,
M. C., Sa ´Requejo, A., Paz Ferreiro, J., and Tarquis, A. M.: As-sessing soil surface roughness decay during simulated rainfall by multifractal analysis, Nonlin. Processes Geophys., 15, 457–468, doi:10.5194/npg-15-457-2008, 2008.
Wadell, H.: Volume, shape and roundness of rock particles, J. Geol., 40, 443–451, 1932.
Wang, Z., Cheng, Q., and Xia, Q.: The P-A fractal model character-izing microstructure of minerals, Proceedings of IAMG’05: GIS and Spatial Analysis, 317–322, 2005.
Wang, Z.: GIS-Based Fractal/multifractal modeling of texture in mylonites and banded sphalerite ores, Ph.D dissertation in the Department of Earth and Space Science and Engineering, York University, Canada, 2008.
Xie, S., Cheng, Q., Li, Z., Xing, X., and Chen, S.: Assessing Microstructures of Ore-minerals by multifractal, Earth Science – Journal of China University of Geosciences, 34(2), 263–269, 2009.
Xie, S., Cheng, Q., Ling, Q., Li, B., Bao, Z., and Fan, P.: Fractal and Multifractal Analysis of Carbonate Pore-scale Digital Images of Petroleum Reservoirs, Marine and Petroleum Geology, 27, 476– 485, 2010a.
S. Xie et al.: Assessing microstructures of pyrrhotites in basalts by multifractal analysis 327
Yu, C. W., Tang Y. J., and Shi P. F.: The Dynamic System of Poly-metallic Metallogenic Province in Gejiu, Yunnan , Wuhan: Pub-lishing House of China University of Geosciences, 394, 394 pp., 1988.
Zhang, Z., Mao, H., and Cheng, Q.: Fractal Geometry of Element Distribution on Mineral Surfaces, Mathematical Geology, 33(2), 217–228, 2001.
Zhijun Chen, Qiuming Cheng, Jiaoguo Chen, and Shuyun Xie: A novel iterative approach for mapping local singularities from geochemical data, Nonlin. Processes Geophys., 14, 317–324, doi:10.5194/npg-14-317-2007, 2007.