www.atmos-meas-tech.net/6/3211/2013/ doi:10.5194/amt-6-3211-2013
© Author(s) 2013. CC Attribution 3.0 License.
Atmospheric
Measurement
Techniques
High-resolution chemical ionization mass spectrometry
(ToF-CIMS): application to study SOA composition and processing
D. Aljawhary, A. K. Y. Lee, and J. P. D. Abbatt
Department of Chemistry, University of Toronto, Toronto, ON CM5S 3H6, Canada
Correspondence to: J. P. D. Abbatt ([email protected])
Received: 24 May 2013 – Published in Atmos. Meas. Tech. Discuss.: 4 July 2013 Revised: 14 October 2013 – Accepted: 21 October 2013 – Published: 26 November 2013
Abstract. This paper demonstrates the capabilities of
chem-ical ionization mass spectrometry (CIMS) to study sec-ondary organic aerosol (SOA) composition with a high-resolution (HR) time-of-flight mass analyzer (aerosol-ToF-CIMS). In particular, by studying aqueous oxidation of water-soluble organic compounds (WSOC) extracted from
α-pinene ozonolysis SOA, we assess the capabilities of three common CIMS reagent ions: (a) protonated water clusters (H2O)nH+, (b) acetate CH3C(O)O− and (c) iodide water
clusters I(H2O)−n to monitor SOA composition. Furthermore, we report the relative sensitivity of these reagent ions to a wide range of common organic aerosol constituents. We find that (H2O)nH+ is more selective to the detection of less oxidized species, so that the range of O / C and OSC
(carbon oxidation state) in the SOA spectra is considerably lower than those measured using CH3C(O)O−and I(H2O)−n. Specifically, (H2O)nH+ ionizes organic compounds with OSC≤1.3, whereas CH3C(O)O−and I(H2O)−n both ionize highly oxygenated organics with OSCup to 4 with I(H2O)−n being more selective towards multi-functional organic com-pounds. In the bulk O / C and H / C space (in a Van Krevelen plot), there is a remarkable agreement in both absolute mag-nitude and oxidation trajectory between ToF-CIMS data and those from a high-resolution aerosol mass spectrometer (HR-AMS). Despite not using a sensitivity-weighted response for the ToF-CIMS data, the CIMS approach appears to cap-ture much of the chemical change occurring. As demon-strated by the calibration experiments with standards, this is likely because there is not a large variability in sensitivities from one highly oxygenated species to another, particularly for the CH3C(O)O− and I(H2O)−n reagent ions. Finally, the data illustrate the capability of aerosol-ToF-CIMS to mon-itor specific chemical change, including the fragmentation
and functionalization reactions that occur during organic ox-idation, and the oxidative conversion of dimeric SOA species into monomers. Overall, aerosol-ToF-CIMS is a valuable, se-lective complement to some common SOA characterization methods, such as AMS and spectroscopic techniques. Both laboratory and ambient SOA samples can be analyzed using the techniques illustrated in the paper.
1 Introduction
Organic compounds comprise an important subset of atmo-spheric constituents and can exist in all atmoatmo-spheric phases (i.e. gas, particle and aqueous). It is known that organics play important roles in determining the abundance of atmo-spheric oxidants and influencing the properties of suspended particles and aqueous droplets, affecting climate and human health (Hallquist et al., 2009; Ervens et al., 2011). Global-scale measurements of aerosol particles have assigned 20– 90 % of sub-micron aerosol mass to be organic (Zhang et al., 2007; Jimenez et al., 2009), with much of this material sec-ondary in nature (i.e. Secsec-ondary Organic Aerosol or SOA) having been formed in the atmosphere through the conden-sation of oxidation products of volatile precursors or from in-cloud oxidation processes (Kanakidou et al., 2005; Hal-lquist et al., 2009; De Gouw and Jimenez, 2009; Ervens et al., 2011). There are thought to be hundreds to thousands of or-ganic compounds within SOA, which may undergo chemical processing in the atmosphere after condensation (Hamilton et al., 2004).
of condensed phase organic species and to assist in under-standing their transformations, sources and sinks (Duarte and Duarte, 2011; Laskin et al., 2012; Pratt and Prather, 2012a, b). Such techniques can vary in sensitivity, specificity, and time response. The ability of such techniques to be de-ployed in the field is highly desirable because a comprehen-sive understanding of organic processing requires both lab and complimentary field measurements.
Mass spectrometry is increasingly being applied for mea-surement of condensed phase atmospheric organics because it has the potential to provide quantitative chemical formula information with very high sensitivity. Approaches vary via their means of vaporizing the constituents, in their ioniza-tion methods and in the mass analyzers employed. Widely used instruments are the aerodyne aerosol mass spectrome-ter (AMS), which is based on electron ionization (EI) with flash vaporization at 600◦C, and single-particle approaches that use lasers for both particle vaporization and/or ionization (Murphy and Thomson, 1995; Gard et al., 1997; Canagaratna et al., 2007; Onasch et al., 2012). AMS instruments are field deployable and have emerged as a very powerful tool to study PM (Canagaratna et al., 2007; Zhang et al., 2007; Jimenez et al., 2009) and more recently fog and cloud droplets (Ge et al., 2012; Lee et al., 2012). The attraction of the AMS is the ability to derive quantitative information of inorganic and or-ganic constituents in an on-line manner. While measurements from the AMS have substantially improved the understand-ing of PM evolution in the atmosphere, much molecular in-formation is lost due to significant fragmentation during the hard ionization by EI.
Electrospray ionization mass spectrometry (ESI-MS) has been used in several lab and field studies to elucidate the or-ganic aerosol and fog water composition (Altieri et al., 2008; Perri et al., 2009; Tan et al., 2009, 2010; Lim et al., 2010; Mazzoleni et al., 2010; Schmitt-Kopplin et al., 2010; Kundu et al., 2012). The advantage of ESI-MS is the soft ioniza-tion of ESI, in which the analyte ion stays intact; as well, the sample is not heated before ionization. Also, ESI-MS instru-ments are sometimes equipped with high-resolution Fourier transform ion cyclotron mass spectrometer (FTICR-MS) and other high-resolution instruments, by which molecular level information for individual species can be drawn from very complex samples (Laskin et al., 2012, 2013). The application of ESI-MS in aerosol research has substantially improved the understanding of aerosol evolution and processing in the at-mosphere (Perri et al., 2009; Tan et al., 2009, 2010; Laskin et al., 2012, 2013). However, in this technique the sample must be mixed with a solvent that is required to induce ioniza-tion, which might lead to unwanted bulk reactions between the analyte and the solvent (Bateman et al., 2008). Most im-portantly, ESI-(FTICR)-MS instruments are not yet field de-ployable for on-line measurements.
While the technique of chemical ionization mass spec-trometry (CIMS) has been used in atmospheric chemistry for decades for gas phase measurements, it has only now being
applied to the study of organic processing that takes place in atmospheric cloud-, fog-, and rain-water, and particles (Thornton et al., 2003; Hearn and Smith, 2004; Thornton and Abbatt, 2005; Sareen et al., 2010; Ervens et al., 2011; Zhao et al., 2012). An advantage of the CIMS over other mass spec-trometry techniques is its ability to use a variety of reagent ions that induce the chemical ionization in order to selec-tively detect certain classes of organic compounds of interest. For instance, protonated water clusters (H2O)nH+have been used for the detection of oxygen, nitrogen and sulfur con-taining organic compounds for decades (Sunner et al., 1988; Lindinger et al., 1998). Iodide water cluster I(H2O)−n reagent ions have been employed in several lab and field studies that targeted oxygenated organic compounds and nitrogenous in-organic species such as N2O5and ClNO2 (Caldwell et al.,
1989; Bertram et al., 2009; Kercher et al., 2009; Yatavelli and Thornton, 2010; Le Breton et al., 2012). In addition, the use of acetate reagent ions has recently been emphasized for the detection of organic, halo-organic (e.g. trichloroacetic acid), inorganic acids (e.g. HCl, HNO3and H2SO4)as well
as nitrophenols (Veres et al., 2008). Gas phase H2SO4and its
neutral ambient clusters have also been detected with CIMS using nitrate reagent ions (Mauldin et al., 1999; Kurtén et al., 2011; Jokinen et al., 2012). Aside from the reagent ions versatility, chemical ionization is a relatively soft ionization technique and thus the analyte ion is often not fragmented. This is important if information at the molecular level is de-sired, such as in mechanistic and kinetic studies. However, as the sample composition becomes more complex, the low resolution quadrupole mass analyzer used previously with CIMS instruments becomes inadequate to resolve the whole organic composition (Hearn and Smith, 2006), and higher resolution instruments are preferred.
Aerosol studies utilizing the CIMS rely on thermal des-orption to volatilize the organic constituents of the parti-cles, since these organics are of low volatility. For instance, a multi-orifice volatilization impactor (MOVI) has recently been developed as an interface to CIMS instruments, which allows for on-line separation of gas and particle phase or-ganics (Yatavelli and Thornton, 2010; Yatavelli et al., 2012). While particles are collected on the MOVI, gaseous species are detected by the CIMS. After particle collection ends, the impactor is heated gradually and organics volatilize off de-pending on their vapour pressures. Thus, it can also pro-vide vapour pressure information of the species being ana-lyzed. Another interface that has been previously employed in aerosol studies is the aerosol-CIMS (or thermal desorption CIMS, TD-CIMS) (Hearn and Smith, 2004, 2006; Sareen et al., 2010; Zhao et al., 2012). The aerosol-CIMS can detect both gas and particle phase constituents simultaneously on-line by introducing a heated inlet to volatilize particle phase components.
the water-soluble organic compounds (WSOC) ofα-pinene ozonolysis SOA. We treat this complex organic mixture and its subsequent aqueous photo-oxidation components as mod-els to highlight the capabilities of high-resolution aerosol-ToF-CIMS to study organic aerosol composition and pro-cessing. While this study focuses on the aqueous phase chemistry of organics, the technique and the approach dis-cussed here can be pursued in other reaction systems and phases (i.e. gas and heterogeneous phases). We illustrate how a comprehensive analysis can be achieved by choos-ing the ToF-CIMS reagent ions to selectively ionize certain classes of organic compounds within the WSOC SOA. In particular, three reagent ions: (1) protonated water clusters (H2O)nH+, (2) acetate anions, CH3C(O)O−and (3) iodide
water cluster I(H2O)−n ions were used to explore their selec-tivity for the same change in chemical composition occurring during WSOC photo-oxidation. The results are presented as oxygen-to-carbon atomic ratios (O / C), hydrogen-to-carbon atomic ratios (H / C), carbon oxidation state (OSC) and
num-bers of carbon atoms (#C) distributions over the course of aqueous phase oxidation for the three reagent ions. For refer-ence, we compare the data to those simultaneously obtained with high-resolution AMS. Furthermore, we illustrate that different chemical classes, corresponding to monomers and dimers of theα-pinene oxidation products, were observed for the WSOC in all the three reagent ions ToF-CIMS spectra. The differing rates of oxidation of the monomer and dimer species illustrate how aerosol-ToF-CIMS can be utilized to study chemical change within a chemically complex matrix. The detailed mechanistic interpretation of the oxidative evo-lution of the hundreds of peaks within the aerosol-ToF-CIMS spectra, along with selected kinetics studies of major con-stituents, will be presented in a subsequent publication.
2 Experimental
The experiments were carried out in the following sequence: (1) SOA generation and collection, (2) aqueous phase oxidation of WSOC and (3) on-line detection of photo-oxidation products using high-resolution ToF-CIMS and AMS (Aerodyne Inc.).
2.1 SOA generation and collection
The reaction of ozone withα-pinene was used to generate SOA in a continuous manner in the University of Toronto Mobile Oxidation, Concentration and Aging (MOCA) cham-ber (i.e. FEP Teflon bag, 1 m3volume). An OH radical scav-enger was not added and as a resultα-pinene was oxidized by both ozone and OH, and no seed aerosol was employed. The experimental set-up is illustrated in Fig. 1. The cham-ber was run in the dark at room temperature and pressure. Dry (RH∼< 5 %), purified, hydrocarbon free air, from a pure air generator (Model 737, AADCO), was the carrier
Fig. 1. Experimental set-up used to run a 1 m3MOCA chamber in continuous mode to generate SOA by the gas phase ozonolysis of
α-pinene. Air flowing into and out of the chamber was controlled by mass flow controllers. Instruments connected to the outlet of the chamber were used to monitor gas phase and particle concentra-tions.
gas and flowed continuously into the chamber before the reagents were introduced. All flows were controlled using mass flow controllers (MKS). Ozone was generated by pass-ing 0.1 LPM (Liter per minute) of purified air over a mercury lamp.α-Pinene (Aldrich, > 99 %) was injected continuously in 1 LPM of air using a 25 µL syringe (Hamilton) mounted on a syringe pump (Harvard Apparatus, Pump11 Elite) at a rate of 0.1 µL min−1. In order to reduce the concentration ofα-pinene in the chamber, 0.1 LPM of the air carryingα -pinene was introduced in the chamber while the rest flowed to the exhaust. A needle valve was placed on the exhaust line to ensure sufficient pressure was present to allow 0.1 LPM
α-pinene flow into the chamber (see Fig. 1). Make-up air of 10.5 LPM was added in order to dilute the reagents and to give a residence time of∼1.6 h in the chamber. A pump was connected to the chamber outlet to pull 8.9 LPM of air through an O3denuder to remove part of the ozone.
An ozone analyzer (model 49i, Thermo scientific) was used to monitor the O3 concentration in the chamber, α
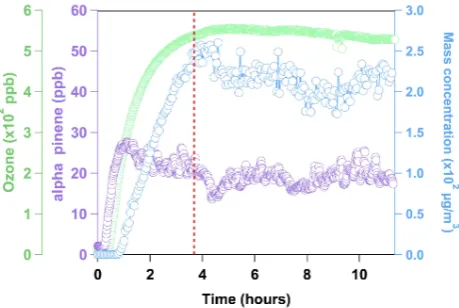
-pinene concentration was monitored with a Proton Transfer Reaction-Mass Spectrometer (PTR-MS, Ionicon) by follow-ingm/z137 and 81, and the SOA size distribution was mea-sured using a TSI Scanning Mobility Particle Sizer (SMPS, 3081 Differential Mobility Analyzer (DMA), 3025A Con-densation Particle Counter (CPC)). Typical time profiles for the reagents and SOA mass loading (assuming a density of 1.2 g mL−1) are shown in Fig. 2. When the reagents and
Fig. 2. Time profiles of O3,α-pinene and SOA mass loading
evo-lution in the MOCA chamber, which was run in continuous mode. Dashed red line indicates when SOA collection began.
The immersed filter was shaken for∼15 min and then left in the freezer at−30◦C.
2.2 Aqueous phase photo-oxidation of WSOC
The aqueous phase photo-oxidation reaction was carried out in a photo-reactor (Rayonet Reactor, RPR-200) equipped with UV-B lamps (RPR-3000, peak emission at 310 nm) mounted in a circular manner such that they are equidis-tant from the centre. A stirring plate and a fan were added to the photo-reactor to ensure adequate solution mixing and cooling, respectively. The aqueous solutions were placed in a glass bottle (Wheaton) in the centre of the photo-reactor, and thus light of wavelengths greater than 300 nm was transmit-ted to the sample. The solution temperature when the lamps were on was 28◦C. Hydrogen peroxide (Sigma-Aldrich, ≥30 % in water, TraceSELECT) was added to the sample such that a 1 mM concentration was present. The aqueous phase OH photo-oxidation was initiated by the photolysis of hydrogen peroxide to form OH. From the decay of species with known rate constants with OH (i.e. cis-pinonic acid), we estimate that the steady state OH concentration is on the order of (1.1±0.1)×10−13M.
Three frozen WSOC solutions were allowed to thaw at room temperature and combined. Purified water (18 mcm, Veolia) was added to make a 200 mL solution of ∼10 µg mL−1SOA mass in water. The 200 mL solution was
divided into 4×50 mL aliquots. To carry out the OH ox-idation a 1×50 mL aliquot was used and 2×50 mL solu-tions were used for photolysis (i.e. no H2O2) and dark (i.e.
H2O2but no light) control experiments, and 1×50 mL was
a backup. A volume of 5.13 µL of hydrogen peroxide was in-jected in the SOA solution to give a concentration of 1 mM. The oxidation was initiated by the irradiation of UV-B lamps. The photo-oxidation and control experiments were allowed
to run for 4 h, where the photo-oxidized sample was exposed to a total of 1.6×10⁻⁹M s−1of OH.
2.3 On-line detection of WSOC and the photo-oxidation products
The WSOC solution was continuously atomized using a TSI constant output atomizer (model 3076). A fraction of the droplets was diluted by a factor of 4 with nitrogen gas (BOC, grade 4.8) or air (Linde, grade 0.1) before entering the high-resolution ToF-CIMS (Aerodyne Inc.) (Fig. 3) for on-line de-tection.
In order to volatilize the organics from the droplets, the diluted flow was heated up to 150◦C by passing it through a 70 cm long Siltek-coated stainless steel tubing (Restek). The tubing was heated by wrapping it with a heating tape (Omega, STH051) and the temperature was controlled us-ing a modified temperature controller (Omega, CN1A-TC). The residence time in the heated line was about 1.4 s. Tem-perature ramping experiments were carried out where the temperature of the line was ramped from 100◦C to 250◦C in steps of 50◦C. The line temperature (of 150◦C) was se-lected such that the signal for the majority of the ions of in-terest was maximized. These observations were consistent with Yatavelli et al. (2012), where the thermogram of α -pinene ozonolysis particle phase showed that the product of
m/z155–357 peaked in signal at temperatures below 150◦C. Approximately 0.8 LPM of the unheated droplet flow was di-luted by air (Linde, grade 0.1) (see Fig. 3) and passed through a diffusion dryer. The flow was then introduced to the HR-AMS (Aerodyne Inc.) and the SMPS (TSI, 3081 DMA, 3776 CPC). A pump was also connected to the manifold down-stream of the dryer in order to reduce the residence time of the droplets in the tubing downstream from the atomizer.
2.3.1 High-resolution ToF-CIMS
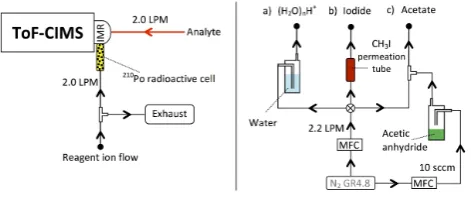
A detailed description of the HR-ToF-CIMS can be found in Bertram et al. (2011) and Yatavelli et al. (2012). The sam-ple flow rate entering the low pressure ion-molecule reaction (IMR) chamber of the ToF-CIMS was set to 2.0 LPM by a critical orifice.
The reagent ions used in this work were protonated water cluster (H2O)nH+, acetate anions CH3C(O)O− and iodide
Fig. 3. The set-up used to run the aqueous phase photo-oxidation
of WSOC. The solution was constantly stirred and atomized in the glass bottle while UV-B light was continuously irradiated for 4 h. The flow carrying the mist from the atomizer was split such that part was introduced to the HR ToF-CIMS and the rest was admitted to the HR-AMS and SMPS. The red line indicates the ToF-CIMS heated inlet (150◦C). MFC refers to mass flow controller.
Fig. 4. The set-up used to operate the ToF-CIMS. Sample flow
was introduced to the IMR through the heated inlet. (H2O)nH+,
I(H2O)−n and acetate reagent ions were generated by passing a
flow of nitrogen gas carrying (a) water (b) methyl iodide and (c) acetic anhydride through a210Po radioactive cell, respectively. One reagent ion was used at a time. Bolded circles indicate points of at-tachment of the reagent ion flows on the right to the manifold on the left. Sccm refers to standard cubic centimeters per minute.
radioactive cell (NRD, Model 2031), at a flow of 2 LPM set by a critical orifice, in order to create the ionization reagent ions(Fig. 4). The analyte ionization took place by the follow-ing chemical ionization reactions:
for protonated water clusters,
(H2O)nH++M−→n(H2O)+MH+; (R1)
for acetate,
CH3C(O)O−+MH−→CH3C(O)OH+M−; (R2)
and for iodide water clusters,
I(H2O)−n+M−→n(H2O)+I(M)−. (R3)
The IMR pressure and temperature were adjusted to 96±1 mbar and 57◦C, respectively. The pressure of the col-lisional dissociation chamber (CDC), the chamber following
the IMR containing the short segmented quadrupoles (SSQ), was controlled to 2.0±0.2 mbar. A nitrogen flow was used to dilute the sample flow in the (H2O)nH+and I(H2O)−n reagent ion experiments (Fig. 3), while a flow of air was used for the dilution in the CH3C(O)O− reagent ion experiments. This
was essential as the acetate reagent ion concentration seemed to be sensitive to the amount of oxygen present.
The fields’ strength within the ToF-CIMS controls the amount of gas phase ion clustering and fragmentation. The ToF-CIMS was operated in weak-field mode during the ex-periments where (H2O)nH+and I(H2O)−n were used as the reagent ions. This is because fragmentation was observed for the sample ions in the (H2O)nH+ experiments when
moderate- to strong-fields were applied. Also, in the I(H2O)−n case, the analyte ion is detected clustering with I−as illus-trated in Reaction (R3) and the weak field ensures that the cluster stays intact to maximize the overall signal. In con-trast, acetate reagent ion experiments were run in strong-field mode, because a mixture of deprotonated analyte (Re-action R2) and analyte clustering with acetate ions were ob-served in weak-field mode. To minimize complexity of ion assignment, a strong-field ensured that the majority of the peaks in the mass spectra followed (Reaction R2). A list of the voltages in the mass spectrometer used to run the ex-periments is given in Table S1. All exex-periments were run in V-mode with the time-of-flight mass spectrometer, and data were acquired at 1 s time resolution and averaged to 5 min using the data analysis software, Tofware 2.2.2 (Aerodyne Inc.). Peak fitting and ion assignment were performed for all peaks in the spectra for the three reagent ions up to molecular weight of 300 u. The mass accuracy for all V-mode exper-iments was ±5 µTh Th−1(ppm). The ToF resolving power
was 4100–4300. More details regarding mass accuracy and resolving power of the mass spectrometer can be found else-where (Bertram et al., 2011; Yatavelli et al., 2012; Jokinen et al., 2012). Data for the three reagent ions were normalized to reagent ion signal and background subtracted.
2.3.2 HR-AMS
2.4 Sensitivity evaluation
To evaluate relative sensitivities of different species, the following organic compounds were used: glyoxal (Sigma, 40 wt. % in H2O), methylglyoxal (Sigma, 40 % in H2O),
formic acid (Sigma, 50 wt. % in H2O), acetic acid (Fisher,
99.9 %), glyoxylic acid (Sigma, 50 wt. % in H2O),
pyru-vic acid (Sigma, 98 %), pinonic acid (Sigma, 98 %), ox-alic acid (Fisher, 99.9 %), malonic acid (Sigma, 99 %), suc-cinic acid (Fisher, 99.7 %), levoglucosan (Sigma, 99 %), citric acid (Sigma, ≥99.5 %) and L-tartaric acid (Fisher, > 99.5 %). Three standard solutions of a combination of the thirteen organic compounds were prepared in purified water (18 mcm). The concentrations of each of the organic com-pounds were 5, 15 and 25 µM. The standard solutions were sampled as illustrated in Fig. 3, with the ToF-CIMS oper-ating with the three reagent ions separately. The sensitivity of each compound was obtained from the slope of the three-point calibration curve.
3 Results and discussion
3.1 ToF-CIMS sensitivity and selectivity evaluation
The sensitivity of 13 organic compounds with known con-centrations in the aqueous phase was assessed using the ToF-CIMS with the three reagent ions. This test was performed in order to evaluate the selectivity of each reagent ion to-wards known organic compounds. The organic compounds were chosen such that a variety of functional groups are pre-sented.
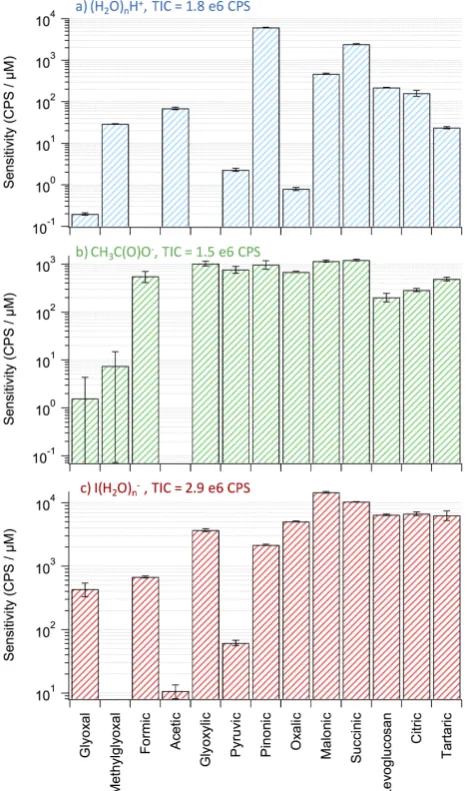
Fig. 5a shows the sensitivities of the 13 compounds us-ing (H2O)nH+ reagent ions. The sensitivities obtained for all compounds are relatively low with the exception of cis-pinonic acid and succinic acid. The proton transfer reaction (Reaction R1) is governed by the gas phase affinity of the or-ganic compounds to protonate. The reaction proceeds if the gas phase basicity of the analyte is higher than that of the wa-ter cluswa-ters, (H2O)n. The reagent cluster ions observed in the spectra were withn=3, 2, 4 listed by descending intensity, although this may not reflect the nature of the cluster distri-bution in the IMR and it is unknown which combination of the water cluster ions ionizes the analyte. The gas phase ba-sicity of the clusters are 730, 694 and 769 kJ mol−1, respec-tively (NIST, 2013). Gas phase basicity data are not avail-able for the majority of the organic compounds, except for formic acid (710 kJ mol−1) and acetic acid (753 kJ mol−1)
(Hunter and Lias, 1998). The gas phase basicity of acetic acid is higher than n=2 and 3 water clusters. However, formic acid gas phase basicity is only higher than that of the n=2 water cluster. Formic acid was not observed in the (H2O)nH+reagent ion spectra at all concentrations, un-like acetic acid. This indicates that the proton transfer reac-tion from (H2O)nH+to formic acid did not proceed. In
ad-Fig. 5. The sensitivity of 13 organic compounds in units of
CPS (counts per second)/µM in solution. The sensitivities were obtained by operating the ToF-CIMS with the three reagent ions (a) (H2O)nH+, giving rise to protonated molecular ions; (b) CH3C(O)O−, giving rise to deprotonated species aside from
levoglucasan which was detected as a cluster with acetate; and
(c) I(H2O)−n, giving rise to clusters with iodide. The error bars
reflect the standard error in the slopes of the 3-point calibration curves. Also, the total ion count (TIC) is shown for each reagent ion.
information regarding other compounds is required before a conclusive understanding can be drawn. It appears from Fig. 5a that all the multi-functional organic compounds have relatively low sensitivities compared to pinonic acid, malonic acid, succinic acid, levoglucosan and citric acid, all of which contain reduced carbons (-CH2-). This illustrates the
selec-tivity of (H2O)nH+reagent ions towards compounds that are not highly oxygenated.
Details about the CH3C(O)O− ionization method can be
found elsewhere (Veres et al., 2008). Ionization takes place if the gas phase acidity of the analyte is higher than that of acetic acid. It has been found that acetic acid has a low gas phase acidity and thus most acids can deprotonate via Re-action (R2) (Veres et al., 2008). The sensitivity of the ToF-CIMS to the organic compounds using acetate reagent ions is shown in Fig. 5b. All acids were detected in the depro-tonated form and all the non-acid bearing compounds were not detected sensitively, with the exception of levoglucosan, which was detected as a cluster with CH3C(O)O−.
Interest-ingly, the majority of the acids have more uniform sensitivi-ties, with less than a factor of 4 difference, when compared to Fig. 5a and c. In addition, small compounds such as formic, glyoxylic and pyruvic acids (C < 3) and large organic acid compounds show similar sensitivities. The results demon-strate that CH3C(O)O−reagent ions are selective to acids in
general, in accord with the work of Veres et al. (2008). How-ever, compounds with non-acid functionality (e.g. levoglu-cosan) can also be observed clustering with CH3C(O)O−.
I(H2O)−n reagent ions data are shown in Fig. 5c. The ion-ization by Reaction (R3) has been described earlier (Cald-well and Kebarle, 1984) and used extensively in atmospheric studies (Thornton and Abbatt, 2005; Zhao et al., 2012). The ionization depends on the ability of the organic compounds to hydrogen bond with the iodide anion. In addition, since io-dide is a large polarizable anion, compounds with large polar-izability, such as those with high molecular weight and those containing double bonds, will be better detected. As can be seen in Fig. 5c, multi-functional compounds with C > 3 can be detected with very similar sensitivities. Those compounds are di-acids, tri-acids and alcohols, all of which can partic-ipate in hydrogen bonding with the iodide and at the same time are more polarizable by size. Glyoxylic acid, which has aldehydic and acidic groups, was also detected with a good sensitivity similar to the multi-acids and unlike its analogue (in structure), pyruvic acid. This is possibly due to the fact that aldehydic hydrogen in glyoxylic acid is slightly electron deficient and thus can form a hydrogen bond with the iodide in contrast to the methyl group hydrogens in pyruvic acid. The aldehydes, glyoxal and methylglyoxal, were not detected well. These two aldehyes have been previously detected in the hydrated gas phase forms after volatilization from a solu-tion using I(H2O)nreagent ions (Zhao et al., 2012). However, these previous measurements using aerosol-CIMS were car-ried out at lower heated inlet temperatures (110◦C). Thus, it is possible that dehydration of the aldehydes was more
effi-cient at 150◦C, which was the temperature used in this study. As a result, the ability of binding to iodide was reduced.
Overall, I(H2O)−n and CH3C(O)O− were found to be
best in detecting multifunctional organic compounds which could particularly be useful for detecting oxygenated organic aerosol (OOA) components that are generally observed in the field.
3.2 WSOC and aqueous photo-oxidation processing
Four hour aqueous photo-oxidation experiments of the WSOC were followed using the ToF-CIMS using the three reagent ions. In all cases the control experiments (not shown) conducted with either H2O2 present but not light, or vice
versa, showed negligible chemical change as compared to the photo-oxidation results arising from when both are present. As a result, only data from photo-oxidation experiments are presented. As well, we note that the intensity of the CIMS peaks in the control experiments conducted with H2O2,
wa-ter and light (but no WSOC) were minor compared to the peaks that were associated with the WSOC.
3.2.1 Raw mass spectra
Mass spectra were collected every second for 4 h of tion. The mass spectra obtained for the WSOC before oxida-tion and after 2 and 4 h of oxidaoxida-tion are shown in Fig. 6. As the reaction proceeds, regions where ions decay are shown in the left spectra and regions where ions form are shown in the right spectra. All spectra before the oxidation was initiated show two humps, monomers and dimers regions, where the monomer region corresponds to ions with molecular weight similar to cis-pinonic and cis-pinic acids (i.e. primary oxi-dation products of α-pinene). Dimeric species are thought to arise via (1) ester, acetal and peroxy-acetal formation in the aqueous phase; (2) gas phase oxidation in the chamber before the SOA was collected; or (3) droplet evaporation in the heated inlet. It is clear that the dimer region in the three reagent ions spectra is decaying during photo-oxidation. In addition, the majority of the products formed after 2 and 4 h of oxidation lie in a lower molecular weight monomer re-gion. This is one indication that fragmentation (and function-alization) reactions are possibly occurring within the organic species during oxidation. By comparing the time-dependent spectra of the dimer to monomer region in the I(H2O)n
spec-tra, it is clear that the dimers decay at a much faster rate com-pared to the monomers. This could be due to the fact that dimer reactions lead to monomers (fragmentation), which subsequently appear as if the monomers are slowly reacting. The observation that the I(H2O)−n spectra are showing the largest and most clear decay compared to CH3C(O)O−and
(H2O)nH+spectra may be due to gas phase ion cluster for-mation for the two latter reagent ions. To illustrate, it was observed (not shown) in the (H2O)nH+and in CH3C(O)O−
Fig. 6. Mass spectra of the photo-oxidized SOA using the three reagent ions, protonated water clusters (H2O)nH+, acetate CH3C(O)O−and
iodide water clusters I(H2O)−n, at time 0, 2 and 4 h. The spectra on the left show them/zregions where the intensity decreased indicating
loss of signal. The spectra on the right show them/zregions where the intensity increased for some ions illustrating products formation. Monomer and dimer regions were observed in the spectra of the three reagent ions, most clearly in the I(H2O)−n spectra.
not form by a proton transfer reaction from/to the reagent ions as in Reactions (R1) and (R2). These ions form by gas phase clustering between ions formed in Reactions (R1) and (R2) with non-ionized analyte compounds, and thus show up as high molecular weight ions. These gas phase ion clusters can be a combination of (1) an analyte ion and another an-alyte or (2) an anan-alyte ion and a reagent ion related species such as H2O clusters or acetic acid/acetic anhydride. Such
ions did not show up in the I(H2O)nspectra. As a result, the dimer region in (H2O)nH+ and in CH3C(O)O− contains a
combination of real dimers existing in aqueous solution (or formed during the droplet evaporation process), such as those that appear in the I(H2O)−n spectra, and those formed by gas phase ion clusters.
3.2.2 Ion assignment and speciation
Peak fitting was performed for all three reagent ion spec-tra covering chemical formulas with molecular weights up to 300 u (m/z 301, m/z 299 and m/z427 for (H2O)nH+, CH3C(O)O−and I(H2O)−n, respectively). Peaks higher than 300 u cannot be assigned for the (H2O)nH+, CH3C(O)O−
reagent ions with high confidence (see supplementary in-formation). Chemical formulas were assigned for oddm/z
based on selection criteria governed by the following chem-ical formula CnH2n+2Ox, where formulas assigned cannot
have a number of hydrogen atoms greater than 2n+2 for a given carbon number equal ton. Elements other than C, H and O were not considered in the formula predictions as it was assumed that those elements were absent from the reagents (WSOC and H2O2)and purified water. The peaks
were fit with the minimum number of ions such that a resid-ual area (un-fitted area) of less than 5 % is achieved. Iso-topic patterns were used to confirm ion assignments in some cases. The number of ions assigned were 595, 555 and 428 for (H2O)nH+, CH3C(O)O−and I(H2O)−n, respectively. The smaller number of ions assigned for the same chemical com-position with I(H2O)−n compared to the other reagent ions is an indication of the selectivity of I(H2O)−n.
From the ion lists generated for the spectra, hydrogen-to-carbon ratios (H / C), oxygen-to-hydrogen-to-carbon ratios (O / C) and the number of carbon atoms (#C) were derived for the individ-ual chemical formulas. The carbon oxidation state (OSC) was
calculated as described in (Kroll et al., 2011) by the approx-imation OSC≈2 O / C+H / C. The ion chemical formulas
Fig. 7. Box plots showing the 10th, 25th, 50th, 75th and 90th
per-centiles for H / C, OC, OSCand #C for the pool of ions detected by
each reagent ion. The population size was 595, 555 and 428 ions for (H2O)nH+, CH3C(O)O−and I(H2O)−n, respectively.
neutral chemical formula of the analytes was used for cal-culations and plotting. Also, gas phase ion clusters cannot be separated from non-cluster ions that appear at the samem/z
as both could have the same chemical formula. The distribu-tion of the 4 parameters H / C, O / C, OSCand #C for the ions
lists is shown in Fig. 7 as percentile box plots.
The ions assigned in the (H2O)nH+spectra cover
notice-ably narrower H / C, O / C and OSCranges as compared to
CH3C(O)O−and I(H2O)−n. In addition, the H/C distribution spans a higher H / C region ranging from 1 to 2 compared to 0.6–2 for the other reagent ions. Lower O / C and OSC val-ues for all the percentiles are also observed for (H2O)nH+. The CH3C(O)O−and I(H2O)−n percentiles for the 4 parame-ters are very similar overall. This indicates that the assigned ions in the two reagent ions spectra are similar, although with some selectivity associated with I(H2O)−n. These re-sults are consistent with the observation in Sect. 3.1, where highly oxygenated multi-functional organics were detected with high sensitivity with CH3C(O)O−and I(H2O)−n but not with (H2O)nH+. It is noted also that these two reagent ions
(CH3C(O)O− and I(H2O)−n) can detect some species with extremely high OSC, approaching 3.7 and 4, and O / C, ap-proaching 2.75 and 3, respectively
3.2.3 The Van Krevelen diagram
The intensity of each ion together with the H / C and O / C values were used to calculate the intensity weighted aver-age elemental ratios, H/C and O/C. This allows plotting the time-dependent H/C and O/C for the photo-oxidation reaction in a Van Krevelen diagram (Heald et al., 2010; Ng et al., 2011). One question of interest is the degree to which the Van Krevelen diagram is similar to data that are derived from the AMS instrument. Figure 8b expands the Van Krev-elen diagram to emphasize the differences between the data for the ToF-CIMS three reagent ions and the AMS. As a
ref-Fig. 8. Van Krevelen diagram of the AMS and ToF-CIMS data for
the WSOC aqueous phase photo-oxidation using the three reagent ions. The plot on the right is an expanded view of the plot on the left. The timescale covers the 4 h of photo-oxidation moving from light to dark bolded symbols. The dark blue dashed lines are the parameterized O / C and H / C from the triangle plot compiling a large data set of ambient and laboratory data as described in Ng et al. (2011). Note that although AMS measurements were conducted for each reagent ion experiment, for clarity sake only one set of data (Water or (H2O)nH+)is plotted here; the other experiments gave
similar results. The linear fit for the AMS data, which is shown in orange, had a slope of−0.48. The error bars of the AMS H / C and O / C are shown in grey obtained from the H / C and O / C accuracies of 10 % and 30 % reported in Aiken et al. (2007).
erence point, it is interesting that the slope of the linear fit of the AMS data is−0.48, which is essentially the same as the slope of−0.5 found by Ng et al. (2011) from a compilation of aerosol ambient and chamber SOA data affected by aging. As well, Fig. 8a illustrates that the ToF-CIMS and AMS data largely overlap in the H / C and O / C spaces, with the ToF-CIMS data lying within the accuracy range of the AMS data. This close agreement is somewhat surprising given the use of uncalibrated ToF-CIMS ion intensity, which is not neces-sarily a good approximation to the true analyte abundances. As well, the AMS detects only particle phase organics, while the aerosol-ToF-CIMS detects both gas and particles phase components. Ideally this comparison would be made using sensitivities that are tied to molecular composition, with the gas and particle signals separated. The fact that the CIMS and AMS data agree so closely with each other suggests that the CIMS sensitivities are similar to each other for the ma-jor, highly oxygenated components of the aerosol, especially when using the iodide and acetate reagent ions. To some degree, this is consistent with the conclusions drawn above from the work done with standards.
Figure 8b highlights the differences between the three ToF-CIMS reagent ions. The data show that the maximum O/C obtained with (H2O)nH+was 0.53, while CH3C(O)O−
CH3C(O)O− and I(H2O)−n follow a similar path in O/C as the reaction proceeds, their H/C values slightly diverge at O/C of 0.6, where the I(H2O)−n data stay closer to the AMS data. As discussed in Sect. 3.1 (i.e. sensitivity evalu-ation), CH3C(O)O− reagent ions allow for efficient
detec-tion of carboxylic acids in general and show no discrimi-nation in ionizing small acids, which are relatively volatile (or semi-volatile) and are not detected by the AMS. Thus, more volatile species with higher H / C may be detected by CH3C(O)O− causing a divergence from the AMS data. For
instance, Fig. 5b shows that CH3C(O)O− allows detecting
formic acid (H / C=2) in similar sensitivity as other mul-tifunctional acids such as citric acid (H / C =1.3). On the other hand, Fig. 5c illustrates that formic acid sensitivity is approximately an order of magnitude less than that of cit-ric acid with I(H2O)−n reagent ions. Formic acid is relatively volatile and is not detected by the AMS unlike citric acid, which can form particles detected by the AMS. Thus, the sig-nal of formic acid is masked in the H/C calculation for the I(H2O)−n case making the H/C and O/C trajectories sim-ilar to those from the AMS. Thus, it is reasonable that the I(H2O)−n data converge to those from the AMS, given that the ToF-CIMS data are likely dominated by particle-phase species (i.e. less volatile, large acids and multifunctional or-ganics).
3.2.4 The difference-Kroll diagram
The 2-D space of the other two parameters OSCand #C, the
so-called Kroll diagram, can also be used to obtain more in-formative evidence on the nature of chemical change (Kroll et al., 2011). In a typical Kroll diagram, the OSCis plotted as
a function of #C. Here, the ToF-CIMS is advantageous over the AMS as it provides carbon number information directly for individual ions. This feature of ToF-CIMS arises from the soft ionization ability that frequently retains the ions intact without fragmentation. In addition, the ToF-CIMS provides a means by which bulk or individual compound OSCand #C
values can be obtained. The OSC and #C are the intensity
weighted averages of OSCand #C summed over all
individ-ual ions.
In order to observe a change in the OSC and #C
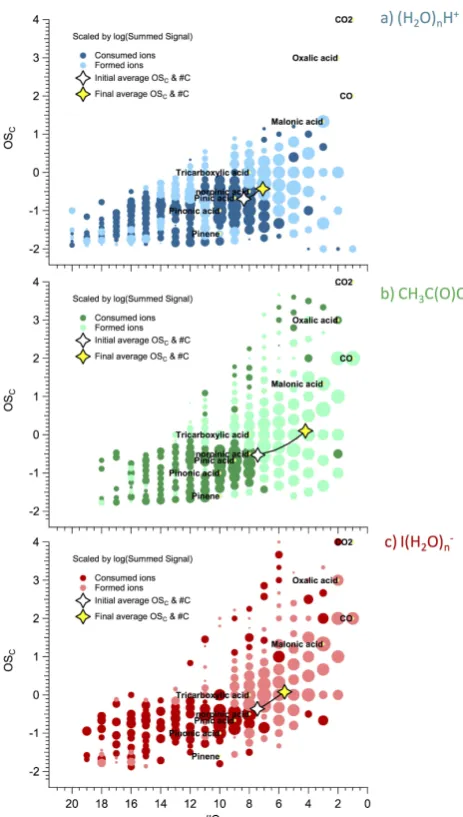
dis-tribution for individual compounds over the 4 h of photo-oxidation, a difference-Kroll diagram was constructed as shown in Fig. 9. In the difference-Kroll diagram the inten-sities of ions with the same co-ordinates on the plot are summed at time 0 and 4 h. The Kroll diagram information at time 4 h is subtracted from that at time 0 h. Coordinates with positive intensity are those that decay away and are marked in dark coloured solid circles. Negative intensities in-dicate coordinates where ions have formed after 4 h of photo-oxidation and are marked in solid light coloured circles. The highest OSCin the difference-Kroll diagram for (H2O)nH+ is 1.33. On the other hand, the plots for CH3C(O)O− and
I(H2O)−n clearly show many occupied coordinates with OSC
Fig. 9. Difference-Kroll diagrams for the WSOCbefore oxidation
and after 4 h of oxidation using the three reagent ions; (H2O)nH+,
CH3C(O)O− and I(H2O)−n. Light bolded circles indicate
coordi-nates where ions formed while dark bolded circles indicate ion losses. The average OSCand #C are also shown over 4 h of
oxida-tion. The size of marker indicates the magnitude of the subtracted intensity.
ranging from 2 to 4 (i.e. very highly oxidized species), with #C less than 10. All three reagent ion difference-Kroll dia-grams show that the majority of the ions formed after 4 h of oxidation have a lower carbon number and higher oxidation state compared to the original state, consistent with a large degree of functionalization and fragmentation occurring in the reaction (Kroll et al., 2009). In addition, the vertical dis-tribution (OSC)of the ions in the I(H2O)−n Kroll diagram is narrower compared to CH3C(O)O−, which is consistent with
The OSCand #C reflect how the whole distribution is
mov-ing over 4 h of oxidation. The change in OSCand #C is most
obvious with CH3C(O)O−and I(H2O)−n reagent ions while a small change is observed in the (H2O)nH+Kroll diagram, in large part because this latter reagent ion is insensitive to many of the more highly oxidized species that are forming. In all three cases, the OSC and #C trajectory indicates that
both fragmentation and functionalization reactions are taken place. Note that one caveat in comparing overall intensities of one coordinate on the Kroll diagram to another is that the sensitivity may vary from species to species. As illustrated in Sect. 3.1 through our sensitivity analyses, this variation is expected to be much less for CH3C(O)O−and I(H2O)−n than for (H2O)nH+.
4 Significance and conclusions
Given the widespread use of CIMS in the atmospheric chem-istry community, it is important to evaluate how well CIMS can be used to assess the chemical nature of aerosol com-position, especially SOA (Sareen et al., 2010; Yatavelli and Thornton, 2010; Yatavelli et al., 2012; Zhao et al., 2012). In this paper, we have focussed on two aspects of this analysis, taking advantage of new instrumental advances in the field, especially a high-resolution time-of-flight that can readily be deployed to the field (Bertram et al., 2011). In particu-lar, we have addressed how the composition of a common WSOC SOA material is analyzed using three common CIMS reagent ions, monitoring both the starting material but also the changes that arise during an aqueous OH oxidation pro-cess. To our knowledge this is the first illustration of the com-parative abilities of these common reagent ions to study the composition of complex organic mixtures, such as SOA. As well, while it was convenient for us to monitor change oc-curring during aqueous phase oxidation in the laboratory, we stress that the same general behaviour is likely to be observed from chemical change being driven by gas phase or hetero-geneous OH oxidation. It is hoped that these characterization experiments will form the foundation for similar analyses of aging processes observed in the field as well. For example, these methods could be used for studying: cloud-water oxi-dation (Lee et al., 2012) or atmospheric aerosol processing as observed using the MOVI interface (Yatavelli and Thornton, 2010; Yatavelli et al., 2012).
Specific findings include
– Complex organic composition of atmospherically
rel-evant WSOC samples can be resolved with high-resolution aerosol ToF-CIMS.
– The monomer and dimer regions of α-pinene SOA WSOC can be resolved and observed with ToF-CIMS, most clearly with I(H2O)−n reagent ions. The chemi-cal change of these two regions can be followed
on-line with the dimers degrading more rapidly than the monomers.
– The simplicity in the switching of the ToF-CIMS
reagent ions allows for a more comprehensive under-standing of chemical change.
– This also illustrates that care must be taken when
choosing the reagent ions with which to operate depending on the targeted analysis. For instance, (H2O)nH+reagent ions are shown to be more selective towards the more reduced organic compounds with WSOC SOA, while CH3C(O)O− and I(H2O)−n allow for the detection of more highly oxygenated com-pounds with I(H2O)−n being more selective to multi-functional compounds. In general, the range of sensi-tivities for the latter two reagent ions is far less than with the more selective (H2O)nH+.
– Despite these potential differences in sensitivity to
dif-ferent analytes, we point out that the data arising from a combination of the (H2O)nH+ data and either the CH3C(O)O− and I(H2O)−n results yield a Van Krev-elen analysis that is remarkably similar to that mea-sured simultaneously by high-resolution AMS, despite the AMS being only sensitive to particle phase species and the ToF-CIMS to both gas and particle phases. Thus, the demonstrated ability of AMS data to study aging of organic aerosol using Van Krevelen analysis can also be applied using ToF-CIMS data.
– Aerosol-ToF-CIMS clearly can monitor the
function-alization and fragmentation processes that occur with SOA as it is oxidized by OH, generally giving rise to more functionalized products that are of lower carbon number and higher oxidation state.
– A potential source of data analysis complications is the
presence of gas phase ion clusters, specifically in the cases of (H2O)nH+and CH3C(O)O−reagent ions. In
addition, dehydration of organics in the heated inlet or ions fragmentation in the ToF-CIMS can increase the difficulty of the identification of the unknown analyte present in the aqueous solution.
To finish, we note that the SOA aerosol-ToF-CIMS spectra also contain an enormous amount of detailed mechanistic information, related to the formation and decay of specific chemical species. An analysis of these spectra in that context will form the basis of a subsequent publication.
Acknowledgements. The authors would like to acknowledge
infras-tructure funding from the Canada Foundation for Innovation and Ontario Research Foundation to the Canadian Aerosol Research Network. As well, operational support comes from NSERC, OGS, Environment Canada and the Alex Harrison Award in Analytical Mass Spectrometry. The authors note extensive help from H. Stark (Aerodyne Inc.) and R. Zhao (Abbatt group) with the operation and data analysis of the CIMS.
Edited by: M. Sipilä
References
Aiken, A. C., DeCarlo, P. F., and Jimenez, J. L.: Elemental analysis of organic species with electron ionization high-resolution mass spectrometry, Anal. Chem., 79, 8350–8358, 2007.
Aiken, A. C., Decarlo, P. F., Kroll, J. H., Worsnop, D. R., Huff-man, J. A., Docherty, K. S., Ulbrich, I. M., Mohr, C., Kimmel, J. R., Sueper, D., Sun, Y., Zhang, Q., Trimborn, A., Northway, M., Ziemann, P. J., Canagaratna, M. R., Onasch, T. B., Alfarra, M. R., Prevot, A. S. H., Dommen, J., Duplissy, J., Metzger, A., Baltensperger, U., and Jimenez, J. L.: O / C and OM / OC ra-tios of primary, secondary, and ambient organic aerosols with high-resolution time-of-flight aerosol mass spectrometry, Envi-ron. Sci. Technol., 42, 4478–4485, 2008.
Altieri, K. E., Seitzinger, S. P., Carlton, A. G., Turpin, B. J., Klein, G. C., and Marshall, A. G.: Oligomers formed through in-cloud methylglyoxal reactions: Chemical composition, properties, and mechanisms investigated by ultra-high resolution FT-ICR mass spectrometry, Atmos. Environ., 42, 1476–1490, 2008.
Bateman, A. P., Walser, M. L., Desyaterik, Y., Laskin, J., Laskin, A., and Nizkorodov, S. A.: The effect of solvent on the analysis of secondary organic aerosol using electrospray ionization mass spectrometry, Environ. Sci. Technol., 42, 7341–7346, 2008. Bertram, T. H., Thornton, J. A., and Riedel, T. P.: An
experi-mental technique for the direct measurement of N2O5
reac-tivity on ambient particles, Atmos. Meas. Tech., 2, 231–242, doi:10.5194/amt-2-231-2009, 2009.
Bertram, T. H., Kimmel, J. R., Crisp, T. A., Ryder, O. S., Yatavelli, R. L. N., Thornton, J. A., Cubison, M. J., Gonin, M., and Worsnop, D. R.: A field-deployable, chemical ionization time-of-flight mass spectrometer, Atmos. Meas. Tech., 4, 1471–1479, doi:10.5194/amt-4-1471-2011, 2011.
Caldwell, G. and Kebarle, P.: Binding-Energies and Structural Ef-fects in Halide Anion ROH and RCOOH Complexes from Gas-Phase Equilibria Measurements, J. Am. Chem. Soc., 106, 967– 969, 1984.
Caldwell, G., Masucci, J., and Ikonomou, M.: Negative-Ion Chemi-cal Ionization Mass-Spectrometry Binding of Molecules to Bro-mide and Iodide Anions, Org. Mass Spectrom., 24, 8–14, 1989. Canagaratna, M. R., Jayne, J. T., Jimenez, J. L., Allan, J. D.,
Al-farra, M. R., Zhang, Q., Onasch, T. B., Drewnick, F., Coe, H., Middlebrook, A., Delia, A., Williams, L. R., Trimborn, A. M., Northway, M. J., DeCarlo, P. F., Kolb, C. E., Davidovits, P., and Worsnop, D. R.: Chemical and microphysical characterization of ambient aerosols with the aerodyne aerosol mass spectrometer, Mass Spectrom. Rev., 26, 185–222, 2007.
De Gouw, J. and Jimenez, J. L.: Organic Aerosols in the Earth’s Atmosphere, Environ. Sci. Technol., 43, 7614–7618, 2009.
Duarte, R. M. B. O. and Duarte, A. C.: A critical review of advanced analytical techniques for water-soluble organic matter from at-mospheric aerosols, TrAC, Trends Anal. Chem., 30, 1659–1671, 2011.
Ervens, B., Turpin, B. J., and Weber, R. J.: Secondary or-ganic aerosol formation in cloud droplets and aqueous parti-cles (aqSOA): a review of laboratory, field and model stud-ies, Atmos. Chem. Phys., 11, 11069–11102, doi:10.5194/acp-11-11069-2011, 2011.
Gard, E., Mayer, J., Morrical, B., Dienes, T., Fergenson, D., and Prather, K.: Real-time analysis of individual atmospheric aerosol particles: Design and performance of a portable ATOFMS, Anal. Chem., 69, 4083–4091, 1997.
Ge, X., Zhang, Q., Sun, Y., Ruehl, C. R., and Setyan, A.: Effect of aqueous-phase processing on aerosol chemistry and size distribu-tions in Fresno, California, during wintertime, Environ. Chem., 9, 221–235, 2012.
Hallquist, M., Wenger, J. C., Baltensperger, U., Rudich, Y., Simp-son, D., Claeys, M., Dommen, J., Donahue, N. M., George, C., Goldstein, A. H., Hamilton, J. F., Herrmann, H., Hoff-mann, T., Iinuma, Y., Jang, M., Jenkin, M. E., Jimenez, J. L., Kiendler-Scharr, A., Maenhaut, W., McFiggans, G., Mentel, Th. F., Monod, A., Prévôt, A. S. H., Seinfeld, J. H., Surratt, J. D., Szmigielski, R., and Wildt, J.: The formation, properties and im-pact of secondary organic aerosol: current and emerging issues, Atmos. Chem. Phys., 9, 5155–5236, doi:10.5194/acp-9-5155-2009, 2009.
Hamilton, J. F., Webb, P. J., Lewis, A. C., Hopkins, J. R., Smith, S., and Davy, P.: Partially oxidised organic components in urban aerosol using GCXGC-TOF/MS, Atmos. Chem. Phys., 4, 1279– 1290, doi:10.5194/acp-4-1279-2004, 2004.
Heald, C. L., Kroll, J. H., Jimenez, J. L., Docherty, K. S., DeCarlo, P. F., Aiken, A. C., Chen, Q., Martin, S. T., Farmer, D. K., and Artaxo, P.: A simplified description of the evolution of organic aerosol composition in the atmosphere, Geophys. Res. Lett., 37, L08803, doi:10.1029/2010GL042737 2010.
Hearn, J. D. and Smith, G.: A chemical ionization mass spectrom-etry method for the online analysis of organic aerosols, Anal. Chem., 76, 2820–2826, 2004.
Hearn, J. D. and Smith, G. D.: Reactions and mass spectra of com-plex particles using Aerosol CIMS, Int. J. Mass Spectrom., 258, 95–103, 2006.
Hunter, E. and Lias, S.: Evaluated gas phase basicities and proton affinities of molecules: An update, J. Phys. Chem. Ref. Data, 27, 413–656, 1998.
E., Baltensperger, U. and Worsnop, D. R.: Evolution of Organic Aerosols in the Atmosphere, Science, 326, 1525–1529, 2009. Jokinen, T., Sipilä, M., Junninen, H., Ehn, M., Lönn, G., Hakala,
J., Petäjä, T., Mauldin III, R. L., Kulmala, M., and Worsnop, D. R.: Atmospheric sulphuric acid and neutral cluster measure-ments using CI-APi-TOF, Atmos. Chem. Phys., 12, 4117–4125, doi:10.5194/acp-12-4117-2012, 2012.
Kanakidou, M., Seinfeld, J. H., Pandis, S. N., Barnes, I., Dentener, F. J., Facchini, M. C., Van Dingenen, R., Ervens, B., Nenes, A., Nielsen, C. J., Swietlicki, E., Putaud, J. P., Balkanski, Y., Fuzzi, S., Horth, J., Moortgat, G. K., Winterhalter, R., Myhre, C. E. L., Tsigaridis, K., Vignati, E., Stephanou, E. G., and Wilson, J.: Organic aerosol and global climate modelling: a review, At-mos. Chem. Phys., 5, 1053–1123, doi:10.5194/acp-5-1053-2005, 2005.
Kercher, J. P., Riedel, T. P., and Thornton, J. A.: Chlorine activation by N2O5: simultaneous, in situ detection of ClNO2and N2O5
by chemical ionization mass spectrometry, Atmos. Meas. Tech., 2, 193–204, doi:10.5194/amt-2-193-2009, 2009.
Kroll, J. H., Smith, J. D., Che, D. L., Kessler, S. H., Worsnop, D. R., and Wilson, K. R.: Measurement of fragmentation and function-alization pathways in the heterogeneous oxidation of oxidized or-ganic aerosol, Phys. Chem. Chem. Phys., 11, 8005–8014, 2009. Kroll, J. H., Donahue, N. M., Jimenez, J. L., Kessler, S. H.,
Cana-garatna, M. R., Wilson, K. R., Altieri, K. E., Mazzoleni, L. R., Wozniak, A. S., Bluhm, H., Mysak, E. R., Smith, J. D., Kolb, C. E., and Worsnop, D. R.: Carbon oxidation state as a metric for describing the chemistry of atmospheric organic aerosol, Nat. Chem., 3, 133–139, 2011.
Kundu, S., Fisseha, R., Putman, A. L., Rahn, T. A., and Maz-zoleni, L. R.: High molecular weight SOA formation during limonene ozonolysis: insights from ultrahigh-resolution FT-ICR mass spectrometry characterization, Atmos. Chem. Phys., 12, 5523–5536, doi:10.5194/acp-12-5523-2012, 2012.
Kurtén, T., Petäjä, T., Smith, J., Ortega, I. K., Sipilä, M., Junni-nen, H., Ehn, M., Vehkamäki, H., Mauldin, L., Worsnop, D. R., and Kulmala, M.: The effect of H2SO4– amine clustering on
chemical ionization mass spectrometry (CIMS) measurements of gas-phase sulfuric acid, Atmos. Chem. Phys., 11, 3007–3019, doi:10.5194/acp-11-3007-2011, 2011.
Laskin, A., Laskin, J., and Nizkorodov, S. A.: Mass spectro-metric approaches for chemical characterisation of atmospheric aerosols: critical review of the most recent advances, Environ. Chem., 9, 163–189, 2012.
Laskin, J., Laskin, A., and Nizkorodov, S. A.: New mass spectrom-etry techniques for studying physical chemistry of atmospheric heterogeneous processes, Int. Rev. Phys. Chem., 32, 128–170, 2013.
Le Breton, M., McGillen, M. R., Muller, J. B. A., Bacak, A., Shall-cross, D. E., Xiao, P., Huey, L. G., Tanner, D., Coe, H., and Per-cival, C. J.: Airborne observations of formic acid using a chemi-cal ionization mass spectrometer, Atmos. Meas. Tech., 5, 3029– 3039, doi:10.5194/amt-5-3029-2012, 2012.
Lee, A. K. Y., Hayden, K. L., Herckes, P., Leaitch, W. R., Lig-gio, J., Macdonald, A. M., and Abbatt, J. P. D.: Characteri-zation of aerosol and cloud water at a mountain site during WACS 2010: secondary organic aerosol formation through ox-idative cloud processing, Atmos. Chem. Phys., 12, 7103–7116, doi:10.5194/acp-12-7103-2012, 2012.
Lim, Y. B., Tan, Y., Perri, M. J., Seitzinger, S. P., and Turpin, B. J.: Aqueous chemistry and its role in secondary organic aerosol (SOA) formation, Atmos. Chem. Phys., 10, 10521– 10539, doi:10.5194/acp-10-10521-2010, 2010.
Lindinger, W., Hansel, A., and Jordan, A.: On-line monitoring of volatile organic compounds at pptv levels by means of proton-transfer-reaction mass spectrometry (PTR-MS) – Medical appli-cations, food control and environmental research, Int. J. Mass Spectrom., 173, 191–241, 1998.
Mauldin, R., Tanner, D., Heath, J., Huebert, B., and Eisele, F.: Ob-servations of H2SO4and MSA during PEM-Tropics-A, J.
Geo-phys. Res.-Atmos., 104, 5801–5816, 1999.
Mazzoleni, L. R., Ehrmann, B. M., Shen, X., Marshall, A. G., and Collett Jr., J. L.: Water-Soluble Atmospheric Organic Mat-ter in Fog: Exact Masses and Chemical Formula Identification by Ultrahigh-Resolution Fourier Transform Ion Cyclotron Res-onance Mass Spectrometry, Environ. Sci. Technol., 44, 3690– 3697, 2010.
Murphy, D. M. and Thomson, D. S.: Laser Ionization Mass-Spectroscopy of Single Aerosol-Particles, Aerosol. Sci. Tech., 22, 237–249, 1995.
National Institute of Standards and Technology (NIST), http:// webbook.nist.gov/cgi/cbook.cgi?ID=C7732185&Mask=40 (last access: 30 March 2013), 2013.
Ng, N. L., Canagaratna, M. R., Jimenez, J. L., Chhabra, P. S., Se-infeld, J. H., and Worsnop, D. R.: Changes in organic aerosol composition with aging inferred from aerosol mass spectra, At-mos. Chem. Phys., 11, 6465–6474, doi:10.5194/acp-11-6465-2011, 2011.
Onasch, T. B., Trimborn, A., Fortner, E. C., Jayne, J. T., Kok, G. L., Williams, L. R., Davidovits, P., and Worsnop, D. R.: Soot Particle Aerosol Mass Spectrometer: Development, Validation, and Initial Application, Aerosol Sci. Tech., 46, 804–817, 2012. Perri, M. J., Seitzinger, S., and Turpin, B. J.: Secondary organic
aerosol production from aqueous photooxidation of glycolalde-hyde: Laboratory experiments, Atmos. Environ., 43, 1487–1497, 2009.
Pratt, K. A. and Prather, K. A.: Mass spectrometry of atmospheric aerosols – Recent developments and applications. Part I: Off-line mass spectrometry techniques, Mass Spectrom. Rev., 31, 1–16, 2012a.
Pratt, K. A. and Prather, K. A.: Mass spectrometry of atmospheric aerosols – Recent developments and applications. Part II: On-line mass spectrometry techniques, Mass Spectrom. Rev., 31, 17–48, 2012b.
Sareen, N., Schwier, A. N., Shapiro, E. L., Mitroo, D., and Mc-Neill, V. F.: Secondary organic material formed by methylglyoxal in aqueous aerosol mimics, Atmos. Chem. Phys., 10, 997–1016, doi:10.5194/acp-10-997-2010, 2010.
Schmitt-Kopplin, P., Gelencser, A., Dabek-Zlotorzynska, E., Kiss, G., Hertkorn, N., Harir, M., Hong, Y., and Gebefuegi, I.: Analy-sis of the Unresolved Organic Fraction in Atmospheric Aerosols with Ultrahigh-Resolution Mass Spectrometry and Nuclear Mag-netic Resonance Spectroscopy: Organosulfates As Photochemi-cal Smog Constituents, Anal. Chem., 82, 8017–8026, 2010. Sunner, J., Nicol, G., and Kebarle, P.: Factors Determining
Tan, Y., Perri, M. J., Seitzinger, S. P., and Turpin, B. J.: Effects of Precursor Concentration and Acidic Sulfate in Aqueous Glyoxal-OH Radical Oxidation and Implications for Secondary Organic Aerosol, Environ. Sci. Technol., 43, 8105–8112, 2009.
Tan, Y., Carlton, A. G., Seitzinger, S. P., and Turpin, B. J.: SOA from methylglyoxal in clouds and wet aerosols: Measurement and prediction of key products, Atmos. Environ., 44, 5218–5226, 2010.
Thornton, J. and Abbatt, J.: N2O5reaction on submicron sea salt
aerosol: Kinetics, products, and the effect of surface active or-ganics, J. Phys. Chem. A, 109, 10004–10012, 2005.
Thornton, J., Braban, C., and Abbatt, J.: N2O5hydrolysis on
sub-micron organic aerosols: the effect of relative humidity, parti-cle phase, and partiparti-cle size, Phys. Chem. Chem. Phys., 5, 4593– 4603, 2003.
Veres, P., Roberts, J. M., Warneke, C., Welsh-Bon, D., Zahniser, M., Herndon, S., Fall, R., and de Gouw, J.: Development of negative-ion proton-transfer chemical-negative-ionizatnegative-ion mass spectrometry (NI-PT-CIMS) for the measurement of gas-phase organic acids in the atmosphere, Int. J. Mass Spectrom., 274, 48–55, 2008.
Yatavelli, R. L. N. and Thornton, J. A.: Particulate Organic Mat-ter Detection Using a Micro-Orifice Volatilization Impactor Coupled to a Chemical Ionization Mass Spectrometer (MOVI-CIMS), Aerosol Sci. Tech., 44, 61–74, 2010.
Yatavelli, R. L. N., Lopez-Hilfiker, F., Wargo, J. D., Kimmel, J. R., Cubison, M. J., Bertram, T. H., Jimenez, J. L., Gonin, M., Worsnop, D. R., and Thornton, J. A.: A Chemical Ionization High-Resolution Time-of-Flight Mass Spectrometer Coupled to a Micro Orifice Volatilization Impactor (MOVI-HRToF-CIMS) for Analysis of Gas and Particle-Phase Organic Species, Aerosol Sci. Tech., 46, 1313–1327, 2012.
Zhang, Q., Jimenez, J. L., Canagaratna, M. R., Allan, J. D., Coe, H., Ulbrich, I., Alfarra, M. R., Takami, A., Middlebrook, A. M., Sun, Y. L., Dzepina, K., Dunlea, E., Docherty, K., De-Carlo, P. F., Salcedo, D., Onasch, T., Jayne, J. T., Miyoshi, T., Shimono, A., Hatakeyama, S., Takegawa, N., Kondo, Y., Schneider, J., Drewnick, F., Borrmann, S., Weimer, S., Demer-jian, K., Williams, P., Bower, K., Bahreini, R., Cottrell, L., Griffin, R. J., Rautiainen, J., Sun, J. Y., Zhang, Y. M., and Worsnop, D. R.: Ubiquity and dominance of oxygenated species in organic aerosols in anthropogenically-influenced Northern Hemisphere midlatitudes, Geophys. Res. Lett., 34, L13801, doi:10.1029/2007GL029979, 2007.