www.atmos-meas-tech.net/3/51/2010/
© Author(s) 2010. This work is distributed under the Creative Commons Attribution 3.0 License.
Measurement
Techniques
Four Fourier transform spectrometers and the Arctic polar vortex:
instrument intercomparison and ACE-FTS validation at Eureka
during the IPY springs of 2007 and 2008
R. L. Batchelor1, F. Kolonjari1, R. Lindenmaier1, R. L. Mittermeier2, W. Daffer3, H. Fast2, G. Manney3,4, K. Strong1, and K. A. Walker1,5
1Department of Physics, University of Toronto, Toronto, Ontario, Canada 2Environment Canada, Downsview, Ontario, Canada
3Jet Propulsion Laboratory, California Institute of Technology, Pasadena, California, USA 4New Mexico Institute of Mining and Technology, Socorro, New Mexico, USA
5Department of Chemistry, University of Waterloo, Waterloo, Ontario, Canada
Received: 6 October 2009 – Published in Atmos. Meas. Tech. Discuss.: 6 November 2009 Revised: 6 January 2010 – Accepted: 7 January 2010 – Published: 22 January 2010
Abstract. The Canadian Arctic Atmospheric Chemistry Ex-periment Validation Campaigns have been carried out at Eu-reka, Nunavut (80.05◦N, 86.42◦W) during the polar sunrise period since 2004. During the International Polar Year (IPY) springs of 2007 and 2008, three ground-based Fourier trans-form infrared (FTIR) spectrometers were operated simulta-neously. This paper presents a comparison of trace gas mea-surements of stratospherically important species involved in ozone depletion, namely O3, HCl, ClONO2, HNO3and HF,
recorded with these three spectrometers. Total column den-sities of the gases measured with the new Canadian Net-work for the Detection of Atmospheric Change (CANDAC) Bruker 125HR are shown to agree to within 3.5% with the ex-isting Environment Canada Bomem DA8 measurements. Af-ter smoothing both of these sets of measurements to account for the lower spectral resolution of the University of Waterloo Portable Atmospheric Research Interferometric Spectrome-ter for the Infrared (PARIS-IR), the measurements were like-wise shown to agree with PARIS-IR to within 7%. Concur-rent measurements of these gases were also made with the satellite-based Atmospheric Chemistry Experiment Fourier Transform Spectrometer (ACE-FTS) during overpasses of Eureka during these time periods. While one of the man-dates of the ACE satellite mission is to study ozone deple-tion in the polar spring, previous validadeple-tion exercises have identified the highly variable polar vortex conditions of the spring period to be a challenge for validation efforts. In this
Correspondence to: R. L. Batchelor ([email protected])
work, comparisons between the CANDAC Bruker 125HR and ACE-FTS have been used to develop strict criteria that allow the ground- and satellite-based instruments to be fidently compared. When these criteria are taken into con-sideration, the observed biases between the ACE-FTS and ground-based FTIR spectrometer are not persistent for both years and are generally insignificant, though small positive biases of∼5%, comparable in magnitude to those seen in previous validation exercises, are observed for HCl and HF in 2007, and negative biases of−15.3%,−4.8% and−1.5% are seen for ClONO2, HNO3and O3in 2008.
1 Introduction
(Goldman et al., 1999; Griffith et al., 2003; Meier et al., 2005; Wunch et al., 2007; Batchelor et al., 2009). Validation of the Atmospheric Chemistry Experiment – Fourier Trans-form Spectrometer (ACE-FTS) has likewise shown large differences between ground-based and satellite instruments, particularly during the highly-variable Arctic spring-time (e.g., Wolff et al., 2008; Mahieu et al., 2008). Compar-isons made under these conditions thus require a comprehen-sive understanding of both the validating instrument and the viewing geometry with respect to polar vortex dynamics.
The Canadian Arctic ACE Validation Campaigns have been carried out during the polar sunrise period at the Polar Environment Atmospheric Research Laboratory (PEARL) at Eureka, Nunavut, Canada (80.05◦N, 86.42◦W) since 2004 (Kerzenmacher et al., 2005; Fu et al., 2008; Fraser et al., 2008). The 2007 and 2008 campaigns extended from mid-February until mid-April, and were additionally comple-mented by instrumentation installed at PEARL by the Cana-dian Network for the Detection of Atmospheric Change dur-ing 2006. One of these additions was a high-resolution Bruker 125HR Fourier transform spectrometer (Batchelor et al., 2009). This allowed simultaneous measurements of at-mospheric composition to be made throughout the campaign by four Fourier transform spectrometers: three ground-based and one satellite-borne.
This paper provides an in-depth intercomparison between the three ground-based FTIR spectrometers co-located at PEARL during the International Polar Year Canadian Arctic ACE Validation Campaigns of 2007 and 2008, and validation of ACE-FTS data from the same period. Meteorological con-ditions were quite different between the two campaigns, with many measurements in 2007 being made inside the polar vor-tex where heterogeneous chemistry and ozone-depleting pro-cesses were occurring. A polar stratospheric warming prior to the start of the campaign in 2008, however, resulted in most of the measurements being made outside the vortex. As such, the two years provide a wide range of atmospheric con-ditions for the intercomparison. Key stratospheric trace-gas species O3, chlorine reservoirs HCl and ClONO2, fluorine
reservoir HF and nitrogen reservoir HNO3are investigated.
Derived meteorological data along the instruments’ line-of-sight are used to account for the changing conditions of the polar stratosphere, and a comprehensive set of measurement comparison criteria are identified for satellite validation near the polar vortex edge.
The paper is laid out as follows: Sect. 2 introduces the measurement site and the four FTIR spectrometers. Sec-tion 3 details the methodology used for the analyses, and is followed by the detailed intercomparison of the three ground-based instruments in Sect. 4. Section 5 then extends the ground-based intercomparison to include and validate measurements from the ACE-FTS using the Bruker 125HR Fourier transform spectrometer, before finishing with con-clusions in Sect. 6.
2 Measurement site and instrumentation
The Polar Environment Atmospheric Research Laboratory, situated on Ellesmere Island, Nunavut, Canada (80.05◦N, 86.42◦W, 610 m above sea level) is a modern, high-Arctic atmospheric research laboratory run by the Canadian Net-work for the Detection of Atmospheric Change (CANDAC). Atmospheric measurements made at PEARL sample the at-mosphere from the ground to the top of the atat-mosphere. The PEARL site is situated 15 km from the Environment Canada Eureka Weather Station, and over 400 km from the nearest permanent settlement. At only 1100 km from the North Pole, it is a clean-air site in an ideal location for studying polar processes involved in ozone depletion. In addition, PEARL is ideally situated for the validation of polar-orbiting satel-lites, which typically sample nearby air several times a day.
The three ground-based FTIR spectrometers in operation at PEARL during the 2007 and 2008 validation campaigns were the Environment Canada ABB Bomem DA8 forth the DA8) and the CANDAC Bruker IFS 125HR (hence-forth the 125HR), which were both permanently housed in the PEARL FTS lab, and the campaign-only Univer-sity of Waterloo Portable Atmospheric Research Interfero-metric Spectrometer for the Infrared (PARIS-IR). The three spectrometers were physically located within meters of each other, and shared a common solar beam from a custom-built solar tracker located on the roof of the laboratory. Approx-imately 1/3 of the beam was directed to the PARIS-IR, and the other 2/3 was alternately directed to the 125HR and the DA8. Details of each of the instruments are given below. 2.1 Environment Canada ABB Bomem DA8
The Environment Canada ABB Bomem DA8 FTIR spec-trometer was installed at PEARL in 1993 and has provided atmospheric solar absorption spectra each spring over the past fifteen years (Donovan et al., 1997; Farahani et al., 2007; Paton-Walsh et al., 2008; Fu et al., 2008; Fast et al., 2010). The DA8 spectrometer is a vertically aligned Michelson in-terferometer equipped with two separate detectors: an InSb and a HgCdTe (commonly known as an MCT). Used with a KBr beamsplitter and a set of narrow band interference fil-ters, the DA8 can record radiation over the spectral range from 700 cm−1to 5000 cm−1at a resolution of 0.004 cm−1 (where resolution is defined as 1/maximum optical path dif-ference (MOPD) and MOPD = 250 cm). Eight interdif-ference filters are used in sequence in order to optimize the signal-to-noise ratio (SNR). Measurements each consist of four co-added spectra, taking approximately twelve minutes, Fourier transformed with a Hamming apodization.
2.2 CANDAC Bruker IFS 125HR
the year. It has been described in depth by Batchelor et al. (2009). Like the DA8, the 125HR measures on either an InSb or MCT detector with a KBr beamsplitter and uses a sequence of narrow band interference filters covering the 600–4300 cm−1 spectral range. Solar absorption measure-ments made during the IPY Arctic campaigns each consist of four co-added spectra recorded in both the forwards and backwards directions (taking approximately six minutes) at a resolution of 0.004 cm−1(MOPD = 250 cm). No apodization is applied to these measurements.
2.3 University of Waterloo PARIS-IR
The University of Waterloo Portable Atmospheric Research Interferometric Spectrometer for the Infrared is an ABB Bomem custom-built interferometer that is based on the design of the Fourier transform spectrometer onboard the Atmospheric Chemistry Experiment, and is built from its spare parts. A resolution of 0.02 cm−1 (MOPD =±25 cm, with resolution defined to be consistent with the ACE-FTS, i.e., 0.5/MOPD) is achieved using corner cube reflectors mounted on a pivoting arm to introduce an optical path difference, as detailed in Fu et al. (2008). Interferograms are recorded on a sandwich InSb/MCT detector with no fil-ters, allowing the entire 750–4400 cm−1 spectral region to be measured simultaneously. Each IPY spring measurement consists of 20 co-added spectra, taking approximately six minutes, with no applied apodization.
2.4 ACE-FTS
In addition to the three ground-based instruments, the At-mospheric Chemistry Experiment (also known as SCISAT) also made measurements over Eureka during the campaigns. ACE was launched in August 2003, and orbits the Earth in a 74◦ inclined circular orbit (Bernath et al., 2005). One of its primary aims is to observe the polar regions during active periods of ozone depletion chemistry, notably during the po-lar springtime. As such, it has multiple measurements over Eureka during this time period. The primary instrument on-board ACE is a Fourier transform spectrometer which simul-taneously measures vertical profiles of more than 30 different atmospheric species, as well as temperature and pressure, us-ing the solar occultation method (Bernath et al., 2005). The spectral range of the ACE-FTS is comparable to that of the ground-based FTIR spectrometers, with a spectral resolution of 0.02 cm−1, however, due to the limb-sounding geometry,
the satellite-borne spectrometer has considerably more ver-tical resolution (typically 3–4 km) than any of the ground-based instruments (Boone et al., 2005).
3 Data analysis
3.1 Ground-based FTIR spectrometers
Total column densities of O3, HCl, ClONO2, HNO3 and
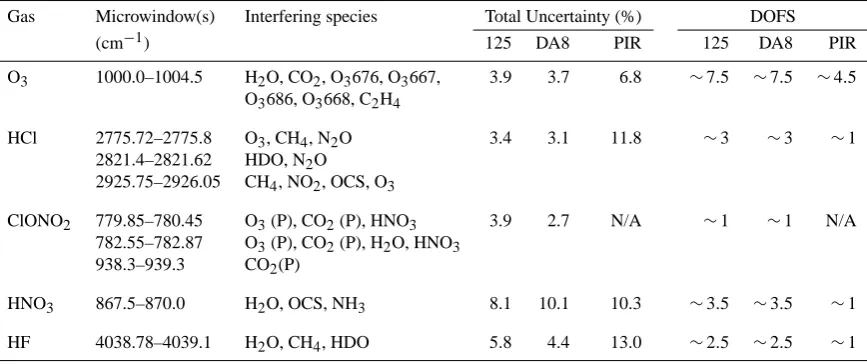
HF covering the region between the ground and 100 km have been determined from the recorded spectra of each of the ground-based spectrometers in a consistent man-ner. Altitude-dependent atmospheric volume mixing ratio (VMR) profiles were retrieved from the spectra using SFIT2 (Pougatchev et al., 1995), a profile retrieval algorithm based on the optimal estimation technique of Rodgers (1976, 2000) whereby a calculated spectrum is fitted to the measured one by adjustment of the VMR profile. Total column densities were determined by integrating the retrieved trace gas and atmospheric density profiles throughout the column. The HI-TRAN 2004 + updates line list was used with SFIT2 v3.92c for the 125HR and PARIS-IR retrievals and v3.91 for the DA8 (the differences between the two versions being in-significant for this work). The retrieval parameters used have been described in Batchelor et al. (2009). The only differ-ence from that work is that for PARIS-IR, retrievals have been performed on a 29- rather than the 38-layer grid used for the DA8 and 125HR, to allow for its lower spectral res-olution. This has been previously shown to result in dif-ferences in the retrieved column of less than 0.6% (Wunch et al., 2007), but helps to reduce unphysical oscillations in the retrieved profile. A priori VMR profiles and covari-ances, described in Sung et al. (2010), were consistent for all three instruments, while ad hoc SNR ratios, which are used for determining the measurement covariance, were selected for each gas for each instrument using the trade-off curve method described in Batchelor et al. (2009) to customize for the noise level in the spectra of the individual instruments. Daily pressure/temperature profiles, determined from the av-erage of twice-daily radiosondes launched at Eureka, cou-pled to the National Centers for Environmental Prediction analyses above balloon height to 50 km and then to the US standard atmosphere to 100 km, have been used for all three instruments. A summary of the spectral microwindows that have been fitted for each of the retrievals is presented in Ta-ble 1. The degrees of freedom of signal (DOFS), defined in this case as the trace of the averaging kernel, as well as an estimated error in the total column is also given. These have been calculated for each of the gases as described in Batche-lor et al. (2009).
3.2 ACE-FTS
Table 1. Summary of retrieval microwindows and interfering species, with estimated total uncertainty and DOFS. Multiple microwindows
are fitted simultaneously where more than one region is specified. Interfering trace gas species are scale fitted, unless profile fitting is indicated by a (P). Total uncertainty has been calculated, with individual uncertainties resulting from measurement, smoothing and model parameter errors added in quadrature, as described in Batchelor et al. (2009). The DOFS are representative values for spectra recorded at the beginning of March, when solar zenith angles of are typically>80◦. Abbreviations used in the headers are 125=125HR and PIR=PARIS-IR.
Gas Microwindow(s) Interfering species Total Uncertainty (%) DOFS (cm−1) 125 DA8 PIR 125 DA8 PIR O3 1000.0–1004.5 H2O, CO2, O3676, O3667, 3.9 3.7 6.8 ∼7.5 ∼7.5 ∼4.5
O3686, O3668, C2H4
HCl 2775.72–2775.8 O3, CH4, N2O 3.4 3.1 11.8 ∼3 ∼3 ∼1 2821.4–2821.62 HDO, N2O
2925.75–2926.05 CH4, NO2, OCS, O3
ClONO2 779.85–780.45 O3(P), CO2(P), HNO3 3.9 2.7 N/A ∼1 ∼1 N/A 782.55–782.87 O3(P), CO2(P), H2O, HNO3
938.3–939.3 CO2(P)
HNO3 867.5–870.0 H2O, OCS, NH3 8.1 10.1 10.3 ∼3.5 ∼3.5 ∼1
HF 4038.78–4039.1 H2O, CH4, HDO 5.8 4.4 13.0 ∼2.5 ∼2.5 ∼1
against other satellites and ground-based instruments, and show typical relative differences of 1–8% for O3(Dupuy et
al., 2009), 5–10% for HCl (Mahieu et al., 2008), 1–14% for ClONO2(Wolff et al., 2008), 5–10% for HF (Mahieu et al.,
2008) and 2–28% for HNO3 (Wolff et al., 2008) globally
through the stratosphere. Satellite validation near the polar vortex edge is, however, a challenge (as shown, for example, in Wolff et al., 2008 and Mahieu et al., 2008) and as such, the validation of ACE during the highly variable Arctic sun-rise period requires special consideration. This is the primary goal of the Canadian Arctic ACE Validation Campaigns. Pre-vious comparisons between trace gas columns measured by the DA8, PARIS-IR and ACE-FTS from 2004–2006 have been presented in Fu et al. (2008) and Sung et al. (2010). As in previous validation activities, this work uses ACE-FTS v2.2 + O3, HDO and N2O5updates.
3.3 Derived meteorological products
Solar absorption measurements sample the air mass between the sun and the instrument along the line-of-sight. During the spring period, the solar zenith angle is large, and as such, the air mass being sampled at a given altitude may be a consider-able distance from the instrument itself. To account for this, especially when considering the polar vortex and changes in chemistry occurring around its edge, meteorological prod-ucts are derived at locations along the line-of-sight using the GEOS Version 5.0.1 (GEOS-5) analyses (Reinecker et al., 2007). These products are Derived Meteorological Products (DMPs), and in this work, have been calculated for both the ground- and satellite- based measurements at series of alti-tudes in the stratosphere, namely at 14, 18, 20, 22, 24, 26,
30, 36 and 46 km, with ground-based line-of-sight calcula-tions as described in Fu et al. (2008) and satellite-based cal-culations as described in Manney et al. (2007). The DMPs include temperature, pressure, winds, potential temperature and scaled potential vorticity. A full description of the data set used can be found in Manney et al. (2007). Scaled po-tential vorticity (sPV) from the DMPs has been used in this work to differentiate the extra- and inner-vortex air masses at each altitude. An sPV of 1.2×10⁻⁴s−1 has been used as a proxy for the outer edge of the polar vortex, while an sPV of 1.6×10⁻⁴s−1has been used for the inner edge (e.g., Manney et al., 2008).
4 Ground-based spectrometer intercomparison 4.1 Methodology
The 2007 and 2008 campaigns were designed to provide the best instrument comparison conditions possible for the time of the year. As previously discussed, the three FTIR spec-trometers shared a solar tracker, with the lower-resolution PARIS-IR measuring simultaneously with the alternately measuring 125HR and DA8 high-resolution instruments. Measurements with the high-resolution instruments were made successively with matching filters, in order to reduce the time between compared measurements, while PARIS-IR measured the full spectral range simultaneously.
compared with stringent requirements for spatial and tempo-ral agreement. PARIS-IR measurements were made simul-taneously with those of the other two instruments, thus in-dividual PARIS-IR measurements were compared with the corresponding DA8 and 125HR measurements that were less than six minutes apart in starting time. This represents the time taken for one PARIS-IR measurement. DA8 and 125HR measurements were recorded alternately, due to their larger solar beam requirements, and as such the time between com-pared measurements was necessarily larger. A limitation of 15 min between start times, allowing for the twelve minute interferogram recording time of the DA8 plus a couple of minutes to physically switch the beam between instruments, has been used.
While the 125HR and DA8 have near-identical spectral resolutions, and thus also see the atmosphere in a very sim-ilar way, PARIS-IR has a significantly lower spectral reso-lution. This results in a retrieved atmospheric profile that is less vertically resolved and more strongly influenced by the a priori profile than that retrieved by the higher-resolution instruments. The effect of this reduced resolution has been investigated in this work. Comparisons were first made with-out accounting for the difference in resolution in the re-trieved profile, and were then repeated using total columns for the high-resolution instruments that were smoothed us-ing the PARIS-IR averagus-ing kernel, as described in Rodgers and Connor (2003). To do this, each profile retrieved by the higher-resolution instruments was interpolated to the IR retrieval grid and smoothed using a representative PARIS-IR averaging kernel and a priori VMR profile, following Eq. (1) (reproduced from Rodgers and Connor, 2003, Eq. 4): xs=xa+A(xh−xa) (1) wherexs is the smoothed profile,xais the PARIS-IR a priori profile (which, in this case, was identical to that used by the other two instruments), A is the PARIS-IR averaging kernel andxh is the high-resolution instrument’s retrieved profile. Total columns were then determined from the smoothed pro-file, using air mass densities derived from the daily pressure and temperature profiles measured over Eureka (Batchelor et al., 2009).
4.2 Results and discussion
Total column measurements of O3, HCl, ClONO2, HNO3
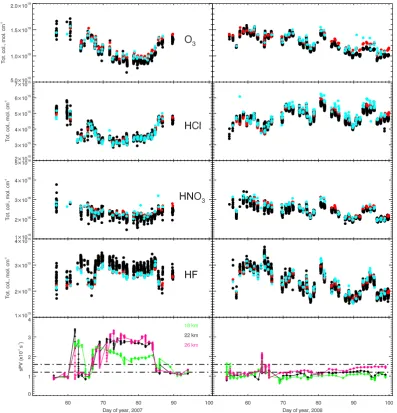
and HF, as retrieved without accounting for the smoothing in the lower-resolution PARIS-IR, are shown in Fig. 1 for the 2007 and 2008 campaigns. Note that the very weak ClONO2
absorption features mean that retrievals are not reliable for PARIS-IR, and thus have not been included. Also shown in Fig. 1 is the scaled potential vorticity through the mid-stratosphere (at 18, 22 and 26 km), indicating the conditions of the measurements relative to the vortex edge. The very different dynamical conditions over Eureka during these two years are clear, with measurements in 2007 being made well
inside the polar vortex from approximately days 67 to 83, and measurements during 2008 being made no further in than the edge of the vortex region throughout the campaign. Thus measurements made during 2007 are more likely to sample air that has been subject to ozone-depleting chemical pro-cesses than those made during 2008. Consistent between the two years, however, is the comparison between the three FTIR spectrometers. The DA8 and 125HR show excellent agreement, with mean discrepancies less than 3.5% and with the range of variation over each spring in all of the gases be-ing well captured. The agreement with PARIS-IR is more variable. For O3and HCl, the comparison is very good (with
mean differences of∼2 and 5% respectively), while there is an obvious bias in the HNO3results. Through both years,
PARIS-IR consistently underestimates the total column of this gas relative to the other instruments, with the bias being greater when the HNO3column is large. In HF, there are high
biases in the PARIS-IR data relative to the higher-resolution instruments at the highest solar zenith angles, early in the campaigns, but these disappear by about day 75 when the sun is slightly higher in the sky.
From the properties of the HNO3bias, we suspected that
the cause of the difference between the FTIR spectrome-ters was due to a higher contribution of the a priori to the lower-resolution instrument’s retrievals. During this time of year, our climatological mean a priori column (derived from the SPARC 2000 climatology averaged over latitudes greater than 68◦N during the sunlit parts of the year) is considerably lower than the real HNO3columns, which have been
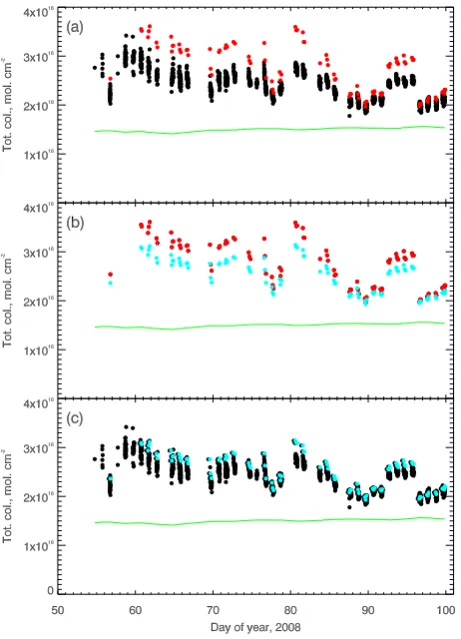
build-ing up throughout the polar night. If this was indeed a ma-jor cause of the discrepancy, then smoothing the profiles re-trieved with the higher-resolution instruments by the PARIS-IR averaging kernel and a priori profile should result in a better comparison. Figure 2 illustrates the smoothing pro-cess. In the top panel, the unsmoothed 125HR HNO3 total
columns for 2008 are shown with the corresponding PARIS-IR columns. The a priori column is also plotted, showing clearly that the a priori is much lower than the columns re-trieved from the measurements. The slight variation in the a priori column from day to day reflects the changing atmo-spheric density profile. The middle panel shows the 125HR HNO3columns before (red) and after (cyan) they have been
smoothed using Eq. (1). The smoothing effect inherent in the lower-resolution PARIS-IR retrievals is clear – the smoothed 125HR measurements are typically much closer to the a pri-ori than the unsmoothed ones. The new comparison between PARIS-IR and the 125HR (smoothed) is shown in the bottom panel, and the improvement in the comparison is significant. A correlation plot highlighting the improvement in the cor-relation between the HNO3columns after the smoothing is
shown in Fig. 3.
Fig. 1. Time series showing total column densities of (from top to bottom): O3, HCl, ClONO2, HNO3and HF for the 2007 (left panels) and
2008 (right panels) campaigns. 125HR measurements are shown in red, DA8 in cyan and PARIS-IR in black. The scaled potential vorticity (sPV) at 18, 22 and 26 km is shown in the bottom panel for each year, with approximate locations of the vortex inner and outer edges marked by the dot-dashed lines. Error bars are omitted for clarity. See Table 1 for total uncertainties.
due to the lower information content in the PARIS-IR mea-surements. The smoothing effects of the instruments are, however, largely taken into consideration in the error bud-get, with higher quoted uncertainties for the PARIS-IR total columns (Table 1) reflecting the higher uncertainty relating to the greater smoothing in these measurements.
The smoothing process was applied to the retrieved 125HR and DA8 profiles in a similar manner for each of the other gases, and the revised time series (excluding ClONO2)
Fig. 2. Illustration of the smoothing process defined by Eq. (1). (a) shows the total HNO3column measured by the 125HR in red,
and by PARIS-IR in black. The a priori column is shown by the green line. (b) shows the same 125HR measurements in red, and the resulting 125HR measurements after smoothing via Eq. (1) in cyan. (c) shows the new comparison between the smoothed 125HR (cyan) and PARIS-IR (black).
For the two gases for which the biggest biases were seen in Fig. 1, notably HNO3 and HF, the agreement between
the three spectrometers is substantially improved by account-ing for the differences in vertical resolution. Unfortunately the difference in O3columns increases following smoothing
with the PARIS-IR averaging kernels as the smoothing error had masked other sources of difference in the measurements. These measurement differences may include extra sensitiv-ity of PARIS-IR retrievals to saturated features (caused by the extremely long path length at this time of year), detector linearity differences and real differences in the vertical dis-tribution of the gas in parts of the atmosphere along the line-of-sight which are not well captured by the lower-resolution instrument (but are, as shown by the very high DOFS in Ta-ble 1, well represented by the high-resolution instruments, resulting in substantial changes to the column after smooth-ing). Fortunately the difference in total columns between the instruments is still fairly small, and, as for all of the com-pared gases after smoothing, well within the error estimates of the individual measurements.
After accounting for the larger smoothing effect of the lower resolution PARIS-IR, the total column differences be-tween the three spectrometers are less than 3.5% for the 125HR and DA8, and less than 6.5% for the comparisons between the 125HR or DA8 and the PARIS-IR. These dif-ferences are comparable in magnitude with other side-by-side instrument comparisons carried out at Eureka (Fu et al., 2008; Paton-Walsh et al., 2009; Batchelor et al., 2009) and around the globe (Goldman et al., 1999; Griffiths et al., 2005; Wunch et al., 2007).
5 Ground- and satellite-based spectrometer intercomparison
5.1 Methodology
Having shown that measurements from the three ground-based spectrometers are comparable, validation of the satellite-based ACE-FTS has been carried out using just the new 125HR, which has high spectral resolution, low uncer-tainties and more measurements than the DA8. Spectra were considered coincident if the 125HR and ACE-FTS measure-ments were recorded within 12 hours and the distance be-tween the ACE 30-km tangent point and PEARL was less than 1000 km.
Due to the difference in altitude sensitivity between the two instruments, partial, rather than total, column densities have been compared using ACE-FTS profiles smoothed to the resolution of the 125HR, as described by Eq. (1). As in previous validation activities, for this comparison, each ACE-FTS profile was linearly interpolated from the 1 km-spaced ACE grid to the 38-layer altitude grid used for the 125HR retrievals, and then smoothed with the 125HR aver-aging kernel and a priori profile corresponding to the match-ing 125HR spectrum. In the tropospheric region where no ACE-FTS data were available, the profile values were filled with the corresponding 125HR’s a priori profile for the calcu-lation. Partial columns were then determined for each mea-surement pair for the altitude range for which ACE-FTS data existed for that measurement and where the sensitivity of the 125HR measurement, as determined from the sums of each row of the averaging kernel matrix, was at least 0.5 (Vigouroux et al., 2007; Wolff et al., 2008; Kerzenmacher et al., 2008).
Comparisons were made for O3, HCl, HF, HNO3, and
ClONO2, with the mean and standard deviation of the
dif-ferences between each pair of ACE-FTS and 125HR partial column values calculated. While the exact altitude range included in the partial column varied from pair to pair, these typically ranged from approximately 6–43 km (O3), 8–
38 km (HCl), 15–26 km (ClONO2), 8–29 km (HNO3) and
Fig. 3. Total column HNO3plots demonstrating the correlation between each combination of the three instruments, before (red) and after
(cyan) smoothing of the high-resolution measurements by the PARIS-IR averaging kernel. The 1-to-1 line is shown in black. (a) PARIS-IR (y-axis) vs 125HR (x-axis); (b) 125HR (y-axis) vs DA8 (x-axis); (c) PARIS-IR (y-axis) vs DA8 (x-axis). Note that no smoothing is necessary for the 125HR-DA8 comparison, as they are already at the same resolution. Slopes and correlation coefficients are given in Table 2.
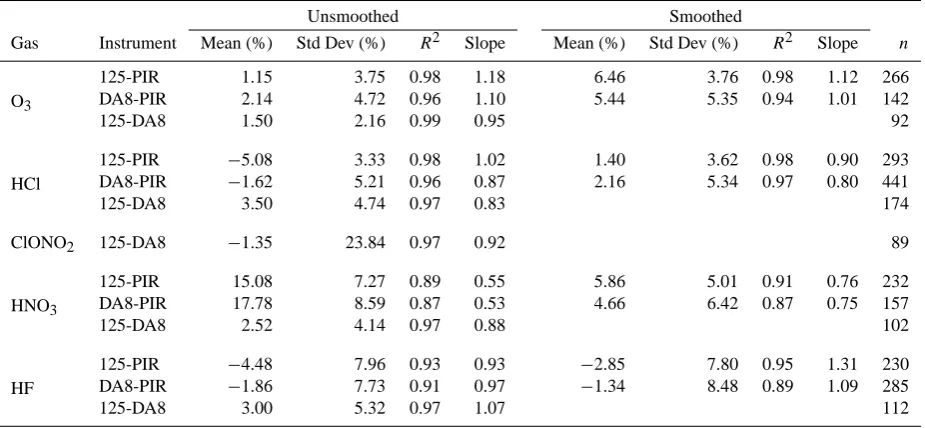
Table 2. Comparisons between the three ground-based spectrometers, conducted using both unsmoothed, and smoothed 125HR and DA8
to-tal columns from 2007 and 2008, as described in the text. Note that no smoothing is necessary for the 125HR-DA8 comparisons, as they have the same resolution. Difference = (inst 1 – inst 2)/0.5(inst 1 + inst 2), and Mean = mean of these differences, calculated as a percentage. One standard deviation from the mean is also shown (Std Dev). The instrument names have been abbreviated: 125 = 125HR, and PIR = PARIS-IR.
R2and Slope are derived from correlation plots, examples of which are shown in Fig. 3.nindicates the number of matched pairs included in the statistics.
Unsmoothed Smoothed
Gas Instrument Mean (%) Std Dev (%) R2 Slope Mean (%) Std Dev (%) R2 Slope n
O3
125-PIR 1.15 3.75 0.98 1.18 6.46 3.76 0.98 1.12 266 DA8-PIR 2.14 4.72 0.96 1.10 5.44 5.35 0.94 1.01 142
125-DA8 1.50 2.16 0.99 0.95 92
HCl
125-PIR −5.08 3.33 0.98 1.02 1.40 3.62 0.98 0.90 293 DA8-PIR −1.62 5.21 0.96 0.87 2.16 5.34 0.97 0.80 441 125-DA8 3.50 4.74 0.97 0.83 174
ClONO2 125-DA8 −1.35 23.84 0.97 0.92 89
HNO3
125-PIR 15.08 7.27 0.89 0.55 5.86 5.01 0.91 0.76 232 DA8-PIR 17.78 8.59 0.87 0.53 4.66 6.42 0.87 0.75 157 125-DA8 2.52 4.14 0.97 0.88 102
HF
125-PIR −4.48 7.96 0.93 0.93 −2.85 7.80 0.95 1.31 230 DA8-PIR −1.86 7.73 0.91 0.97 −1.34 8.48 0.89 1.09 285 125-DA8 3.00 5.32 0.97 1.07 112
5.2 Results and discussion
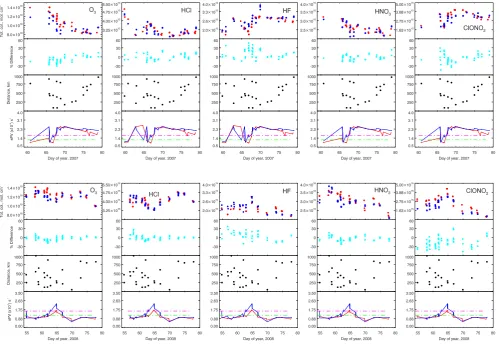
Figure 5 shows the partial columns, the percentage differ-ences between the ACE-FTS and 125HR measurements (us-ing (ACE-FTS – 125HR)/125HR), the distance between the two measurements, and the sPV for each of the gases for 2007 (top) and 2008 (bottom) respectively. The sPV along the line-of-sight has been determined for both the ACE-FTS and the 125HR as described in Sect. 3. From the number density profiles of each gas, it was determined that peak val-ues were typically at approximately 18 km, thus sPV valval-ues from that altitude were used as a proxy for the dynamical conditions being experienced for each measurement.
Fig. 4. Same as Fig. 1, with 125HR and DA8 smoothed to match the PARIS-IR resolution. Comparison statistics are given in Table 2.
Table 3. Mean percentage differences between ACE-FTS and 125HR partial columns (calculated as described in the text), one standard
deviation from the mean (also as a percentage), standard error on the mean (standard deviation/√n), and the number of pairs of measurements (n) used in these calculations, for both 2007 and 2008. Note that the partial column altitude ranges varied for each individual comparison, but were typically around 6–43 km (O3), 8–38 km (HCl), 15–26 km (ClONO2), 8–29 km (HNO3) and 10–43 km (HF).
2007 2008
Mean Standard Standard n Mean Standard Standard n
(%) deviation (%) error (%) (%) deviation (%) error (%) O3 −7.45 10.60 1.56 46 −4.26 6.30 0.81 60
HCl 0.28 9.76 1.30 56 −1.93 7.67 0.94 67 ClONO2 −4.94 15.98 2.41 44 −17.60 16.92 2.22 58
HNO3 −1.55 8.66 1.32 43 −4.90 7.85 1.05 56
Fig. 5. Time series from 2007 (top plots) and 2008 (bottom plots) for (from left to right) O3, HCl, HF, HNO3and ClONO2. For each sub-plot, from top to bottom: Partial columns determined for ACE-FTS (blue) and 125HR (red); the percentage difference between the ACE-FTS and 125HR partial columns ((ACE-FTS – 125HR)/125HR); the distance between the two measurements as measured from the ACE 30-km tangent point to PEARL; and the sPV for both ACE-FTS (red) and 125HR (blue) at 18 km. The vortex edge region is marked by green dashed (outer) and magenta dashed (inner) lines.
From Table 3, some significant differences in the mean and especially in the standard deviation can be seen between the two years, with the more dynamically variable 2007 in most cases showing greater scatter in the differences (as seen by both the standard deviation and standard error) than in the more dynamically quiet 2008. We believe this reflects the number of measurements that capture spectra measured in different locations relative to the location of the polar vor-tex. In almost no cases (HCl in 2007 being the exception) are these measurements in agreement within the standard error. While the mean differences determined by this comparison are comparable to those determined in previous ACE-FTS validation exercises, we took the investigation a step further to better single out measurement pairs that should be compa-rable due to well-matched atmospheric conditions, thus im-proving our confidence in the quality of the comparison.
Looking first at the distance-between-measurements cri-terion, we determined that the 1000-km cricri-terion, as mea-sured from the ACE 30-km tangent point to the station, was
not a particularly accurate representation of the distance be-tween the actual air masses being sampled. Based on the derived meteorological product determinations of the lon-gitude and latitude along the lines-of-sight of the measure-ment, we found that some measurements meeting the 1000-km criterion were actually sampling air masses that were more than 1000 km apart, while other measurements which sampled air masses that were closer than 1000 km together were being excluded. An example of this is shown in Fig. 6, which shows two sets of differences for the 2007 O3
Fig. 6. Distance between comparable ACE-FTS and 125HR
mea-surements, as measured from the ACE 30-km tangent point to PEARL (black) and from the measurement location at 18 km for both instruments (orange).
1000 km based on the distance between measurement points within the partial column. We also investigated the time cri-terion, but found little difference in the combinations that would be used for the comparison if the time criterion was set for 6, 12 or 18 h. This was a result of the limitation of sun-light for the ground-based instruments and the sunrise/sunset viewing geometry of the ACE-FTS.
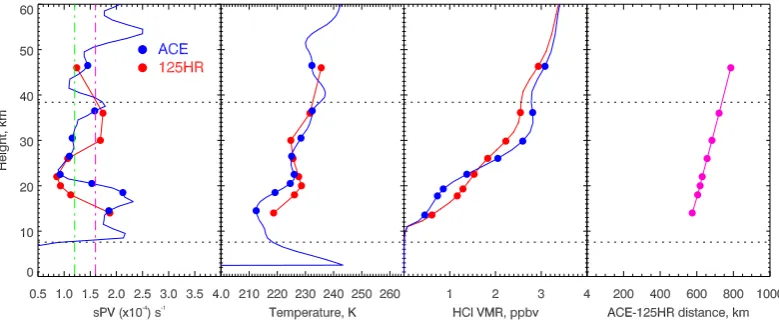
To further refine the comparisons, for each pair, a plot of the sPV at each of the eight DMP altitudes along the line-of-sight for each instrument was constructed, with only those altitudes within the corresponding partial column altitude range being considered. Additional plots showing the tem-perature at each DMP location, the retrieved volume mixing ratio, and the distance between the measurement points were constructed. Examples of two of these plots, one showing a good match, and one showing a poor match, are shown in Figs. 7 and 8 respectively.
From these plots, we were able to determine whether the measurement conditions being sampled by the two instru-ments were similar throughout the height range of each com-parison. The sPV and temperature profiles provided key information on the air mass with respect to the polar vor-tex and likely chemical processing conditions within, while the distance plot provided a measure of the physical separa-tion of the sampled air masses. The retrieved VMR profiles provided additional information on where in the partial col-umn the measurements were diverging. Note that the pro-files shown for the ACE-FTS are the smoothed propro-files, thus the smoothing effect of the 125HR has been taken into con-sideration. From the plots, it was clear that the sPV along the lines-of-sight was an important comparison criterion, as cases when both measurements were inside or both were out-side, or even both measured through the vortex edge typically showed good agreement in the partial columns, while pairs for which the sPV was divergent typically had poorer agree-ment, as would be expected from the different air masses sampled. Temperature served as an additional important criterion, as within the polar vortex, chemical processing is highly dependent on temperature. As such, significant
differences in temperature along the lines-of-sight for the two profiles, even when the sPV is similar, can indicate large dif-ferences in the sampled air masses.
Using the information gained by the plots, more rigor-ous coincidence criteria were developed to better identify comparable measurement pairs. While the temporal crite-rion of 12 h remained, the spatial coincidence critecrite-rion was tightened, requiring the distance between the measurement points at each of the DMP altitudes (rather than solely for the ACE 30-km tangent point to PEARL) to be within 1000 km. Differences in sPV between the two measurements at each altitude along the line-of-sight were restricted to less than 0.3×10⁻⁴s−1, ensuring that the air masses relative to the po-lar vortex edge were simipo-lar for both measurements. Finally, the maximum temperature difference at each altitude point was set to 10 K. The values of these criteria were selected to limit the likelihood of the measurements sampling different air masses, while ensuring that there were sufficient pairs of measurements remaining for a meaningful comparison.
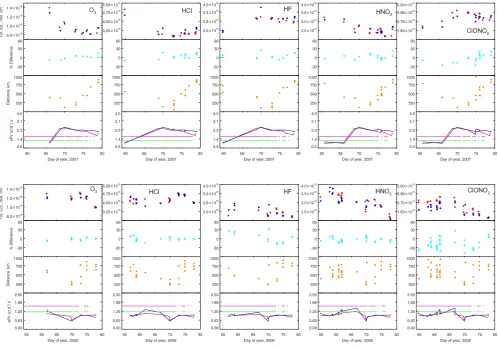
Figure 9 shows the comparison between those measure-ments remaining after the new criteria were applied, with the mean percentage differences, standard deviations, and stan-dard errors shown in Table 4. It can be seen that these strin-gent comparison requirements have significantly reduced the number of pairs contributing to the comparisons, particu-larly in 2007 when measurements made at Eureka were fre-quently near the edge of the polar vortex. However, both the mean differences and standard deviations between the two measurements have typically been reduced, and we are confident that these measurement pairs are highly compara-ble. The bias is seen to be zero within the standard error for O3, ClONO2 and HNO3in 2007, with ACE showing a
slight high bias of approximately 5% in HCl and HF, which is comparable with that seen in previous ACE comparisons (Mahieu et al., 2008). In 2008, the HCl and HF biases are non-significant (within standard error), however negative bi-ases are seen in the other gbi-ases. The greater standard devi-ation in ClONO2reflects the difficulty of this retrieval,
par-ticularly when the column of ClONO2is low (common
out-side the polar vortex, thus dominant in the 2008 comparison). This was previously demonstrated in Wolff et al. (2008), who described large standard deviations and found a wide range of biases between ACE-FTS and ground-based FTIR mea-surements around the globe, with no discernible trend. A slight negative bias in ACE HNO3was also reported in that
study (Wolff et al, 2008), comparable in magnitude to that obtained here.
Fig. 7. Sample plots for determining the comparability of ACE-FTS and 125HR measurements. Plots from left to right show (a) the sPV
(with inner and outer edge of the vortex marked with magenta and green dashed lines respectively), (b) temperature, (c) HCl VMR profile (where the ACE-FTS profile has been smoothed to match the 125HR), and (d) distance between ACE-FTS and 125HR measurements, with data being determined from DMPs along the lines-of-sight of each instrument. Dotted lines indicate the altitude range for the partial column used in this comparison. ACE-FTS information is shown in blue, and 125HR is shown in red. This example shows a well-matched comparison between HCl measurements made on the 13 March 2007. The difference in the 9.82–38.40 km partial columns is 1.4%.
Fig. 8. As for Fig. 6, but demonstrating a less-well-matched comparison pair recorded on the 6 March 2007. Note the differences in sPV at
30 and 18 km, with the two instruments each sampling a combination of air masses located inside and outside the polar vortex. The difference between the two measurements over the 11.02–38.40 km partial column is 10.0%.
one of the years within standard error. As such, we can con-fidently say that the ACE-FTS shows excellent agreement with ground-based spectroscopic measurements made in the highly-variable spring-time northern polar stratosphere.
6 Conclusions
The 2007 and 2008 Canadian Arctic ACE Validation Cam-paigns at Eureka, Nunavut, have provided an excellent opportunity to compare measurements by four Fourier transform infrared spectrometers during the highly-variable Arctic polar sunrise period. Comparisons between the three ground-based FTIR spectrometers have shown small inter-instrumental differences well within the estimated uncertainties of the measurements and consistent with
side-by-side intercomparisons conducted around the world. Total column trace gas measurements of O3, HCl, ClONO2,
HF and HNO3 made with the higher-resolution CANDAC
Bruker 125HR were shown to compare with the comparable resolution Environment Canada ABB Bomem DA8 to within 3.5%. Measurements of O3, HCl, HF and HNO3from both
Fig. 9. As for Fig. 5, but with those comparison pairs remaining after tightened criteria have been applied. Note that the distances shown in
this plot are now the distance between the measurements along the lines-of-sight at 18 km, as described in the text.
Table 4. As for Table 3, but for pairs remaining after applying rigorous co-location criteria.
2007 2008
Mean Standard Standard n Mean Standard Standard n
(%) deviation (%) error (%) (%) deviation (%) error (%) O3 1.11 6.57 2.08 10 −1.51 4.30 1.15 14
HCl 4.86 8.05 2.01 16 −0.23 5.38 1.12 23 ClONO2 −2.86 14.24 3.56 16 −15.33 22.62 3.72 37
HNO3 1.09 8.36 2.03 17 −4.77 6.97 1.23 32 HF 5.23 8.88 2.37 14 1.14 16.81 14.34 15
Validation of the ACE-FTS v2.2 (with O3, N2O5and HDO
updates) results from this time was also carried out with the 125HR. Strict coincidence criteria for use around the polar vortex were determined, utilizing DMP data along the lines-of-sight of both instruments. These criteria were: measure-ment times less than 12 h; distance between measuremeasure-ment points at multiple altitudes within the partial column less than 1000 km; differences in sPV between measurements
at multiple altitudes within the partial column less than 0.3×10⁻⁴s−1; and temperature differences at each alti-tude less than 10 K. After applying these criteria, the mean biases between the ACE-FTS and 125HR for 2007/2008 were 1.1/−1.5%, 4.9/−0.2%,−2.9/−15.3%, 1.1/−4.8% and 5.2/1.1% for O3, HCl, ClONO2, HNO3, and HF respectively.
and low biases in HNO3, ClONO2 and O3 in 2008. Thus
it can be concluded that satellite validation can be conducted with ground-based measurements made around the polar vor-tex edge, provided that comparison criteria are enhanced to account for vortex conditions along the line-of-sight, and that no annually-consistent bias can be identified in the ACE-FTS partial columns at this time of year.
Acknowledgements. This work would not have been possible
without the support of the Canadian Space Agency (CSA), the Environment Canada (EC) Eureka Weather Station, and the Canadian Network for the Detection of Atmospheric Change (CANDAC). We particularly acknowledge the assistance of the CANDAC Operations Team, James Drummond (Principal Investigator), Pierre Fogal (PEARL Facilities Manager), Ash-ley Harrett, Alexei Khmel, Paul Loewen, Oleg Mikhailov and Matt Okraszewski for their assistance in collecting the measure-ments and transporting us between the lab and the station, and the EC meteorological technicians for launching many radio-and ozone-sonde balloons for us. The Canadian Arctic ACE Validation Campaigns are supported by the CSA, EC, Natural Sciences and Engineering Research Council (NSERC) and the Northern Scientific Training Program. CANDAC and PEARL are funded by the Atlantic Innovation Fund/Nova Scotia Research Innovation Trust, Canadian Foundation for Climate and Atmo-spheric Sciences (CFCAS), Canadian Foundation for Innovation, CSA, EC, Government of Canada IPY funding, NSERC, Ontario Innovation Trust, Ontario Research Fund and the Polar Continental Shelf Program. Work carried out at the Jet Propulsion Laboratory, California Institute of Technology was done under contract with the National Aeronautics and Space Administration. The Atmospheric Chemistry Experiment, also known as SCISAT, is a Canadian-led mission mainly supported by the CSA and NSERC.
Edited by: H. Worden
References
Batchelor, R. L., Strong, K., Lindenmaier, R. L., Mittermeier, R., Fast, H., Drummond, J. R., and Fogal, P. F.: A new Bruker IFS 125HR FTIR spectrometer for the Polar Environment Atmospheric Research Laboratory at Eureka, Canada -measurements and comparison with the existing Bomem DA8 spectrometer, J. Atmos. Oceanic Technol., 26, 1328–1340, doi:10.1175/2009JTECHA1215.1, 2009.
Bernath, P. F., McElroy, C. T., Abrams, M. C., Boone, C. D., Butler, M., Camy-Peyret, C., Carleer, M., Clerbaux, C., Coheur, P.-F., Colin, R., DeCola, P., DeMaziere, M., Drummond, J. R., Dufour, D., Evans, W. F. J., Fast, H., Fussen, D., Gilbert, K., Jennings, D. E., Llewellyn, E. J., Lowe, R. P., Mahieu, E., McConnell, J. C., McHugh, M., McLeod, S. D., Michaud, R., Midwinter, C., Nas-sar, R., Nichitiu, F., Nowlan, C., Rinsland, C. P., Rochon, Y. J., Rowlands, N., Semeniuk, K., Simon, P., Skelton, R., Sloan, J. J., Soucy, M.-A., Strong, K., Tremblay, P., Turnbull, D., Walker, K. A., Walkty, I., Wardle, D. A., Wehrle, V., Zander, R., and Zou, J.: Atmospheric Chemistry Experiment (ACE): Mission Overview, Geophys. Res. Lett., 32, L15S01, doi:10.1029/2005GL022386, 2005.
Boone, C. D., Nassar, R., Walker, K. A., Rochon, Y., McLeod, S. D., Rinsland, C. P., and Bernath, P. F.: Retrievals for the Atmo-spheric Chemistry Experiment Fourier Transform Spectrometer, Appl. Opt., 44, 7218–7231, 2005.
Dils, B., De Mazi`ere, M., M¨uller, J. F., Blumenstock, T., Buchwitz, M., de Beek, R., Demoulin, P., Duchatelet, P., Fast, H., Franken-berg, C., Gloudemans, A., Griffith, D., Jones, N., Kerzenmacher, T., Kramer, I., Mahieu, E., Mellqvist, J., Mittermeier, R. L., Notholt, J., Rinsland, C. P., Schrijver, H., Smale, D., Strandberg, A., Straume, A. G., Stremme, W., Strong, K., Sussmann, R., Tay-lor, J., van den Broek, M., Velazco, V., Wagner, T., Warneke, T., Wiacek, A., and Wood, S.: Comparisons between SCIAMACHY and ground-based FTIR data for total columns of CO, CH4, CO2
and N2O, Atmos. Chem. Phys., 6, 1953–1976, 2006,
http://www.atmos-chem-phys.net/6/1953/2006/.
Donovan, D. P., Fast, H., Makino, Y., Bird, J. C., Carswell, A. I., Davies, J., Duck, T. J., Kaminski, J. W., McElroy, C. T., Mitter-meier, R. L., Pal, S. R., Savastiouk, V., Velkov, D., and White-way, J. A.: Ozone, Column ClO, and PSC Measurements made at the NDSC Eureka Observatory (80◦N, 86◦W) during the Spring of 1997, Geophys. Res. Lett., 24, 2709–2712, 1997.
Dupuy, E., Walker, K. A., Kar, J., Boone, C. D., McElroy, C. T., Bernath, P. F., Drummond, J. R., Skelton, R., McLeod, S. D., Hughes, R. C., Nowlan, C. R., Dufour, D. G., Zou, J., Nichitiu, F., Strong, K., Baron, P., Bevilacqua, R. M., Blumenstock, T., Bodeker, G. E., Borsdorff, T., Bourassa, A. E., Bovensmann, H., Boyd, I. S., Bracher, A., Brogniez, C., Burrows, J. P., Catoire, V., Ceccherini, S., Chabrillat, S., Christensen, T., Coffey, M. T., Cortesi, U., Davies, J., De Clercq, C., Degenstein, D. A., De Mazi`ere, M., Demoulin, P., Dodion, J., Firanski, B., Fis-cher, H., Forbes, G., Froidevaux, L., Fussen, D., Gerard, P., Godin-Beekmann, S., Goutail, F., Granville, J., Griffith, D., Ha-ley, C. S., Hannigan, J. W., H¨opfner, M., Jin, J. J., Jones, A., Jones, N. B., Jucks, K., Kagawa, A., Kasai, Y., Kerzenmacher, T. E., Kleinb¨ohl, A., Klekociuk, A. R., Kramer, I., K¨ullmann, H., Kuttippurath, J., Kyr¨ol¨a, E., Lambert, J.-C., Livesey, N. J., Llewellyn, E. J., Lloyd, N. D., Mahieu, E., Manney, G. L., Mar-shall, B. T., McConnell, J. C., McCormick, M. P., McDermid, I. S., McHugh, M., McLinden, C. A., Mellqvist, J., Mizutani, K., Murayama, Y., Murtagh, D. P., Oelhaf, H., Parrish, A., Petelina, S. V., Piccolo, C., Pommereau, J.-P., Randall, C. E., Robert, C., Roth, C., Schneider, M., Senten, C., Steck, T., Strandberg, A., Strawbridge, K. B., Sussmann, R., Swart, D. P. J., Tarasick, D. W., Taylor, J. R., T´etard, C., Thomason, L. W., Thompson, A. M., Tully, M. B., Urban, J., Vanhellemont, F., Vigouroux, C., von Clarmann, T., von der Gathen, P., von Savigny, C., Waters, J. W., Witte, J. C., Wolff, M., and Zawodny, J. M.: Validation of ozone measurements from the Atmospheric Chemistry Exper-iment (ACE), Atmos. Chem. Phys., 9, 287–343, 2009,
http://www.atmos-chem-phys.net/9/287/2009/.
Fast, H., Mittermeier, R. L., and Makino, Y.: A ten-year record of Arctic trace gas total column measurements at Eureka, from 1997 to 2006, using the Bomem DA8 Fourier transform spectrometer, in preparation, 2010.
Fraser, A., Goutail, F., Strong, K., Bernath, P. F., Boone, C., Daf-fer, W. H., Drummond, J. R., Dufour, D. G., Kerzenmacher, T. E., Manney, G. L., McElroy, C. T., Midwinter, C., McLinden, C. A., Nichitiu, F., Nowlan, C. R., Walker, J., Walker, K. A., Wu, H., and Zou, J.: Intercomparison of UV-visible measurements of ozone and NO2during the Canadian Arctic ACE validation cam-paigns: 2004–2006, Atmos. Chem. Phys., 8, 1763–1788, 2008, http://www.atmos-chem-phys.net/8/1763/2008/.
Fu, D., Walker, K. A., Mittermeier, R. L., Strong, K., Sung, K., Fast, H., Bernath, P. F., Boone, C. D., Daffer, W. H., Fogal, P., Kolon-jari, F., Loewen, P., Manney, G. L., and Mikhailov, O.: Simulta-neous atmospheric measurements using two Fourier transform infrared spectrometers at the Polar Environment Atmospheric Research Laboratory during spring 2006, and comparisons with the Atmospheric Chemistry Experiment-Fourier Transform Spectrometer, Atmos. Chem. Phys. Discuss., 8, 5305–5358, 2008, http://www.atmos-chem-phys-discuss.net/8/5305/2008/. Goldman, A., Paton-Walsh, C., Bell, W., Toon, G. C., Blavier,
J.-F., Sen, B., Coffey, M. T., Hannigan, J. W., and Mankin, W. G.: Network for the Detection of Stratospheric Change Fourier transform infrared intercomparison at Table Mountain Facility, November 1996, J. Geophys. Res., 104, 30481–30503, 1999. Griffith, D. W. T., Jones, N. B., McNamara, B., Walsh, C. P., Bell,
W., and Bernardo, C.: Intercomparison of NDSC Ground-Based Solar FTIR Measurements of Atmospheric Gases at Lauder, New Zealand, J. Atmos. Oceanic Technol., 20, 1138–1153, 2003. Kerzenmacher, T. E., Walker, K. A., Strong, K., Berman, R.,
Bernath, P. F., Boone, C. D., Drummond, J. R., Fast, H., Fraser, A., MacQuarrie, K., Midwinter, C., Sung, K., McElroy, C. T., Mittermeier, R. L., Walker, J., and Wu, H. J.: Measurements of O3, NO2and temperature during the 2004 Canadian Arctic ACE Validation Campaign, Geophys. Res. Lett., 32, L16S07, doi:10.1029/2005GL023032, 2005.
Kerzenmacher, T., Wolff, M. A., Strong, K., Dupuy, E., Walker, K. A., Amekudzi, L. K., Batchelor, R. L., Bernath, P. F., Berthet, G., Blumenstock, T., Boone, C. D., Bramstedt, K., Brogniez, C., Brohede, S., Burrows, J. P., Catoire, V., Dodion, J., Drummond, J. R., Dufour, D. G., Funke, B., Fussen, D., Goutail, F., Grif-fith, D. W. T., Haley, C. S., Hendrick, F., H¨opfner, M., Huret, N., Jones, N., Kar, J., Kramer, I., Llewellyn, E. J., L´opez-Puertas, M., Manney, G., McElroy, C. T., McLinden, C. A., Melo, S., Mikuteit, S., Murtagh, D., Nichitiu, F., Notholt, J., Nowlan, C., Piccolo, C., Pommereau, J.-P., Randall, C., Raspollini, P., Ri-dolfi, M., Richter, A., Schneider, M., Schrems, O., Silicani, M., Stiller, G. P., Taylor, J., T´etard, C., Toohey, M., Vanhellemont, F., Warneke, T., Zawodny, J. M., and Zou, J.: Validation of NO2and
NO from the Atmospheric Chemistry Experiment (ACE), Atmos. Chem. Phys., 8, 5801–5841, 2008,
http://www.atmos-chem-phys.net/8/5801/2008/.
Mahieu, E., Duchatelet, P., Demoulin, P., Walker, K. A., Dupuy, E., Froidevaux, L., Randall, C., Catoire, V., Strong, K., Boone, C. D., Bernath, P. F., Blavier, J.-F., Blumenstock, T., Coffey, M., De Mazi`ere, M., Griffith, D., Hannigan, J., Hase, F., Jones, N., Jucks, K. W., Kagawa, A., Kasai, Y., Mebarki, Y., Mikuteit, S., Nassar, R., Notholt, J., Rinsland, C. P., Robert, C., Schrems,
O., Senten, C., Smale, D., Taylor, J., T´etard, C., Toon, G. C., Warneke, T., Wood, S. W., Zander, R., and Servais, C.: Validation of ACE-FTS v2.2 measurements of HCl, HF, CCl3F and CCl2F2using space-, balloon- and ground-based instrument
observations, Atmos. Chem. Phys., 8, 6199–6221, 2008, http://www.atmos-chem-phys.net/8/6199/2008/.
Manney, G. L., Daffer, W. H., Strawbridge, K. B., Walker, K. A., Boone, C. D., Bernath, P. F., Kerzenmacher, T., Schwartz, M. J., Strong, K., Sica, R. J., Kr¨uger, K., Pumphrey, H. C., Lambert, A., Santee, M. L., Livesey, N. J., Remsberg, E. E., Mlynczak, M. G., and Russell III, J. R.: The high Arctic in extreme winters: vortex, temperature, and MLS and ACE-FTS trace gas evolution, Atmos. Chem. Phys., 8, 505–522, 2008,
http://www.atmos-chem-phys.net/8/505/2008/.
Manney, G. L., Daffer, W. H., Zawodny, J. M., Bernath, P. F., Hop-pel, K. W., Walker, K. A., Knosp, B. W., Boone, C., Rems-berg, E. E., Santee, M. L., Harvey, V. L., Pawson, S., Jackson, D. R., Deaver, L., McElroy, C. T., McLinden, C. A., Drum-mond, J. R., Pumphrey, H. C., Lambert, A., Schwartz, M. J., Froidevaux, L., McLeod, S., Takacs, L. L., Suarez, M. J., Trepte, C. R., Cuddy, D. C., Livesey, N. J., Harwood, R. S., and Wa-ters, J. W.: Solar occultation satellite data and derived me-teorological products: Sampling issues and comparisons with Aura Microwave Limb Sounder, J. Geophys. Res., 112, D24550, doi:10.1029/2007JD008709, 2007.
Meier, A., Paton-Walsh, C., Bell, W., Blumenstock, T., Hase, F., Goldman, A., Steen, A., Kift, R., Woods, P., and Kondo, Y.: Evidence of reduced measurement uncertainties from an FTIR instrument intercomparison at Kiruna, Sweden, J. Quant. Spec-trosc. Radiat. Transfer, 96, 75–84, 2005.
Paton-Walsh, C., Mittermeier, R. L., Bell, W., Fast, H., Jones, N., and Meier, A.: An intercomparison of ground-based solar FTIR measurements of atmospheric gases at Eureka, Canada, J. Atmos. Oceanic Technol., 25, 2028–2036, doi: 10.1175/2008JTECHA1060.1, 2008.
Pougatchev, N. S., Connor, B. J., and Rinsland, C. P.: Infrared mea-surements of the ozone vertical distribution above Kitt Peak, J. Geophys. Res., 100(D8), 16689–16697, 1995.
Rodgers, C. D.: Retrieval of Atmospheric Temperature and Com-position from Remote Measurements of Thermal Radiation, Rev. Geophy. Space Phys., 14, 609–624, 1976.
Rodgers, C. D.: Inverse Methods for Atmospheric Sounding: The-ory and Practice, World Scientific Publishing Co. Pte. Ltd, 238 pp., 2000.
Rodgers, C. D. and Connor, B. J.: Intercomparison of re-mote sounding instruments, J. Geophys. Res., 108(D3), 4116, doi:10.1029/2002JD002299, 2003.
Sung, K., Strong, K., Mittermeier, R. L., Walker, K. A., Fu, D., Kerzenmacher, T., Fast, H., Bernath, P. F., Boone, C. D., Daffer, W. H., Drummond, J. R., Kolonjari, F., Loewen, P., MacQuarrie, K., and Manney, G. L.: Ground-based column measurements at Eureka, Nunavut made with two FT-IR spectrometers in spring 2004 and 2005, and comparisons with the ACE-FTS, in prepara-tion, 2010.
2007, http://www.atmos-chem-phys.net/7/377/2007/.
Wolff, M. A., Kerzenmacher, T., Strong, K., Walker, K. A., Toohey, M., Dupuy, E., Bernath, P. F., Boone, C. D., Brohede, S., Catoire, V., von Clarmann, T., Coffey, M., Daffer, W. H., De Mazi`ere, M., Duchatelet, P., Glatthor, N., Griffith, D. W. T., Hannigan, J., Hase, F., H¨opfner, M., Huret, N., Jones, N., Jucks, K., Kagawa, A., Kasai, Y., Kramer, I., Kllmann, H., Kuttippurath, J., Mahieu, E., Manney, G., McElroy, C. T., McLinden, C., M´ebarki, Y., Mikuteit, S., Murtagh, D., Piccolo, C., Raspollini, P., Ridolfi, M., Ruhnke, R., Santee, M., Senten, C., Smale, D., T´etard, C., Ur-ban, J., and Wood, S.: Validation of HNO3, ClONO2, and N2O5
from the Atmospheric Chemistry Experiment Fourier Transform Spectrometer (ACE-FTS), Atmos. Chem. Phys., 8, 3529–3562, 2008, http://www.atmos-chem-phys.net/8/3529/2008/.
Wunch, D., Taylor, J. R., Fu, D., Bernath, P., Drummond, J. R., Mid-winter, C., Strong, K., and Walker, K. A.: Simultaneous ground-based observations of O3, HCl, N2O, and CH4 over Toronto, Canada by three Fourier transform spectrometers with different resolutions, Atmos. Chem. Phys., 7, 1275–1292, 2007,