and Amount of Daily Rainfall
M. A. B. Barkotulla
Department of Crop Science and Technology University of Rajshahi
Rajshahi-6205, Bangladesh [email protected]
Abstract
Rainfall is the main source of irrigation water in the northwest part of Bangladesh where the inhabitants derive their income primarily from farming. Stochastic rainfall models were concerned with the occurrence of wet day and depth of rainfall. The first order Markov chain model was used to generate the sequence of rainfall occurrence using the method of transitional probability matrices, while daily rainfall amount was generated using a gamma distribution. The model parameters were estimated from historical rainfall records. The shape and scale parameters were estimated by method of moments and hence it became possible to find the parameter values at the study area and then to generate synthetic sequences according to the gamma distribution. The parameters necessary for the whole generation include the means, variance or standard deviation and conditional probabilities of wet and dry days. Results obtained showed that the model could be used to generate rainfall data satisfactorily.
Keywords: Stochastic model, rainfall occurrence, gamma distribution, rainfall generation, transitional probability
1. Introduction
Bangladesh is an agriculture based country where about 80% of its 160 million people are directly or indirectly engaged in a wide range of agricultural activities. Rainfall is the most important natural factor that determines the agricultural production in Bangladesh. The variability of rainfall and the pattern of extreme high or low precipitation are very important for the agriculture as well as the economy of the country. It is well established that the rainfall is changing on both the global and the regional scales (Hulme et al. 1998, Dore 2005, Kayano and Sans´ıgolo 2008) due to global warming. The implications of these changes are particularly significant for Bangladesh where hydrological disasters of one kind or another is a common phenomenon (Banglapedia 2003, Shahid 2008).
The development of a rainfall occurrence model is increasingly in demand, not only for data-generation purposes, but also to provide some useful information in various applications, including water resource management and the hydrological and agricultural sectors. Identifying the appropriate model of daily rainfall occurrence, particularly on the distribution of dry (wet) spells, is very important as almost all of the climate variables are dependent on the rainfall events (Deni and Jemain 2009).
important weather characteristics and they affect agriculture profoundly. In addition to their direct effects on water balance in soil, they are strongly related to other weather variables such as solar radiation, temperature, and humidity, which are also important factors affecting the growth and development of crops, pests, diseases and weeds. However, rainfall data form an essential input into many climatologic studies for agriculture, wherein considerable research focused on rainfall analysis and modeling (Nnaji 2001).
Gabriel and Neumann (1962) started the study on the sequence of daily rainfall occurrence. They found that the daily rainfall occurrence for the Tel Aviv data was successfully fitted with the first-order Markov chain model. Meanwhile, Kottegoda et al. (2004) reported that the first order of the Markov chain model found to fit the observed data in Italy successfully. The model based on the assumption that there is a dependency of the daily rainfall occurrence to that of the previous day. Rainfall is the principal phenomenon driving many hydrological extremes such as floods, droughts, landslides, debris and mud-flows; its analysis and modeling are typical problems in applied hydrometeorology. Rainfall exhibits a strong variability in time and space. Hence its stochastic modeling is not an easy task (De Michele and Bernardara 2005).
Hydrological and crop models usually require daily precipitation time series as input. To evaluate the sensitivity of these models to long term changes in the precipitation regime an ensemble of input data sets are needed. The observed sequences provide only one realization of the weather process. In impact studies that use as input data precipitation time series derived from the simulated climate change scenarios, the number of these sequences are still limited due to high computational cost of these scenarios. To evaluate the range of results that may be obtained with other statistically equivalent series it is desirable to generate synthetic sequences of precipitation data based on the stochastic structure of the meteorological process. Richardson (1981) presented such a technique to simulate daily values of precipitation, maximum and minimum temperature, and solar radiation. For the precipitation component, a two state first - order Markov chain has been used to describe the precipitation occurrence and the exponential distribution has been used to approximate the distribution of rainfall amount. This model has also been used by Wilks (1992) with gamma distribution instead of exponential distribution. In this case the model has been adapted for climate change studies (Wilks 1999, Hayhoe 2000).
2. Study Area and Data collection
Mahadevpur is one the upazila of Naogaon district in the northwest part of Bangladesh with an area of 395.52 sq km. The area is demarcated by longitude from 88°38/ E to 88°53/E and latitude from 24°48/ N to 25°01/ N. More than 80% people are related to agriculture and agricultural labourer. Main crops are paddy, wheat, potato, watermelon, sugarcane, onion, garlic etc.
Figure 1: The map of Naogaon district
Rainfall water that is condensed from the aqueous vapour in the atmosphere and falls in drops from the sky to the earth is called rain; and the total amount of rain that falls in a particular area within a certain time is called rainfall. Daily rainfall time series data from Mahadevpur rainfall station are used for this study. The rainfall records are measured in millimetres (mm). The data used 30 years of daily rainfall records obtained from the Bangladesh Water Development Board (BWDB) during the period 1980-2009. During the study time, mean annual rainfall is 1598 mm with range 2273mm to 1002 mm. It can be seen that November to January has the less average monthly rainfall (7.42 mm) and July has the highest of 355.27 mm.
3. Model
3.1. Rain occurrence
Let X0, X1, X2, …, Xn, be random variables distributed identically and taking only
two values, namely 0 and 1, with probability one, i.e.,
wet is day nth the if 1
dry is day nth the if 0 n X
Firstly, it may be assumed that,
P( Xn+1= xn+1Xn= xn, Xn-1= xn-1, …, X0= x0) = P( Xn+1= xn+1Xn= xn)
where x0, x1, …, xn+1{ 0, 1 }.
In other words, it is assumed that probability of wetness of any day depends only on the previous day was wet or dry. Given the event on previous day, the probability of wetness is assumed independent of further preceding days. So, the stochastic process {Xn} n = 0, 1, 2, … is a Markov chain (Medhi 1981).
Consider the transition matrix as
11 10
01 00
P P
P P
where, Pij= P(X1= jX0= i) i, j = 0, 1 that is P01= the conditional probability of a
wet day following a dry day, P11 = the conditional probability of a wet day
following a wet day. The complementary probabilities for dry day occurrences are given byP00= 1-P01andP10= 1-P11 such that,P00+P01= 1 and P10+P11= 1.
The transition probabilities are considered on a monthly base and then the model requires 24 parameters for the rain event generation (12 for P01 and 12 for P11).
These probabilities are calculated on all the available recordings in the data set as:P01= N01/N0andP11= N11/N1where, N01is the number of wet days after a dry
day in the month; N0 is the total number of dry days in the data set, for the
month; N11is the number of wet days after a wet day in the month; N1is the total
number of wet days in the data set, for the month.
3.2. Stochastic rainfall generation process
Occurrence of a wet day is determined by comparing a random number generated from a uniform distribution between 0 and 1 to the value of the transition probabilities P01 or P11. If the random number is smaller than P01, then
the preceding day is dry and the current day is a wet day. Alternatively, if the random number is greater than P01, then the current day is dry. The decision
years of daily rainfall for the month of May (assuming, on average, 23 dry days and 8 wet days) requires a sequence of about 930 uniformly distributed random numbers (30 years times 23 dry days) to determine the occurrence of wet days after dry days and to determine the occurrence of wet days after wet days. To determine the amount of rainfall each of the wet days requires a separate sequence of 240 uniformly distributed random numbers (30 years times 8 wet days).
3.3. Rainfall amount
When a wet day is generated, a rainfall amount must also be generated. Gamma distribution is regarded to be most appropriate to model for the daily rainfall amount generation (Jones et al. 1970, Buishand 1978, Larsen and Pense 1982, Duan et. al. 1995, Wilks 1992, 1999, Danuso 2002 and Piantadosi et.al. 2008). Since the mean rain per year often varies throughout the year, it is useful to consider models which reflect this temporal dependence (Stern and Coe 1982). Gamma distributions were fitted to rainfall amounts of wet days. Rainfall amount is generated by sampling from a two parameters Gamma distribution. The pdf of gamma distribution is given
) ( )
, ; (
1
x ex
x
f , ifx> 0, α> 0 andβ > 0
where Γ(α) is the gamma function. The shape and scale parameters are denoted by α and β respectively. α and β are specific parameters for each month. The total number of parameters needed to describe the rainfall amount is 24 (12 forα and 12 for β for each month). The parameters α and β are estimated, on a monthly base, by the method of moments i.e. α = M2/V andβ = V/M, where M is mean and V is the variance of the daily rainfall amounts for wet day.
4. Results and Discussion
0 50 100 150 200 250 300 350 400
1 2 3 4 5 6 7 8 9 10 11 12
Month
R
a
in
fa
ll
(
m
m
)/
m
o
n
th Mean SD
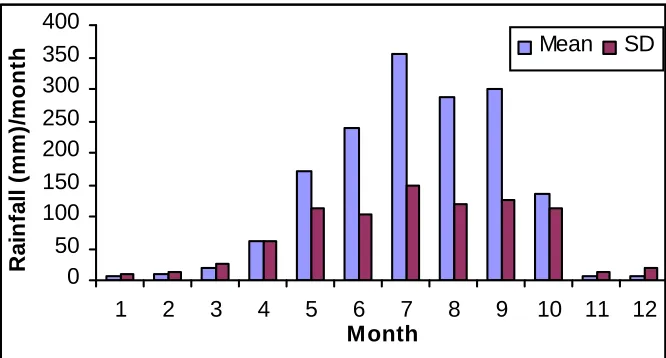
Figure 2 shows the average and standard deviation of daily rainfall for each month for the data which is taken from Mohadevpur station in Naogaon district. The variability of mean monthly rainfall is significantly high. This is so even for the wettest months of July (monsoon season) but four months namely: November, December, January and February are very dry which are in dry (rabi) season. During this time, crop grown in the area have not done well. The monthly variation of rainfall during the drier months is significantly lower than the wet months. During the June to September period, 74% of the total annual rains generally fall. Therefore, rainfall plays a very significant role for rice production in this time.
0 2 4 6 8 10
1 2 3 4 5 6 7 8 9 10 11 12
Month
S
h
a
p
e
p
a
ra
m
e
te
r
Figure 3: Monthly variation of shape parameter
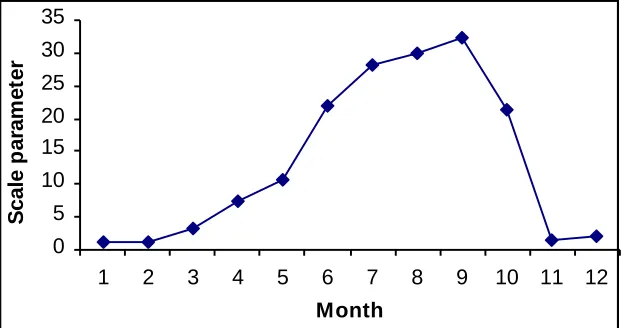
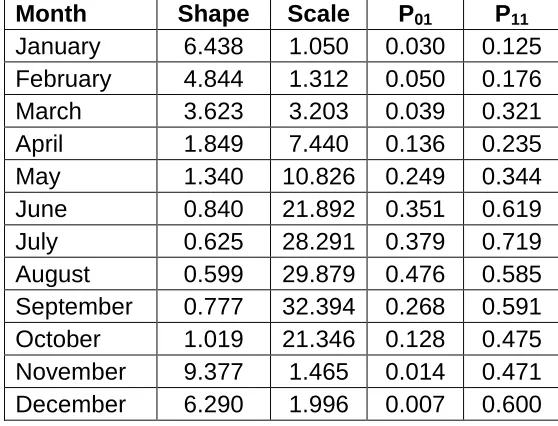
Method of moment was used to estimate the parameters of the gamma distribution and the results are shown in Figure 3 and 4. It can be seen that the value of shape parameter of Gamma distribution are varies in the range from 0.599 (August) to 9.377 (November), while scale parameter varies greatly in a range from 1.05 (January) to 32.394 (September), which indicates the significant variation of daily rainfall.
0 5 10 15 20 25 30 35
1 2 3 4 5 6 7 8 9 10 11 12
Month
S
c
a
le
p
a
ra
m
e
te
r
0 0.1 0.2 0.3 0.4 0.5 0.6 0.7 0.8
1 2 3 4 5 6 7 8 9 10 11 12
Month
C
o
n
d
it
io
n
a
l
p
ro
b
a
b
il
it
y P01
P11
Figure 5: Conditional probability of daily rainfall from recorded data
The conditional probabilities of wet day rainfall demonstrate the persistence of daily rainfall events. In the wet season, a wet day is more likely to be followed by a wet day, while in the dry season (November to March), the probability of a wet day following dry day is much smaller than a dry day following a dry. The conditional probability of wet day following a wet day is greater than the conditional probability of wet day following a dry day for every month (Figure.5).
0 5 10 15 20 25 30
1 2 3 4 5 6 7 8 9 10 11 12
Month
M
e
a
n
o
f
ra
in
fa
ll
/
ra
in
y
d
a
y
(
m
m
)
Recorded Generated
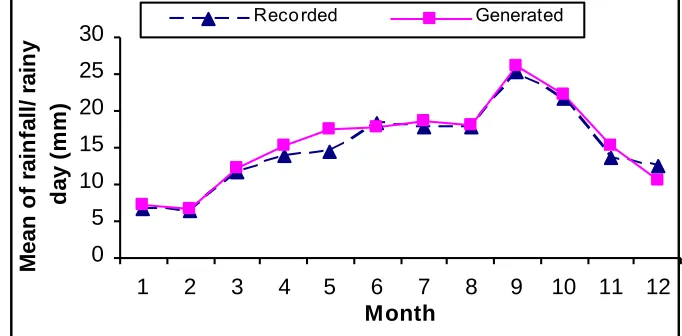
Figure 6: Comparison of recorded and generated mean rainfall (mm) per wet day at Mohadevpur
0 5 10 15 20 25 30 35
1 2 3 4 5 6 7 8 9 10 11 12
Month
S
D
o
f
ra
in
fa
ll
/r
a
in
y
d
a
y
(m
m
)
Recorded Generated
Figure 7: Comparison of recorded and generated standard deviation of rainfall (mm) per wet day at Mohadevpur
0 5 10 15 20
1 2 3 4 5 6 7 8 9 10 11 12
Month
M
e
a
n
o
f
ra
in
y
d
a
y
s
Recorded Generated
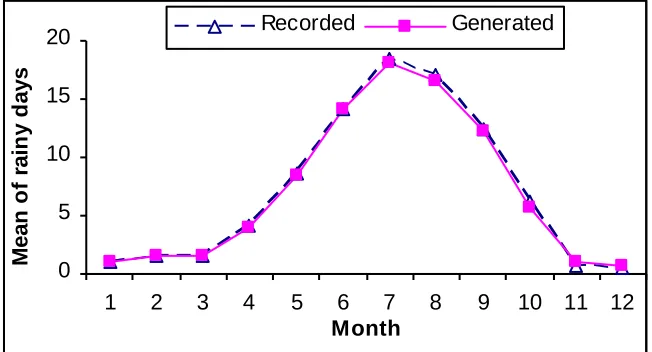
Figure 8: Comparison of monthly mean of wet days for recorded and generated data at Mohadevpur
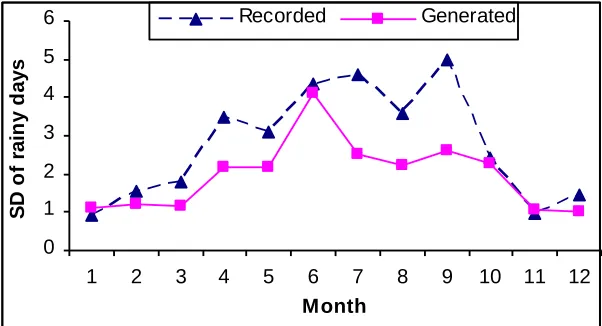
The analysis of recorded rainfall data showed that 23.76% days were wet of total days (rainfall greater than zero). About 71.66 % of days with rainfall were highest from June to September but the drier months from November to March were less wet days (6.31%). The results of generated wet days were similar to recorded data (Figure 8).
0 1 2 3 4 5 6
1 2 3 4 5 6 7 8 9 10 11 12
Month
S
D
o
f
ra
in
y
d
a
y
s
Recorded Generated
Figure 9: Comparison of monthly standard deviation of wet days for recorded and generated data at Mohadevpur
5. Conclusion
This study has examined the relative efficiency of the use of rainfall amount and wet days in the determination of generated rainfall at Mohadevpur. The results obtained show that both methods (the use of rainfall amount and wet days) are equally efficient with respect to the mean rainfall and wet days. The total predicted number of wet days is based on a first-order Markov chain process for the month and the total amount of monthly rainfall for wet days is determined by gamma distribution. The actual number of days with rainfall recorded was 23.76% and the total amount of mean annual rainfall was 1598 mm. The number of wet days predicted was 23.26% with a total mean annual rainfall of 1594 mm. This gave a percentage difference between observed and predicted days of rainfall and amount of rainfall as 0.5% and 0.25% respectively. Hence the model hence can generate satisfactory results.
The parameters necessary for the whole generation include the means, variance or standard deviation and conditional probabilities of rainy and dry days. The information of rainfall parameters and the scenario of the rainfall probability could be prepared by showing the net irrigation requirement of different crops in different seasons and strategic planning in the areas such as, agricultural practices and crop diversification. There is need for further research and work on the relationships between wet and dry spell events and agricultural systems as well as development of more inclusive models.
References
1. Banglapedia (2003). National Encyclopaedia of Bangladesh. Asiatic Society of Bangladesh: Dhaka.
2. Buishand, T. A. (1978). Some remarks on the use of daily rainfall models. J. Hgdrol. 36, 295-308.
4. Deni, S. M. and Jemain, A. A. (2009). Fitting the distribution of dry and wet spells with alternative probability models. Met. and Atmosph. Physics 104: 13-27.
5. De Michele, C. and Bernardara, P. (2005). Spectral analysis and modeling of space-time Atmosph. Res. 124–136.
6. Dore, MHI. (2005). Climate change and changes in global precipitation patterns: what do we know. Environ. In. 31(8):1167-1181.
7. Duan J., Sikka A. K. and Grant E. G. (1995). A comparison of stochastic models for generating daily precipitation at the H. J. Andrews experimental forest. 69(4):318-329.
8. Gabriel, K. R. and Neumann, J. (1962) A Markov chain model for daily rainfall occurrences at Tel Aviv. Quart. J. Roy. Met. Soc. 88:90-95.
9. Hayhoe, H. N. (2000). Improvements of stochastic weather data generators for diverse climates, Clim. Res. 14:75-87.
10. Hulme, M., Osborn, T. J. and Johns, T. C. (1998). Precipitation sensitivity to global warming: comparison of observations with HADCM2 simulations. Geophysical Res. Letter 25:3379-3382.
11. Jones, J. W., Colwick, R. F. and Threadgill, E. D. (1970). A simulated environmental model of temperature, evaporation, rainfall and soil moisture. ASAE Paper n. 70-404.
12. Kayano, M. T. and Sans´ıgolo, C. (2008). Interannual to decadal variations of precipitation and daily maximum and daily minimum temperatures in southern Brazil. Theoretical and App. Clim. 97(1-2):81-90.
13. Kottegoda, N. T., Natale, L. and Raiteri, E. (2004); Some considerations of periodicity and persistence in daily rainfalls, J. Hydrol. 296:23-37.
14. Larsen, G. A. and Pense, R. B. (1982). Stochastic simulation of daily climatic data for agronomic models. Agron. J. 74:510-514.
15. Medhi, J. (1981). Stochastic Process. John Wiley & Sons.
16. Nnaji, A. O. (2001). Forecasting seasonal rainfalI for agricultural decision-making in northern Nigeria. J. oj Agril. and Forest Met. 107:193-205.
17. Piantadosi J., Boland J. W. and Howlett P. G. (2008). Generating synthetic rainfall on various timescales daily, monthly and yearly. J. Environ. Model Assess. 14:431-438.
18. Richardson, C. W. (1981). Stochastic simulation of daily precipitation, temperature, and solar radiation, Water Resour. Res. 17(1):182-190. 19. Richardson, C. W. (1985). Weather simulation for crop management
models. Trans. ASAE, 28:1602-1606.
20. Roldan, J. and Woolhiser, D. A. (1982). Stochastic daily precipitation models, 1. A comparison of occurrence processes. Water Resour. Res. 18:1461-1468.
21. Shahid S. (2008). Spatial and temporal characteristics of droughts in the western part of Bangladesh. Hydrol. Processes 22(13):2235-2247.
23. Wilks, D. S. (1992). Adapting stochastic weather generation algorithms for climate change studies, Clim. Change 22:67-84.
24. Wilks, D. S. (1999). Inter annual variability and extreme-value characteristics of several stochastic daily precipitation models. Agril. and Forest Met. 93(3):153-169.
Appendix:
Table 1: Monthly mean and standard deviation of rainfall (recorded) data at Mohadevpur
Month Mean rainfall (mm) Standard deviation
of rainfall (mm)
January 6.61 11.28
February 10.16 11.29
March 18.30 25.15
April 61.82 59.74
May 171.32 112.41
June 237.50 104.10
July 355.27 149.99
August 288.25 119.23
September 300.10 124.63
October 134.86 112.23
November 6.12 11.89
December 7.42 19.44
Table 2: Values of conditional probability and gamma pdf parameters estimated the daily rainfall (recorded) data at Mohadevpur
Month Shape Scale P01 P11
January 6.438 1.050 0.030 0.125
February 4.844 1.312 0.050 0.176
March 3.623 3.203 0.039 0.321
April 1.849 7.440 0.136 0.235
May 1.340 10.826 0.249 0.344
June 0.840 21.892 0.351 0.619
July 0.625 28.291 0.379 0.719
August 0.599 29.879 0.476 0.585
September 0.777 32.394 0.268 0.591
October 1.019 21.346 0.128 0.475
November 9.377 1.465 0.014 0.471
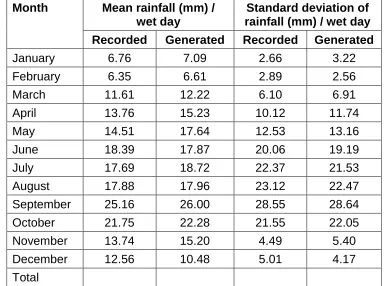
Table 3: Comparison of recorded and generated mean rainfall (mm) and Standard deviation of rainfall (mm) per wet day at Mohadevpur
Month Mean rainfall (mm) /
wet day
Standard deviation of rainfall (mm) / wet day
Recorded Generated Recorded Generated
January 6.76 7.09 2.66 3.22
February 6.35 6.61 2.89 2.56
March 11.61 12.22 6.10 6.91
April 13.76 15.23 10.12 11.74
May 14.51 17.64 12.53 13.16
June 18.39 17.87 20.06 19.19
July 17.69 18.72 22.37 21.53
August 17.88 17.96 23.12 22.47
September 25.16 26.00 28.55 28.64
October 21.75 22.28 21.55 22.05
November 13.74 15.20 4.49 5.40
December 12.56 10.48 5.01 4.17
Total
Table 4: Comparison of monthly mean and standard deviation of wet days for recorded and generated data at Mohadevpur
Month Mean of wet days
Standard deviation of wet days
Recorded Generated Recorded Generated
January 1.00 1.00 0.94 1.11
February 1.63 1.53 1.57 1.22
March 1.63 1.63 1.80 1.16
April 4.21 4.00 3.47 2.18
May 8.68 8.47 3.07 2.17
June 14.16 14.11 4.36 4.13
July 18.53 18.16 4.60 2.52
August 17.05 16.53 3.57 2.24
September 12.42 12.21 5.00 2.64
October 6.21 5.63 2.42 2.29
November 0.63 1.00 0.95 1.05
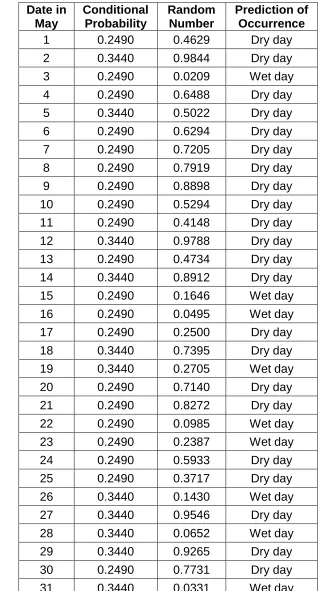
Table 5: Example of the prediction of rainfall occurrence for the month of May, 2009
Date in May
Conditional Probability
Random Number
Prediction of Occurrence
1 0.2490 0.4629 Dry day
2 0.3440 0.9844 Dry day
3 0.2490 0.0209 Wet day
4 0.2490 0.6488 Dry day
5 0.3440 0.5022 Dry day
6 0.2490 0.6294 Dry day
7 0.2490 0.7205 Dry day
8 0.2490 0.7919 Dry day
9 0.2490 0.8898 Dry day
10 0.2490 0.5294 Dry day
11 0.2490 0.4148 Dry day
12 0.3440 0.9788 Dry day
13 0.2490 0.4734 Dry day
14 0.3440 0.8912 Dry day
15 0.2490 0.1646 Wet day
16 0.2490 0.0495 Wet day
17 0.2490 0.2500 Dry day
18 0.3440 0.7395 Dry day
19 0.3440 0.2705 Wet day
20 0.2490 0.7140 Dry day
21 0.2490 0.8272 Dry day
22 0.2490 0.0985 Wet day
23 0.2490 0.2387 Wet day
24 0.2490 0.5933 Dry day
25 0.2490 0.3717 Dry day
26 0.3440 0.1430 Wet day
27 0.3440 0.9546 Dry day
28 0.3440 0.0652 Wet day
29 0.3440 0.9265 Dry day
30 0.2490 0.7731 Dry day