© 2019, IRJET | Impact Factor value: 7.211 | ISO 9001:2008 Certified Journal
| Page 5271
Future Generation of Multi Daily Rainfall Time Series for Hydrological
Analysis in Wadi Systems
Doaa M. Amin
1, Ahmed M. Lotfy
11
Researcher, Water Resources Research Institute, National Water Research Centre, Cairo, Egypt
---***---Abstract -
Red Sea region in Egypt considered as an arid region, which suffered from sudden storms causes extremes flash floods. The Lack of the rainfall data and the difficulty of collecting of watersheds characteristics are the obstacles to achieve the success of hydrological models application in Wadi system. This research aims to provide 1000 realizations of daily-predicted rainfall time series for next 100 years providing an innovative approach of disaggregating the monthly rainfall data into daily time series data. The Stochastic Analysis Modelling and Simulation (SAMS 2007) was used to generate these realizations of monthly data. The ground observations (2004-2014) were used to evaluate and choose the most accurate product of the three rainfall gridded distribution data; Climate Research Unit data (CRU), Global Precipitation Climate Center data (GPCC) and European Center for Medium Range Weather Forecast (ECMWF)-Rainfall Re Analysis-Interim data (ERA-Interim). The later daily data was utilized to create the pattern of disaggregation. The evaluation results show that the GPCC monthly data perform the best among the other products for most of stations, which was used to generate data for next 100 years. The various prediction realizations were disaggregated into daily time series. The analysis of the 1000 realizations of the daily rainfall show that the upper limit for the 26 points is between the ranges of (4.5-15.07) mm/day.Key Words: GPCC; Wadi System; rainfall prediction; disaggregation; ARMA model
1. INTRODUCTION
Prediction of the streamflow is very essential in the hydrologic applications. However, the rainfall data and drainage area are considered as the two important inputs required for all hydrological models [1]. The temporal and spatial variability of rainfall in the arid areas affects the rainfall-runoff modelling techniques that are appropriate for each region [2]. These models include temporal and spatial features that make them useful as tools for water resource management under different climatic conditions [3–8].
In the arid zones, there are greater spatial variations of rainfall occur, although the magnitudes differ from region to another [2]. The distributed rainfall data products improve prediction of streamflow at ungauged basins [9]. The gridded distribution data opens new horizons for researchers to study the behavior of catchments in the ungauged regions. Fekete et al. (2004) reviewed different gridded climate datasets and found that Global Precipitation Climate Center (GPCC), Global Precipitation Climatology Project (GPCP), Climate Research Unit (CRU) and University of Delaware (UD) are the most similar analyzed data. Essous et al. [10] investigated the potential of reanalysis data as proxies of observed surface precipitation to force hydrological models. Gampe and Ludwig [11] studied the projection of eight ensamples of gridded distributed rainfall data on the flow output from the hydrological model, where the gridded distributed rainfall data divided into three categories; three types of observed data, four types of reanalysis data, and one type of multi-satellite precipitation estimation. They provided an ensample mean for further hydrological activities, however they concluded that the selection of the data sets is highly depended on the region, and recommended to exclude the datasets that shows high deviations on the catchment scale. Sun et al. [12] reviewed thirty kind of existing precipitation datasets generated from different data sources and quantified the discrepancies between these datasets over multiple time scales in order to help the hydrologists to select the suitable type of rainfall data for their studied regions.
The climatic projections using multi-model water balance approaches indicate a possible range of variation of those values, which is useful for the short and long term planning of water resources [13], however, it is proposed as a useful way to characterize the structural error associated with a single model. The lack of observed data in the arid and semi-arid regions accentuates the need for synthesizing data by modelling [14]. Bulygina et al. [15] integrated three sources of information for constraining prediction uncertainty towards observed values of stream flow in ungauged catchments. The advantage of using the rainfall data products is of particular interest, as applying of stochastic rainfall models to expand rainfall records in future and analyze water resources [14,16–18].
© 2019, IRJET | Impact Factor value: 7.211 | ISO 9001:2008 Certified Journal
| Page 5272
behavior and the average. To overcome the lack of data in Africa, a temporally homogeneous rainfall dataset covering a period over 30-years is generated from the Tropical Applications of Meteorology using SATellite data (TAMSAT) and ground-based observations [20]. The auto regressive approach is used for regenerating the future sequence preserving the properties of the observed data [21].Disaggregation is generally defined as separation into components parts and it is usually used for having stream flow data disaggregated. However, when it is used with rainfall, it is usually meant to express separation of yearly data into monthly time series. This technique is often utilized in hydrological applications to overcome the issue of not having detailed rainfall data on low temporal scale. The issue is extended and it becomes more complicated when daily rainfall time series are obtained from the monthly data. This is because of absence of the daily patterns that are needed to be used in this process. Connolly et al. [22] have described a model that is used to disaggregate daily measured rainfall data into short time intensity data. This was based on daily rainfall records of up to 100 years duration, which is available in Australia. In their recent publication, Rebo et al. [23] have downscaled the monthly streamflow data into daily data using simple stochastic auto-regressive model. They were able to test the success of this model over two different basins in terms of area and climatic conditions. Hughes and Slaughter [24] conducted another study, in which, they studied a daily disaggregation approach presented by Slaughter et al. [25] to obtain daily streamflow using two different rainfall datasets. They concluded that the disaggregation method presents very poor results for daily flow simulations.
One of the major limitations accompanied with the accuracy of hydrological modelling is related to the availability of daily rainfall time series. As most of the available data in Red Sea region is monthly base data, the investigation of the performance of the future flash floods probabilities in the Wadi system faces main challenges. In addition to the difficulty of having multi probable rainfall patterns to describe rainfall extremes for long period in the future, they have to be in form of daily time series. This research therefore aims at providing 1000 realizations of daily-predicted distributed rainfall time series for next 100 years providing an innovative approach of disaggregation the monthly rainfall data into daily time series data.
2. Description of the study area and rainfall datasets
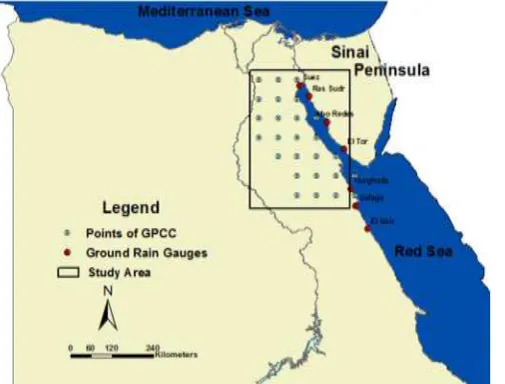
The study area is located along the Red Sea coastal zone between Suez and Hurghada cities. The climate of this region is characterized by rare rainfall events and low values however, this area has a large potential for flash floods occurrence. Unfortunately rainfall monitoring networks witness a significant lack of its coverage area. Figure 1 shows the locations of ground rain gauge available around this region. Because of this weakness in coverage which is usually caused because of several reasons such as security and accessibility issues, the need for another source of rainfall information becomes a necessity. Figure 1 shows also the points selected to represent the study area. Rainfall data from three various products were obtained at the locations of these points. The ground observation was mainly used for sake of evaluation and selection which product that will be used further in this study.
[image:2.595.177.430.534.726.2]© 2019, IRJET | Impact Factor value: 7.211 | ISO 9001:2008 Certified Journal
| Page 5273
2.1 Ground Observed Rainfall data
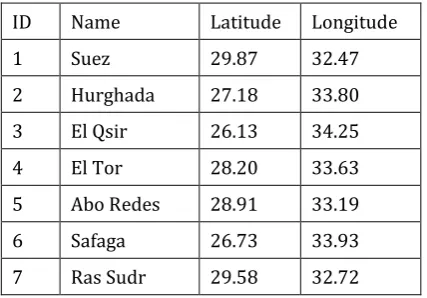
[image:3.595.192.406.193.342.2]The ground observation of rainfall is available in monthly form and they were accessible by the Water Resources Research Institute (WRRI) during the period (2004-2014) for seven rain gauges. These seven gauges are distributed along the Red Sea and around Suez gulf. The names and locations of these rain gauges are shown in Table 1.
Table -1: Name and locations of ground rain gauges
ID Name Latitude Longitude
1 Suez 29.87 32.47
2 Hurghada 27.18 33.80
3 El Qsir 26.13 34.25
4 El Tor 28.20 33.63
5 Abo Redes 28.91 33.19
6 Safaga 26.73 33.93
7 Ras Sudr 29.58 32.72
2.2 Gridded rainfall data over the Red Sea region
The limited number of rain gauges and the absence of their good spatial distribution make it difficult to describe rainfall in this region and thus the future long term prediction. The rainfall gridded data products, which is used as an observed data (reference data), could be solve the issue of lacking measured rainfall data, however, the efficiency of this type of data should be taken into account when describing rainfall in the region. Three types of the reference data are used; Climate Research Unit data (CRU) European Center for Medium Range Weather Forecast (ECMWF) Rainfall Re Analysis-Interim data (ERA-Interim), and GPCC are downloaded and then evaluated.
The CRU, Era-Interim and GPCC have spatial resolution of 50km x 50km. Both CRU and GPCC have a monthly temporal resolution, while Era-interim has a daily temporal resolution. The CRU data extends for 115 years (1901-2015) while the GPCC data is available from 1901 until 2013. The Era-Interim data is available in daily record from 1981 until now, the data downloaded until 2014, and then the data was accumulated in order to get the monthly data time series. The rainfall data of these three types were collected for the given points shown in Fig. 1 in order to cover the investigated area.
3. METHODOLOGY
3.1 Evaluation of three rainfall products with ground observations
The three types of gridded rainfall data; CRU, GPCC and Era-interim were evaluated using the observed rain gauges for 10 years. Three statistical criteria were used for the comparison in addition to the visual comparison using obvious graphs. The three statistical criteria are: Root mean square error (RMSE)-observations Standard Deviation Ratio (RSR) [26], Nash Sutcliffe (NSC) and Percent Bias (PBIAS) where:
√∑ ( )
√∑ ( ̅ ) (1)
[∑ ( )
∑ ( ̅ ) ] (2)
∑ ( )
∑ ( ) (3)
© 2019, IRJET | Impact Factor value: 7.211 | ISO 9001:2008 Certified Journal
| Page 5274
For RSR the optimal value of 0 to a large positive value and the lower the RSR, the lower the RMSE, and the better the rainfall product. NSC ranges from 0 to 1 and value of 1corresponds to a perfect match of the rainfall product to the observation. The optimal value of PBIAS is 0, with positive values indicating overestimation bias, negative values indicating underestimation bias and low-magnitude values indicating accurate model simulations. In general, the rainfall product can be judged as ‘‘satisfactory’’ if NSC > 0.50 and RSR < 0.70, and if PBIAS ±25% for rainfall [26].3.2 Using a Stochastic Analysis Modeling and Simulation (SAMS) to generate 1000 synthetic data for
rainfall series in future
3.2.1 SAMS software
The need for stochastic simulation is broadly increasing in order to solve several problems related to hydrologic time series. This includes various applications related to planning and water resources management such as rainfall estimation, streamflow simulation and determination of reservoir capacities which require in most of cases for mathematical models. For this reason, several models have been developed and have been used in literature to achieve this purpose. Selecting a particular model at this moment depends on many factors such as, physical and statistical characteristics of the process under consideration, data availability, the complexity of the system, and the overall purpose of the simulation study. Likewise, the need to reproduce the historical statistics of the investigated parameter (i.e. rainfall time series) forms essential role in selecting the type of the software packages. SAMS is one of these software packages that deal with stochastic analysis, modelling and simulation of hydrologic time series. It is based of C, FORTRAN and C++ and has been developed by Colorado state university and Bureau of Reclamation and it is free available on its website. The package consists of many menu options which enable the user to choose between different options [27].
3.2.2 ARMA Model description
Stochastic hydrology modeling requires the application of stationary Autoregressive Moving Average (ARMA) models which have been widely used. They are used to simulate the annual time series where the mean, variance, and the correlation structure do not depend on time. Unlikely, for seasonal hydrologic time series, stationary ARMA model can replicate the seasonal statistics of the time series by means of standardizing the underlying seasonal series. However, this procedure undertakes that season-to-season correlations are the same for a given lag. Hydrologic time series, such as monthly streamflow, are usually characterized by different dependence structure (month-to-month correlations) depending on the season (e.g. spring or fall). Periodic ARMA (PARMA) models have been suggested in the literature for modeling such periodic dependence structure [27]. A PARMA (p,q) model may be expressed as [25]:
∑ ∑ (4)
where Yv,t represents the streamflow process for year v and season t. For each season, t, this process is normally distributed with mean zero and variance σt2 (Y). The εv,t is the uncorrelated noise term which for each season is normally distributed with mean zero and variance σt2 (ε). The { _(1,τ),…, _(p,τ)} are the periodic autoregressive parameters and the {θ_(1,τ),…, θ_(q,τ)} are the periodic moving average parameters. If the number of seasons or the period is w, then a PARMA (p,q) model consists of w number of individual ARMA(p,q) models, where the dependence is across seasons instead of years. Parameters are estimated using Method of Moments or Least Square method. The earlier method can only be used in SAMS for q = 0 or 1 [27].
In this work, a univariate PARMA (1, 0) stochastic model was fitted to the GPCC rainfall monthly data time series. The long period of rainfall data (115 years of records) ensures that the historical statistics of rainfall occurrence and values are encountered in the fitted model to appropriately reproduce these properties. After checking the validity of this model and comparing between the properties of the existing data and the obtained model, the model was used to generate data for the next 100 years. The most significant advantage of this concept is the flexibility of the developed model to generate several samples of data in the same period. Hence, the probability of occurrence of an incident could be variously obtained.
3.2.3 Generation of monthly rainfall data for next 100 years
© 2019, IRJET | Impact Factor value: 7.211 | ISO 9001:2008 Certified Journal
| Page 5275
In this work, once the model has been defined and the parameters have been estimated, 1000 realizations were generated for the 100 years starting from 2015 using the fitted model to the GPCC rainfall monthly data time series. This was achieved for each point of the selected 26 points over the whole study area. The spatial and temporal relations among those locations were taken into account while creating the model. The most important constrain facing this procedure was the number of zeros in data. Since the study area is located in arid region, the frequency of rainfall occurrence is very low. For example, the rainfall values in June, July and August are usually zeros. Hence this would cause some errors in fitting the model and need to be removed. Another issue was the maximum rainfall value of the generated data. It has to be verified that the maximum value is realistically predicted. Hence, an adjustment condition was set for the maximum value when generating this data. It has to be mentioned that this condition would not affect the procedure of the generating or the behavior of the fitted model but it would affect only the maximum limit of the generated data to conform within the expected values for the region.3.3 Description of disaggregation pattern
In order to use the multi rainfall monthly prediction realizations to run hydrological models, there is a need to disaggregate the monthly time series to daily time series. To achieve this target, the Era-interim data which is available in daily time series from 1981 till the end of 2016 was used for this purpose. The contribution of the daily rainfall is calculated as a percentage from the total monthly rainfall, by dividing the daily long-term mean rainfall gridded data on the mean monthly from the same data. This percentage was multiplied by the multi rainfall monthly prediction realizations to disaggregate it to daily time series.
4. RESULTS AND DESCUSSION
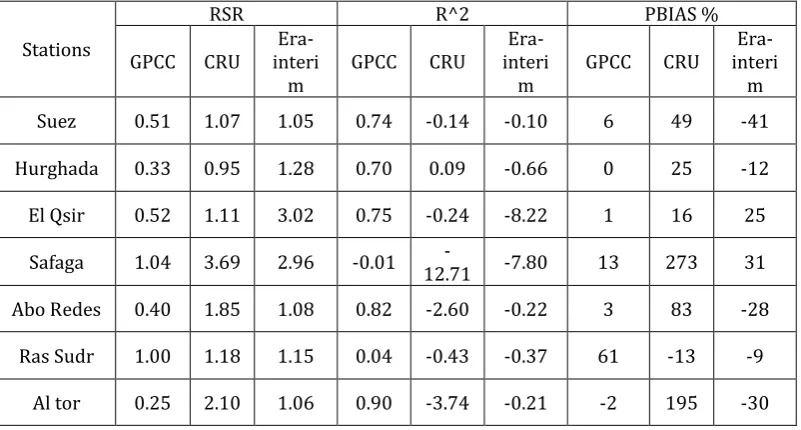
[image:5.595.99.500.500.715.2]The rainfall for seven stations; four stations in Red Sea and three stations in Sinai were used in the evaluation. The satisfactory NSC, RSR and PBIAS were achieved for the GPCC rainfall gridded data. Table 2 shows the statistical criteria values for the CRU, GPCC and Era-interim compared with the Observed data. It is clear from the values that the GPCC is the most presented data sets to the rainfall in all stations, where most values of the comparison are around the accepted range. Although the comparison values for the Safaga and Ras Sudr stations were the worst, the comparison is still in favor of GPCC.
Table -2: The statistical criteria calculations for GPCC, CRU, and Era-interim rainfall data sets reference to the observed rain gauge data
Stations
RSR R^2 PBIAS %
GPCC CRU interi
Era-m GPCC CRU
Era-interi
m GPCC CRU
Era-interi
m
Suez 0.51 1.07 1.05 0.74 -0.14 -0.10 6 49 -41
Hurghada 0.33 0.95 1.28 0.70 0.09 -0.66 0 25 -12
El Qsir 0.52 1.11 3.02 0.75 -0.24 -8.22 1 16 25
Safaga 1.04 3.69 2.96 -0.01 12.71 - -7.80 13 273 31
Abo Redes 0.40 1.85 1.08 0.82 -2.60 -0.22 3 83 -28
Ras Sudr 1.00 1.18 1.15 0.04 -0.43 -0.37 61 -13 -9
Al tor 0.25 2.10 1.06 0.90 -3.74 -0.21 -2 195 -30
© 2019, IRJET | Impact Factor value: 7.211 | ISO 9001:2008 Certified Journal
| Page 5276
Hurghada, El Qsir and Safaga in Red Sea and Al tor, Abo Redes and Ras Sudr in Sinai. The GPCC has the best performance in presenting the rainfall in Red Sea and Sinai. From the results, GPCC is a reference data, which can be used to present the pattern of the rainfall over Sinai and Red Sea.a) Hurghada b) Suez
c) El Qsir d) Al tor
e) Abo Redes f) Safaga
g)
h) Ras-Suder
Fig-2: Mean monthly rainfall for CRU, GPCC and Era-interim compared to the observed rainfall 0.00 0.50 1.00 1.50 2.00 2.50 3.00
Jan Feb Mar Ap
r
M
ay Jun Jul Aug Sep Oct Nov Dec
M ea n M o n th ly R ai n fa ll (m m /m o n th ) Observed GPCC CRU Era- interm 0.00 0.50 1.00 1.50 2.00 2.50 3.00 3.50 4.00 4.50
Jan Feb Mar Ap
r
M
ay Jun Jul Aug Sep Oct Nov Dec
M ea n M o n th ly R ai n fa ll (m m /m o n th ) Observed GPCC CRU Era- interm 0.00 0.50 1.00 1.50 2.00 2.50 3.00 3.50 4.00 4.50
Jan Feb Mar Ap
r
M
ay Jun Jul Aug Sep Oct
N o v D ec M ea n M o n th ly R ai n fa ll (m m /m o n th ) Observed GPCC CRU Era- interm 0.00 1.00 2.00 3.00 4.00 5.00 6.00 7.00
Jan Feb Mar Ap
r
M
ay Jun Jul Aug Sep Oct Nov Dec
M ea n M o n th ly R ai n fa ll (m m /m o n th ) Observed GPCC CRU Era- interm 0.00 0.50 1.00 1.50 2.00 2.50 3.00 3.50 4.00 4.50 5.00
Jan Feb Mar Ap
r
M
ay Jun Jul Aug Sep Oct Nov Dec
M ea n M o n th ly R ai n fa ll (m m /m o n th ) Observed GPCC CRU Era- interm 0.00 1.00 2.00 3.00 4.00 5.00 6.00 7.00 8.00
Jan Feb Mar Ap
r
M
ay Jun Jul Aug Sep Oct Nov Dec
M ea n M o n th ly R ai n fa ll (m m /m o n th ) Observed GPCC CRU Era- interm 0.00 0.50 1.00 1.50 2.00 2.50 3.00 3.50 4.00
Jan Feb Mar Ap r M…
Ju
n Jul
Au
g
Sep Oct No
© 2019, IRJET | Impact Factor value: 7.211 | ISO 9001:2008 Certified Journal
| Page 5277
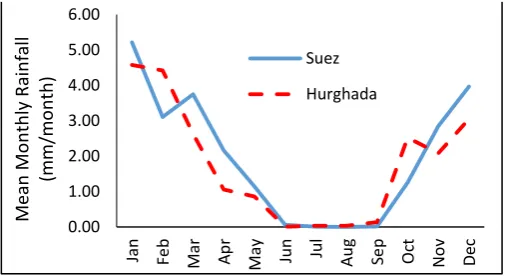
In order to generate synthetic data for rainfall series, as a future prediction of the rainfall, it is needed to study the statistical properties of the historical rainfall data (GPCC) for the 26 points. The main properties that should be study the mean, the variance and the dispersion of a set of data values (standard deviation). Figure 3 shows the mean monthly pattern of the Suez and Hurghada during the period (1901-2013) from the GPCC data.Fig -3: Mean monthly pattern of the Suez and Hurghada from the GPCC data
After disaggregation of the monthly depending based on the daily time series of the Era-interim, the daily rainfall time series for the predicated realizations were obtained. Figure 4 shows the spatial distributed contribution percentage for the maximum day in December, January and February for the studied region between Suez to Hurghada. Figure 5 shows the daily contribution percentage for Suez and Hurghada stations. This percentage was multiplied by the multi rainfall monthly prediction realizations to disaggregate them into daily time series. Finally, 1000 realizations of daily predicted rainfall are available now to run the hydrological models.
17th Dec. 1st Jan.
0.00 1.00 2.00 3.00 4.00 5.00 6.00
Jan Feb Mar Ap
r
May Ju n Jul
A
u
g
Se
p
O
ct
N
o
v
D
ec
Me
an
M
o
n
th
ly
Ra
in
fall
(m
m
/m
o
n
th
) Suez
© 2019, IRJET | Impact Factor value: 7.211 | ISO 9001:2008 Certified Journal
| Page 5278
7th Feb.Fig -4: Samples of the distributed contribution percentage for the maximum day in Dec., Jan., and Feb.
Fig -5: The sample of the percentage the daily contribution reference to its month, calculated by divided the daily long-term mean in the period (1981-2016) on the mean monthly for the same period
[image:8.595.172.421.336.492.2]As mentioned before, 1000 realizations of daily-predicted rainfall daily data for future period (2015-2115), for the 26 points, are available now to run the hydrological models. The analysis of the 1000 realizations shows that the upper limit (maximum daily value) for the 26 points is between the range (4.5-15.07) mm/day. Figure 6 shows the maximum daily rainfall for each point for the 1000 realizations.
Fig -6: The Maximum daily rainfall for the 1000 realizations during the period (2015-2115) for the 26 station grids (SG) 0
10 20 30 40 50 60 70 80
1 24 47 70 93
116 139 162 185 208 231 254 277 300 323 346
%
(Da
ily
Lo
n
g
Te
rm
Me
an
/Me
an
Mo
n
th
ly
)
Suez
Hurghada
SG
01
SG
03
SG
05
SG
07
SG
09
SG
11
SG
13
SG
15
SG
17
SG
19
SG
21
SG
23
SG
25
Rain
fall
(m
m
/d
ay
)
Points Name
[image:8.595.171.423.587.747.2]© 2019, IRJET | Impact Factor value: 7.211 | ISO 9001:2008 Certified Journal
| Page 5279
3. CONCLUSIONS
In most of the arid regions, there is a common issue of lacking rainfall information. The rainfall gridded distributed datasets provides a solution for the researchers to study the ungauged regions; however, the quality of these data sets should be examined. This work shows that the GPCC product is the most suitable one, comparing to another three other products, to present the rainfall performance in the Red Sea region. ARMA model was successfully fitted to the 26 selected points in order to generate a synthetic rainfall data in future. These predicted data was then disaggregated from monthly-based form into a daily time series data. The disaggregation method was suggested using the Era-interim daily data to obtain the needed patterns. More potential should be directed to enhance the methods of the disaggregation of the monthly data into daily data especially in the arid and semi-arid regions, which are characterized by limited gauges. Finally, 1000 realizations of daily-predicted rainfall time series for next 100 years are now ready and available to be utilized in hydrological models to investigate of the performance of the future flash floods probabilities in the Wadi system.
REFERENCES
[1] Devia GK, Ganasri BP, Dwarakish GS. A Review on Hydrological Models. Aquat Procedia [Internet]. 2015;4(Icwrcoe):1001–7. Available from: http://linkinghub.elsevier.com/retrieve/pii/S2214241X15001273
[2] Pilgrim DH, Chapman TG, Doran DG. Problèmes de la mise au point de modèles pluie-écoulement dans les régions arides et semi-arides. Hydrol Sci J. 1988;33(4):379–400.
[3] Vandewiele GL, Xu C-Y, Ni-Lar-Win. Methodology and comparative study of monthly water balance models in Belgium,
China and Burma. J Hydrol [Internet]. 1992;134(1):315–47. Available from:
http://www.sciencedirect.com/science/article/pii/002216949290041S
[4] Vandewiele GL, Elias A. Monthly water balance of ungauged catchments obtained by geographical regionalization. J Hydrol [Internet]. 1995;170(1):277–91. Available from: http://www.sciencedirect.com/science/article/pii/002216949502681E [5] Makhlouf Z, Michel C. A two-parameter monthly water balance model for French watersheds. J Hydrol [Internet].
1994;162(3):299–318. Available from: http://www.sciencedirect.com/science/article/pii/002216949490233X
[6] Xu C-Y, Seibert J, Halldin S. Regional water balance modelling in the NOPEX area: development and application of monthly
water balance models. J Hydrol [Internet]. 1996;180(1):211–36. Available from:
http://www.sciencedirect.com/science/article/pii/0022169495028889
[7] Xiong L, Guo S. A two-parameter monthly water balance model and its application. J Hydrol [Internet]. 1999;216(1):111–23. Available from: http://www.sciencedirect.com/science/article/pii/S0022169498002972
[8] Legesse D, Abiye TA, Vallet-Coulomb C, Abate H. Streamflow sensitivity to climate and land cover changes: Meki River, Ethiopia. Hydrol Earth Syst Sci. 2010;14(11):2277–87.
[9] Bandaragoda C. Distributed Hydrologic Modeling for Streamflow Prediction at Ungauged Basins [Internet]. Civil and Environmental Engineering. 2008. Available from: http://digitalcommons.usu.edu/etd/62/
[10] Essou GRC, Sabarly F, Lucas-Picher P, Brissette F, Poulin A. Can Precipitation and Temperature from Meteorological Reanalyses Be Used for Hydrological Modeling? J Hydrometeorol [Internet]. 2016;17(7):1929–50. Available from: http://journals.ametsoc.org/doi/10.1175/JHM-D-15-0138.1
[11] Gampe D, Ludwig R. Evaluation of Gridded Precipitation Data Products for Hydrological Applications in Complex Topography. Hydrology [Internet]. 2017;4(4):53. Available from: http://www.mdpi.com/2306-5338/4/4/53
[12] Sun Q, Miao C, Duan Q, Ashouri H, Sorooshian S, Hsu KL. A Review of Global Precipitation Data Sets: Data Sources, Estimation, and Intercomparisons. Rev Geophys. 2018;56(1):79–107.
[13] Thapa BR, Ishidaira H, Pandey VP, Shakya NM. A multi-model approach for analyzing water balance dynamics in Kathmandu Valley, Nepal. J Hydrol Reg Stud [Internet]. 2017;9:149–62. Available from: http://dx.doi.org/10.1016/j.ejrh.2016.12.080
[14] Bergin E, Buytaert W, Onof C, Wheater H. Downscaling of rainfall in Peru using Generalised Linear Models. World Congr Water, Clim Energy. 2010;(April):2–5.
[15] Bulygina N, Ballard C, McIntyre N, O’Donnell G, Wheater H. Integrating different types of information into hydrological model parameter estimation: Application to ungauged catchments and land use scenario analysis. Water Resour Res. 2012;48(6).
[16] Wheater HS, Butler AP, Stewart EJ, Hamilton GS. A multivariate spatial-temporal model of rainfall in southwest Saudi Arabia. I. Spatial rainfall characteristics and model formulation. J Hydrol [Internet]. 1991;125(3):175–99. Available from: http://www.sciencedirect.com/science/article/pii/002216949190028G
[17] Wheater HS, Onof C, Butler AP, Hamilton GS. A multivariate spatial-temporal model of rainfall in southwest Saudi Arabia. II. Regional analysis and long-term performance. J Hydrol [Internet]. 1991;125(3):201–20. Available from: http://www.sciencedirect.com/science/article/pii/002216949190029H
© 2019, IRJET | Impact Factor value: 7.211 | ISO 9001:2008 Certified Journal
| Page 5280
[19] Oriani F, Straubhaar J, Renard P, Mariethoz G. Simulation of rainfall time series from different climatic regions using the direct sampling technique. Hydrol Earth Syst Sci. 2014;18(8):3015–31.
[20] Dinku T, Hailemariam K, Maidment R, Tarnavsky E, Connor S. Combined use of satellite estimates and rain gauge observations to generate high-quality historical rainfall time series over Ethiopia. Int J Climatol. 2014;34(7):2489–504.
[21] Babu SK, Karthikeyan K, Ramanaiah M V, Ramanah D. Prediction of Rain-fall flow Time Series using Auto-Regressive Models. Adv Appl Sci Res [Internet]. 2011;2(2):128–33. Available from: www.pelagiaresearchlibrary.com
[22] Connolly RD, Schirmer J, Dunn PK. A daily rainfall disaggregation model. Agric For Meteorol. 1998;92(2):105–17.
[23] Rebora N, Silvestro F, Rudari R, Herold C, Ferraris L. Downscaling stream flow time series from monthly to daily scales using an auto-regressive stochastic algorithm: StreamFARM. J Hydrol [Internet]. 2016;537:297–310. Available from: http://dx.doi.org/10.1016/j.jhydrol.2016.03.015
[24] Hughes DA, Slaughter A. Daily disaggregation of simulated monthly flows using different rainfall datasets in southern Africa. J Hydrol Reg Stud. 2015;4(PB):153–71.
[25] Slaughter AR, Retief DCH, Hughes DA. A method to disaggregate monthly flows to daily using daily rainfall observations: model design and testing. Hydrol Sci J [Internet]. 2015;60(11):1896–910. Available from: https://doi.org/10.1080/02626667.2014.993987
[26] Moriasi D. N., J. G. Arnold, M. W. Van Liew, R. L. Bingner, R. D. Harmel, T. L. Veith. Model Evaluation Guidelines for Systematic Quantification of Accuracy in Watershed Simulations. Trans ASABE [Internet]. 2007;50(3):885–900. Available from: http://elibrary.asabe.org/abstract.asp??JID=3&AID=23153&CID=t2007&v=50&i=3&T=1
[27] Sveinsson OGB, J.D. Salas WLL, Frevert DK. Stochastic Analysis , Modeling , and Simulation ( SAMS ) Version 2007 Stochastic Analysis , Modeling , and Simulation ( SAMS ) Version 2007 - User ’ s Manual. 2007;(11).