(UDC: 539.194)
On diffusion in nanospace
M. Kojic1,2, M. Milosevic1, N. Kojic3, M. Ferrari2, A. Ziemys2
1Metropolitan University – Belgrade, R & D Center for Bioengineering, 34000 Kragujevac,
Serbia;
2The Methodist Hospital Research Institute, Houston, TX 77030; 3Tuftts University, Medford, MA 02155;
Abstract
Diffusion in nanospace does not strictly obey to Fick’s law generally used in macroenvironment. Deviation from this law is due to surface effects, i.e. due to interaction between transported molecules and bounding surfaces. A hierarchical modeling approach which accounts for interface effects on the diffusion coefficient was introduced in Ziemys et al. (2011). The model employs molecular dynamics (MD) for calculation scaling functions to reduce the diffusion coefficient corresponding to “bulk” values. With this reduced diffusion coefficient, modeling is performed using the finite element method (FE) within an incremental iterative scheme.
In this paper we summarize this hierarchical (multiscale) model and present its generalization to include adsorption at the walls. Also, we briefly discuss further possible applications of the multiscale modeling of diffusion through complex media with distributed solid constituents, as in case of polymers or biological fluids.
Key words: diffusion, molecular transport, molecular dynamics, finite element method, nano-confinement.
1. Introduction
In recent technological fabrication of nanofluidic devices (Grattoni et al. 2010, Gardeniers and Berg 2004) and nanoporous materials (Caro et al 2004, Iijima 1991), transport phenomena within nano-confinement have become very important. The Peclet number of nanofluidic systems ranges from 10-6 to 1 with a diffusion coefficient (diffusivity) of 10-5 cm2/s, hence
molecular diffusion may dominate the mass transport (Karniadakis 2005).
In common continuum theories of diffusion through homogenous media Fick’s law is used as the fundamental relation:
J D c (1)
into complex macroscale models of nanofluidic devices. MD provides insight into the physics of molecular transport, but it can be used for modeling very small regions, therefore macroscopic methods are necessary. An ideal scenario is to properly transfer MD information to macroscopic models; hierarchical (multiscale) models offer this possibility.
Among various continuum-based numerical methods, which in essence employ a discretization concept, the most developed and well established is the Finite Element Method (FEM). A time and length scale is usually several orders of magnitude larger than in MD. Various schemes have been introduced to couple MD and FEM, as hybrid methods (Rudd and Broughton 1998, Hou and Wu 1997, Broughton et al. 1999), or bridging scale methods (Wagner and Liu 2003, Kojic et al. 2006, 2008a,b).
In this work we present a hierarchical model used to simulate diffusive mass transport in nanofluidic systems, which includes concentration effects and MD derived scaling functions of diffusivity based on proximity to a surface (Arturas et al. 2011). This model is further extended to include adsorption on the wall. Then, we briefly outline possible generalizations to analyze diffusion through complex media, as we have in case of molecular transport within intracellular space or in polymers. Few numerical examples illustrate applicability of our extended hierarchical model. Some concluding remarks are given at the end of this report.
2. Methods
Here, we first outline MD simulations, then the FEM, followed by bridging MD-FEM, and finally a concept of including adsorption.
2.1 MD simulations
Molecular Dynamics (MD) has been used for several decades (Rapaport 2004). It is based on statistical mechanics, where motion of particles is described according to the Newtonian mechanics:
i i i
m
v
F
(2)
2
2
0 θ
θ θ
0cos
intra b
bonds angles torsions
E
K b b
K
K
n
(3)12 6
min,
2
min,i j ij ij
inter ij
electrostatics ij VDW ij ij
q q
R
R
E
r
r
r
(4)Material parameters of the intramolecular potential Eintra are given by the force constants
K
b,θ
K
andK
, equilibrium values of bonds and angles b0 and θ0, and equilibrium torsionsconstants – dihedral multiplicity n and dihedral phase δ. Intermolecular potential sums are electrostatic and van der Waals (VDW) terms, where
ijis VDW potential depth, Rmin is atomradius, and
q q
i,
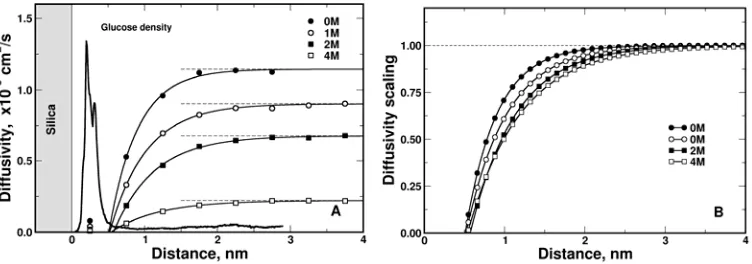
j are partial atomic charge. These parameters of FF are introduced to represent certain chemical classes of compounds in order to reproduce experimental physico-chemical properties.MD simulations for calculating diffusivities in nanochannels were carried out (Ziemys et al. 2009, 2010) using NAMD 2.6 (Phillips et al. 2005) with a TIP3P water model (Jorgensen et al. 1983) and NVT (fixed number of particles N, pressure P, volume V) ensembles. CHARMM compatible amorphous silica force field (Cruz-Chu et al. 2006) was employed to model the silica nanochannel, which is modeled by charged hydrophilic amorphous silica phase to match the silica properties after thefabrication process. Glucose diffusion coefficients were calculated from 30 ns trajectories by using the mean square displacement <r2>:
<r2>=2dDt (5)
where the factor d = 1, 2, 3 depends on the dimensionality of the space, and t is time. The diffusivity along the surface normal (z-direction) was evaluated, from the surface up to the middle of the nanochannel. The time window t for <r2> was chosen as 20 ps, which is small enough to catch local displacements within 0.5 nm thick slabs. The diffusivity results include dependence on distance from the wall and glucose concentrations (Fig 1 – left panel).
The MD calculated diffusivity is normalized with respect to the “bulk” value
D
bulk corresponding to diffusivity far from the surface, where influence of the surface is negligible. Hence, we havebulk
D
SD
(6)where
,
S
S w c
,0 S 1 (7)Fig. 1. Calculated glucose diffusivity (left panel)) and scaling functions of the proximity to the silica surface for several concentrations (right panel); according to Ziemys et al. (2011).
Experimental investigations showed that D(Dbulk) for glucose depends on concentration, although data are quite different (see Zimys et al. 2011 and references given therein). For examples shown here we have chosen the glucose D according to the largest data set of Gladden and Dole (1953) (Table 1) that spans over a wide range of concentrations, from 0 to 3.36 M.
c,M D·10
-6, cm
2/s
0.00 6.75
0.55 5.80
1.09 4.86
1.66 3.96
2.23 3.02
2.78 2.20
3.36 1.33
Table 1. Experimental data of the diffusion coefficients (Gladden and Dole 1953).
2.2 Finite element model
Finite element modeling of various problems in science and engineering has been well established. We here consider unsteady diffusion where the diffusion coefficient depends on both concentration and spatial position of a point within the model. FE solution procedures for nonlinear diffusion problems have been well established and successfully used in various applications (e.g. Bathe 1996, Hughes 2000, Kojic et al. 2006, 2008a). The basic mass balance equation, which also includes Fick’s law in equation (1), is:
0
i i
c
c
D
q
t
x
x
where
c x t
i,
is concentration; Ddepends in general on the coordinatesx
i and onc
;
i,
q x t
is a source term; and summation over the repeated index is implied (i=1,2,3). By using a standard Galerkin procedure, this nonlinear differential equation can be transformed into the incremental-iterative system of linear balance equations for a finite element (Kojic et al. 2008):
1 ( 1) ( ) 1 ( 1) 1 ( ) 1 ( 1) 1 ( 1)
1 ( 1)
1
1
n i i n S i n V i n i n i
n i n
t
t
M K C Q Q K C
M C C
(9) where C is the vector of nodal concentrations; the left upper indices n and n+1 denote values at
the start and end of the time step n of size
t
; the indices i and i-1 correspond to the current and previous equilibrium iteration;Q
S andQ
V are surface and volumetric nodal fluxes for the element; and components of the matricesM
andK
are:IJ I J V
M
N N dV
(10)
1 ( 1) 1 ( 1)
, ,
n i n i
IJ I i J i
V
K
D
N N dV
(11)
Here
N
I andN
J are the interpolation functions, and n1D
( 1)i is the diffusion coefficient corresponding to the last known concentration n1 ( 1)c
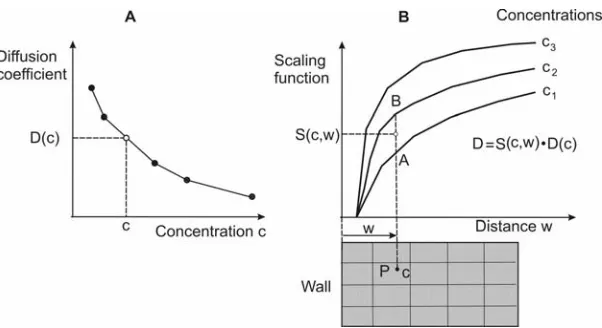
i at a point within the finite element. Assembly of equations (9) and solution procedures are performed in a usual manner that is well described in the computational mechanics literature (e.g. Bathe 1996).Fig. 2. Determination of diffusion coefficient at a spatial point P using dependence on concentration and surface effects. The “bulk” value is first determined from the curve D(c), A;
then the scaling function is evaluated from family of curves shown in B. Linear interpolation curves S(c,w) is adopted (between points A and B in the figure).
The described hierarchical model has been verified by comparison of diffusion experiments in nanochannels (Fine et al. 2010). Good agreement between computed and experimental results for mass release was found (Ziemys et al. 2011).
2.3 FE model with adsorption
The process of adsorption, i.e. attachment of molecules to the surface wall, is an important process occurring in transport of molecules within a nanoconfinement. Here we extend our hierarchical (multiscale) model to include adsorption to the surface. Schematics of the adsorption is shown in Fig. 3.
Fig. 3. Schematics of adsorption. Molecules are adsorbed to the wall over time with adsorption flux dependent on the current mean value
C
of concentration along the surface normal and height h. The height of adsorbed layer is
d
, where
is relative area covered by molecules.The relative area covered by molecules
is defined as:molec
total
A
A
where
A
molec is area covered by particles (molecules) andA
total is the total area. Value
canbe expressed as:
1
molec totalA
kC
A
kC
(13)where
C
is the mean concentration along the surface normal (at a considered point on the surface) and at the height h H
d; and k is the adsorption coefficient.In the incremental-iterative balance equations (9) must be included adsorption fluxes at the wall, as external fluxes at the FE nodes on the wall boundary. The adsorption flux, which has direction of normal to the wall, can be obtained as follows. Number of molecules ΔN(molecules) adsorbed at the unit area (1
2)of the wall surface during time step of size Δt is:
2 1015 2
A
N A
N molecules j t D C t N D tN C molecules
y y
(14)
where
j
N is flux in direction of the normal, NA6.022 10 23 is the Avogadro number, and15
10
A A
N N . Increment of covered area per unit area further is:
2
2 2
2 A 4 = m 2
d C C
D tN B D t
y y
(15)
where 2 2 4 m A d B N Mol
(16)
From (15) and (13) follows:
1 2
1
1 1
n t n
y n n
m
k C k C Mol
Q
tB k C k C
s
(17)
This final expression is included into equation is included into equation (6) and implemented in the FE program PAK (Kojic et al. 1998, 2009).
2.4 Generalization of the hierarchical model to porous media
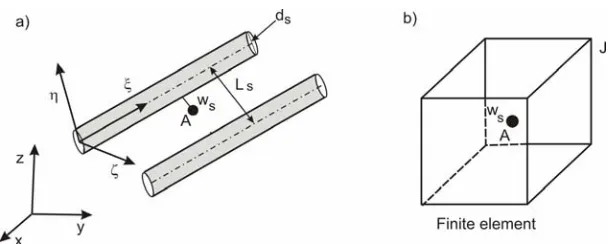
Fig. 4. Concept of extension of hierarchical model to porous medium with fibers. a) Geometry of the internal structure – fibers of a s-group, with diameter ds and with mutual distance Ls, and
point A at distance ws from the fiber surface; b) Finite element with point A and FE node J.
For a point A in the medium it is possible to calculate the distance from the closest fiber surface of an s-group, and to evaluate scaling function Ss as described above for diffusion within a
nanochannel. We assume that scaling functions are different for the normal and tangential directions, hence we have three scaling functions
S
s,S
s,
S
s in the local fiber directions, ,
, so that the diagonal diffusion matrix (tensor)D D
s,
s,
D
s in the local coordinate system is:
0
0
0
s s
s s
s s
D
S D
D
S D
D
S D
(18)
where
D
0 is the bulk modulus. The diffusion tensor in the global coordinate system x,y,z can be obtained by tensorial transformation of the second-order tensor,xyz
s s s sT
D
T D T
(19)where the components of the transformation matrix contains cosines of angles between local and global axes:
cos( , )
s
ij i j
T
x
i,j=1,2,3 (20) Herex
i and
j stand for global (x,y.z) and local coordinate (
, ,
) systems.3. Examples
3.1 General description
reservoir had zero concentration. Molar mass of solution is Amol = 100 g/mol, so it can be calculated that initial mass in upstream reservoir is 2.17 e+3 [fg]. Concentration in both reservoirs at the end of FE simulation when the system reaches stationary state will be 1.37 M.
We modeled three different configurations of nanochannels, and all are taken to be with or without adsorption effects. First example is cylindrical model of nanochannel, while other two examples are cones with shrinks at both inlet and outlet cross-sections. Length of cylindrical nanochannel is 50 nm, and radius is 8nm. For conical models we used the same conditions, with the outlet diameter smaller for 8 nm. For FE mesh we used 300 elements in longitudinal direction and 16 elements in radial direction. For each model (with or without adsorption) we present field of concentration and unit mass flux at specific time points of simulation (Figs 5, 6, 9, 10, 11 and 12). For cylindrical model and conical model with shrink at the outlet cross-section we show: diagrams of concentration and Cumulative Mass Release change for both inlet and outlet cross-sections (Figs. 7 and 8); and also diagrams of Relative covered area and Unit Mass Flux-y, according to adsorption effects (Figs 13 and 14).
Fig. 5. Cilindrical model of nanochannel without adsorption effects: a) Field of concentration (units Mol/g) at time t = 0.00003 [h]; b) Field of Unit Mass Flux (units are fg/( 2
h
)) at time t= 0.00003 [h].
Fig. 6. Cilindrical model of nanochannel with adsorption effects: a) Field of concentration (units Mol/g) at time t = 0.00003 [h]; b) Field of Unit Mass Flux (units are fg/( 2
h
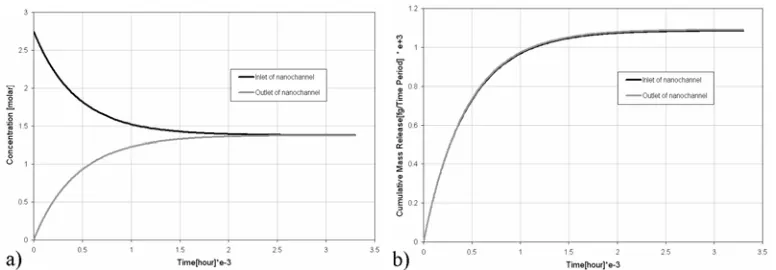
Fig. 7. Cilindrical model of nanochannel with adsorption effects: a) Diagram of concentration change at inlet and outlet cross-section of nanochannel; b) Diagram of Cumulative Mass
Release vs time at inlet and outlet cross-sections.
Fig. 8. Cilindrical model of nanochannel with adsorption effects: a) Diagram of Relative Covered Area vs. time at inlet and outlet cross-section of nanochannel; b) Diagram of adsorbed
Fig. 9. Conical model of nanochannel with larger inled cross-section and without adsorption effects; a) Field of concentration (units Mol/g) at time t = 0.00006 [h]; b) Field of Unit Mass
Flux (units are fg/( 2
h
)) at t = 0.00006 [h].
Fig. 10. Conical model of nanochannel with shrink at outlet cross-section and with adsorption effects: a) Field of concentration (units Mol/g) at time t = 0.00006 [h]; b) Field of Unit Mass
Flux (units are fg/( 2
h
)) at t = 0.00006 [h].
Fig. 11. Conical model of nanochannel with smaller inlet cross-section and without adsorption effects: a) Field of concentration (units Mol/g) at time t = 0.00006 [h]; b) Field of Unit Mass
Flux (units are fg/( 2
h
Fig. 12. Conical model of nanochannel with smaller inlet cross-section and with adsorption effects: a) Field of concentration (units Mol/g) at time t = 0.00006 [h]; b) Field of Unit Mass
Flux (units are fg/( 2
h
)) at t = 0.00006 [h].
Fig. 13. Conical model of nanochannel with smaller inlet cross-section and with adsorption effects: a) Diagram of concentration change at inlet and outlet cross-section of nanochannel, b)
Diagram of Cumulative Mass Release change at inlet and outlet cross-section of nanochannel.
Fig. 14. Conical model of nanochannel with smaller inlet cross-section and with adsorption effects: a) Diagram of Relative Covered Area change at inlet and outlet cross-section of nanochannel, b) Diagram of adsorbed Unit Mass Flux-Y at confined surface for two different
3.2. Comments of results
As we discussed before Figs 7.a and 13.a show that concentrations in both reservoirs at the end of FE simulation are the same, which demonstrates accuracy of our numerical procedure and implementation into our software PAK. Also, mass which leaves the inlet reservoir has to be the same with mass which enters the outlet reservoir; this can be seen form Figs 7.b and 13.b). If adsorption effects are includes, it can be seen from Figs 6.a, 10.a and 12.a that concentrations are larger at the interface of nanochannel; they are calculated according to eq. (13). In this zone Mass Flux in longitudal direction is equal to zero (Figs 6.b, 10.b and 12.b), while mass flux in direction normal to the surface is calculated from eq. (17). Relative covered area depends on concentration (eq. 13), which can be seen from diagrams on Figs 8.a and 14.a.
4. Concluding remarks
Based on the hierarchical model for diffusion (Ziemys et al. 2011), which couples MD and macroscale FE methods, we have presented an extension of the model to include adsorption at the surfaces bounding the nano-scale diffusion domain.
Also, a concept of generalization of the model to diffusion through porous media is outlined. This generalized model can lead to development of multiscale models applicable to diffusion in biological environment, as it is in intracellular space, or polymers. Development of these models will certainly require solution of many challenging tasks.
Acknowledgements - This project has been supported with federal funds from NASA under the contracts NNJ06HE06A and NNX08AW91G, Department of Defense under the contract DODW81XWH-09-1-0212, as well as funds from State of Texas Emerging Technology Fund, Nano Medical Systems (NMS), Alliance of NanoHealth (ANH), and University of Texas at Houston. The authors acknowledge the Texas Advanced Computing Center (TACC) at The University of Texas at Austin for providing HPC resources that have contributed to the research results reported within this paper.
3Tuftts University, Medford, MA 02155
Резиме
Дифузија у нанопростору се не одвија стриктно по Фиковом закону, који представља основни закон дифузије умакро-окружењима. Одступање од Фиковог закона се јавља
због утицаја површина, тј. због интеракције транспортних молекула и граничних
површина. Приступ хијерархијског моделирања који узима у обзир утицај граничних
површина је представљен у раду Зиемyс ет ал. (2011). У хијерархијском моделу се
применом концепта молекуларне динамике (МД) врши израчунавање функција
скалирањауциљу кориговања дифузионог коефицијента уодносу натакозвану “булк” вредност (вредност која одговара слободној дифузији). Затим се, уз коришћење
коригованих вредости дифузионог коефицијента, врши моделирање процеса дифузије
применомметодеконачнихелемената (МКЕ) уоквируинкрементално-итеративнешеме. Уовомрадусмосумиралирезултатехијерархијскогмодела (моделанавишескала) и изложилињеговоуопштењекојеузимауобзирадсорбцију назидовимамодела. Такође
смо дали кратак преглед о могућим даљим применама хијерархијског моделирања
процеса дифузије кроз комплексан медијум састављен од дистрибуираних солида, као штојеслучајсаполимеримаибиолошкимфлуидима.
Кључне речи: дифузија, транспорт молекула, молекуларна динамика, метод коначних елемената, утицајповршинаунанопросторима.
References
Aggarwal, N., J. Sood, and K. Tankeshwar, Anisotropic diffusion of a fluid confined to different geometries at the nanoscale. Nanotechnology, 2007. 18(33): p. 5.
Alpert, S. and G. Banks, The concentration dependence of the hemoglobin mutual diffusion coefficient. Biophysical Chemistry, 1976. 4(3): p. 287-296.
Bathe, K., Finite element procedures. 1996, Englewood Cliffs, New Jersey: Prentice-Hall. Broughton, J., et al., Concurrent coupling of length scales: Methodology and application.
Physical Review B, 1999. 60(4): p. 2391-2403.
Caro, J., et al., Zeolite membranes-state of their development and perspective. Microporous and Mesoporous Materials, 2000. 38(1): p. 3-24.
Cruz-Chu, E.R., A. Aksimentiev, and K. Schulten, Water-silica force field for simulating nanodevices. J Phys Chem B, 2006. 110(43): p. 21497--21508.
Fine, D., et al., A robust nanofluidic membrane with tunable zero-order release for implantable dose specific drug delivery. Lab on a Chip, 2010.
Gardeniers, H. and A. Berg, Micro-and nanofluidic devices for environmental and biomedical applications. International Journal of Environmental Analytical Chemistry, 2004. 84(11): p. 809-819.
Gladden, J.K. and M. Dole, Diffusion in supersaturated solution-II: glucose solutions. J. Am. Chem. Soc., 1953. 75: p. 3900-3904.
Grattoni, A., et al., Nanochannel Systems for Personalized Therapy and Laboratory Diagnostics. Current Pharmaceutical Biotechnology, 2010. 11(4): p. 343-365.
Hou, T. and X. Wu, A Multiscale Finite Element Method for Elliptic Problems in Composite Materials and Porous Media* 1. Journal of Computational Physics, 1997. 134(1): p. 169-189.
Hughes, T., The finite element method: linear static and dynamic finite element analysis. 2000, New York: Dover Publications.
Iijima, S., Helical microtubules of graphitic carbon. Nature, 1991. 354(6348): p. 56-58.
Jorgensen, W.L., et al., Comparison of simple potential functions for simulating liquid water. Journal of Chemical Physics, 1983. 79(2): p. 926-935.
Karniadakis, G., A. Beskok, and N.R. Aluru, Microflows and nanoflows : fundamentals and simulation. 2005, New York, NY: Springer.
Kojic M, Filipovic N, Tsuda A (2006). A multiscale method for bridging dissipative particle dynamics and Navier-Stokes finite element equations for incompressible fluid and its application in biomechanics. Proc. First South-East European Conference on Comp. Mechanics (Eds. M. Kojic and M. Papadrakakis), Kragujevac, Serbia.
Kojic M, Filipovic N, Stojanovic B, Kojic N (2008a). Computer Modeling in Bioengineering: Theoretical background, examples and software. 200, 8: John Wiley & Sons.
Kojic M, Filipovic N, Tsuda A (2008b). A mesoscopic bridging scale method for fluids and coupling dissipative particle dynamics with continuum finite element method, Comp. Meth.
Appl. Mech. Engrg., 197, 821-833.
Kojic, N., A. Kojic, and M. Kojic, Numerical determination of the solvent diffusion coefficient in a concentrated polymer solution. Communications in Numerical Methods in Engineering, 2006. 22(9): p. 1003-1013
Kojic M, Slavkovic R, Grujovic N, Zivkovic M, Filipovic N. (1998, 2009) PAK – FE program for linear and nonlinear analysis for solids, fluids, mass and heat transfer, biomechanics and coupled problems; Mech. Eng. Faculty, University of Kragujevac; R & Center for Bioengineering, Kragujevac, Serbia.
MacKerell Jr, A., et al., All-Atom Empirical Potential for Molecular Modeling and Dynamics Studies of Proteins†. Journal of Physical Chemistry B, 1998. 102(18): p. 3586-3616. Phillips, J.C., et al., Scalable molecular dynamics with NAMD. J Comput Chem, 2005. 26(16):
p. 1781-1802.
Rapaport DC (2004). The Art of Molecular Dynamics Simulation, Cambridge University Press Rudd, R. and J. Broughton, Coarse-grained molecular dynamics and the atomic limit of finite
elements. Physical Review B, 1998. 58(10): p. 5893-5896.
Ziemys, A., et al., Confinement Effects on Monosaccharide Transport in Nanochannels. The Journal of Physical Chemistry B, 2010: p. 132-137.
Ziemys, A., M. Ferrari, and C.N. Cavasotto, Molecular Modeling of Glucose Diffusivity in Silica Nanochannels. Journal of Nanoscience and Nanotechnology, 2009. 9: p. 6349-6359. Ziemys A, Kojic M, Milosevic M, Kojic N, Hussain F, Ferrari M, Grattoni A (2011).
Hierarchical modeling of diffusive transport through nanochannels by coupling molecular dynamics with finite element method, Journal of Computational Physics, 230, 5722–5731. Wagner GJ, Liu WK (2003). Coupling of atomistic and continuum simulations using a bridging
![Fig. 5. h(units Mol/g) at time t = 0.00003 [h]; b) Field of Unit Mass Flux (units are fg/( Cilindrical model of nanochannel without adsorption effects: a) Field of concentration 2)) at time t= 0.00003 [h]](https://thumb-us.123doks.com/thumbv2/123dok_us/8370687.1675109/9.499.75.449.437.570/field-units-cilindrical-nanochannel-adsorption-effects-field-concentration.webp)
![Fig. 9. Conical model of nanochannel with larger inled cross-section and without adsorption effects; a) Field of concentration (units Mol/g) at time t = 0.00006 [h]; b) Field of Unit Mass Flux (units are fg/( 2 h)) at t = 0.00006 [h]](https://thumb-us.123doks.com/thumbv2/123dok_us/8370687.1675109/11.499.73.455.113.250/conical-nanochannel-larger-section-adsorption-effects-field-concentration.webp)
![Fig. 12. Conical model of nanochannel with smaller inlet cross-section and with adsorption effects: a) Field of concentration (units Mol/g) at time t = 0.00006 [h]; b) Field of Unit Mass h](https://thumb-us.123doks.com/thumbv2/123dok_us/8370687.1675109/12.499.57.416.436.561/conical-nanochannel-smaller-section-adsorption-effects-concentration-field.webp)
