Volume-6 Issue-1
International Journal of Intellectual Advancements
and Research in Engineering Computations
Abstract:Now-a-days lean concepts are being implemented in many manufacturing industries for the identification of non-value added activities (NVA) and to reduce wastes to improve productivity. The electrical motor manufacturing industry has been selected for the investigation to identify the scope of implementing lean principles. The investigation results showed that NVAs found to be more in storage of semi-finished products in between machines, transporting parts, dimensional measurements and issues in workplace design with ergonomics perspective. Hence an object is set in this project to identify the NVA by plotting value stream mapping (VSM). Data collected from industries were used to draw present state VSM. Suitable lean tools were identified and suggested to reduce NVA. Future state map of VSM is drawn by incorporating improvement suggestions.
Key words: Cycle time, Non value added time, Value Stream Mapping.
I. INTRODUCTION
Success of any industry is identified by its ability to quickly respond to the market changes. So the industries pay more importance on reducing their manufacturing lead times. Reductions in manufacturing lead time can generate numerous benefits, including lower work in process and finished goods inventory levels, improved productivity and lower costs. More importantly, reductions in manufacturing lead time increases response time between workstations/machines and reduce the time required to respond to customer orders. Manufacturing Lead Time refers to the total time it takes to complete the manufacturing process of a product. It is the time from when an order is ready to start on the production line to when it becomes a finished good. A lead time is the period of time between the initiation of any process of production and the completion of that process. Literature related to lean manufacturing concepts were reviewed to identify the lean tools which could be adoptable to electrical manufacturing industries in the next section.
II. LITERATUREREVIEW
Vinod V Rampur (2017) has described the methodology of lean and VSM that can be applied for a small company and also stated that it is a powerful tool to identify the inefficiencies and improvement areas.
Fatimah MutasharYasir (2015) has explained aboutdifferences in lean and mass production and how effectivelynon value added waste can be eliminated in lean productionby using different strategies.
Eswaramoorthi et al have explained the scope of implementing lean concepts in machine tool industry (2010) and suggested a flow index for identifying the unbalance between workstations of assembly line (2011).
Hopp et al. (1990) have described the use of value stream mapping (VSM) and benefits of VSM like identifying potential areas to concentrate for reducinglead time to meet the customer demand and different lean tools associated with it.
Jayaganthan (2014) has described about the ways to reduce the non-value added activity in a company.
KarthikeyanIyer (2006) investigated the value stream mapping using TRIZ as tool to reduce the lead time.
A literature review has been carried out on lean supply chain using a structured content analysis by Paschal Ugochukwuet al. (2008).
From this literature survey, it is understood that VSM can be used as a tool primarily to map the processes in any industries to identify the non-value added activities. Improvements can be visualized by drawing future state VSM with suggestion for implementing lean tools where non-value added activities found to be more.
Implementing Lean Concepts in Electrical Motor Manufacturing Industry
M.Easwaramoorthi
1, S. Rajkumar
2, G.Ramesh
2,
1Professor,
2UG Students,
Department of Mechanical Engineering, Nandha Engineering College, Erode-52,
Tamil Nadu, India.
III. PROBLEMDEFINITION
As discussed in the introduction section, the concept of lean is all about improving value added time of production processes and cost reduction. But, small scale industries are not well aware of lean manufacturing concepts and find difficultly in implementation of lean principles. In order to assess the reality of issues in industries, a small scale industry is chosen to study the scope for implementing lean concepts. The industry located near Coimbatore is involved in manufacturing electrical motors. Problem identified by a team of members visited industry are listed below.
Movement of semi-finished products between workstations/machines (transportation)
More time taken for inspecting components
Human strain due to repetitive motions and awkward posture
A. OBJECTIVES
Based on the problems identified in the industry, objectives described below are set in this project.
To identify potential area of non-value added activities in the electrical motor manufacturing industry.
To suggest suitable lean tools to reduce the lead time of the manufacturing process.
IV. METHODOLOGYANDRESULTS
A methodology proposed in this project to meet the above objectives is presented below.
Fig.1 Methodology
1. INDUSTRY VISIT AND OBSERVATION
A project team visited an electrical motor manufacturing industry located in Coimbatore. Manufacturing processes of electrical motor were studied and process flow of varies activities was observed. A flow diagram showing the process flow of motor manufacturing is presented in Fig. 2.
R A W M A T E R IA L B R O A C H IN G H E A T IN G A S S E M B L Y R O T O R W IT H S H A F T C O O L IN G T U R N IN G IN S P E C T IO N B A L A N C IN G IN S P E C T IO N A S S E M B L Y W A R N IS H R A W M A T E R IA L C O IL F O R M IN G C O IL I N S E R T IN G F O R M IN G S O L D E R IN G L A S H IN G F IN A L F O R M IN G IN S P E C T IO N B O D Y A N D S T A T O R S S T O R A G E E X P A N D P R E S S IN G D R IL L IN G T U R N IN G IN S P E C T IO N D IS P A T C H M A C H IN E S H O P W IN D IN G S p ig o t
Fig.2 Process flow chart
The above process flow diagram describes the 1 horse power (hp) electrical motor manufacturing process. The electrical motor has consisted of two major parts such as stator and rotor. The raw material undergoes manufacturing processes at machine shop, winding and spigot section. In machine shop, rotor& shaft assembly, rotor surface facing and balancing works are carried out. Finally, balanced finished rotor was dispatched to final assembly section. In winding Identifying potential areas of lean
implementation
Developing future state VSM
Industry visit and observation of industrial practices
Collection of data
Developing VSM for current state
Analysis of current state VSM
and spigot section, a process of stator coil winding is carried out. After final assembly, 1 hp electrical motor was send to inspection and dispatch.
2. COLLECTION OF DATA
Data required for developing VSM such as customer demand per day, available time for working time, cycle time, etc. were collected by observation.
3. DEVELOPING VSM FOR CURRENT STATE
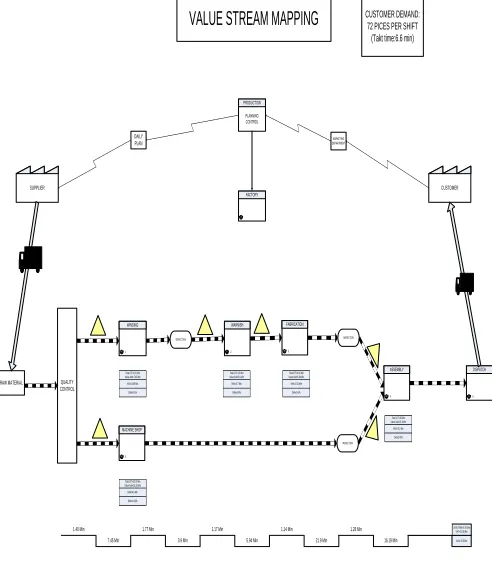
After collection of data from electrical motor manufacturing industry current state value stream mapping is developed based on activities in the process, cycle time and non-value added activities. The current state map for machine shop, winding, assembly process of electrical motor production is shown in Fig. 3.
SUPPLIER CUSTOMER
PLANNING CONTROL PRODUCTION
RAW MATERIAL
1 WINDING
5 MACHINE SHOP
2 WARNISH
QUALITY CONTROL
INSPECTION
INSPECTION 3 FABRICATION
INSPECTION
4 ASSEMBLY
6 DISPATCH FACTORY
NVA=3.05 Min Defect=1% Total C/T=10.5 Min Value Add=7.45 Min
NVA=1.05 Min Defect=5% Total C/T=6.99 Min Value Add=5.94 Min NVA=0.7 Min Defect=0% Total C/T=1.6 Min Value Add=0.9 Min
NVA=3.1 Min Defect=0% Total C/T=25 Min Value Add=21.9 Min
NVA=4.6 Min Defect=10% Total C/T=20.79 Min Value Add=16.19 Min
7.45 Min 1.40 Min
0.9 Min 1.77 Min
5.94 Min 1.17 Min
21.9 Min 1.14 Min
16.19 Min 1.28 Min
NVA=12.5 Min LEAD TIME=6.76 Min VAT=52.38 Min MARKETING
DEPARTMENT DAILY
PLAN
VALUE STREAM MAPPING CUSTOMER DEMAND: 72 PICES PER SHIFT (Takt time:6.6 min)
Fig.3 Current value stream mapping for 1 hp electrical motor
Value stream mapping highlights the material flow and information flow from suppliers to the customers. Cycle time, value added time and non-value added time observed in the industry are listed in Table 1.
Table 1: Existing processes and cycle time
Process Cycle time in (min)
Value added time in (min)
Non-Value added time in (min)
Machine shop 20.79 16.19 4.6
Winding 10.5 7.45 3.05
Varnish 1.6 0.9 0.7
Spigot 6.99 5.94 1.05
Assembly 25 21.9 3.1
TOTAL 64.88 52.38 12.5
The lead time to produce 1 hp electrical motor was 64.88 min per motor. The value added activity was found to be 52.38 min with non-value added activity of 12.5 min.The major
parameters for developing VSM are calculated as follows:
Manufacturing cycle time (CT):
The cycle time is calculated usually using s stop watch. It is the time required to complete a certain task from start to finish of production process. The cycle time helps to know the production time of individual parts and value added and non-vale added activities (Hopp, et al. 1990)
.
CT=LT= + + +
Where:
Tw= waiting time, Ts= set up time, Tp= processing time, Ti= inspection time and LT= lead time.
Example: cycle time for a part manufactured in turning process is give below.
Waiting time = 1.25 min Setup time = 20 sec Processing time = 1 min. 13 sec Inspection time =1 min. 30 sec Cycle time = 4 min.28sec.
Throughput (TH) (part/hour) Standridge2004.
TH =
Where:
= work in process (unit) and = manufacturing cycle time (min).
Example: Throughput time for a part in winding section.
TH = 7.45 min/10.5 min = 0.70 min.
Takt time,This helps to identify the manufacturing process that is lesser or greater than the takt time and helps to identify if they can possibly meet the customer demand on time or there is a delay in the process. Mathematically it is expressed as follows (Vinod V Rampur,2017).
= =
= 6.6min
4. ANALYSIS OF CURRENT STATE VSM
Current state value stream mapping gives a clear picture about long time spent for transportation of components, measurement of rotor dimensions and human strain due to repetitive motions at man-machine interface.
5. IDENTIFYING POTENTIAL AREAS
The following suggestions are proposal to reduce the non-value added activities discussed in section 4.
Layout change
Ergonomic analysisA)
Kaizen
Kaizen is a continuous improvement tool which is used to reduce the non-value added activities in the rotor run out checking area. A kaizen proposed in this project would reduce cycle time from 1 min 30 sec to 30 sec for a rotor during the inspection. The model of the proposal kaizen is shown in Fig. 4.
Fig.4 Kaizen for rotor runout checking
B)
Layout change
Non-value added activities due to transportation could be reduced by changing the layout. The details are given below.
Table 2: Transportation values sections Transportation time (min)
Before After
Balancing machine to turning machine
1 0.05
Spigot to assembly
0.6 0.1
Varnish to assembly
0.7 0.1
C)
Ergonomic analysis
Human strain in the man machine interface is identified and shown in Fig.5.
Fig. 5.Ergonomic analysis
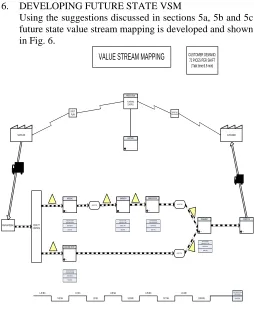
6. DEVELOPING FUTURE STATE VSM
Using the suggestions discussed in sections 5a, 5b and 5c future state value stream mapping is developed and shown in Fig. 6.
SUPPLIER CUSTOMER
PLANNING CONTROL PRODUCTION
RAW MATERIAL
1 WINDING
5 MACHINE SHOP
2 WARNISH
QUALITY CONTROL
INSPECTION
INSPECTION 3 FABRICATION
INSPECTION
4 ASSEMBLY
6 DISPATCH FACTORY
NVA=3.05 Min Defect=1% Total C/T=10.5 Min Value Add=7.45 Min
NVA=0.4 Min Defect=4% Total C/T=6.99 Min Value Add=6.59 Min NVA=0.1 Min Defect=0% Total C/T=1.6 Min Value Add=1.5 Min
NVA=1.3 Min Defect=0% Total C/T=25 Min Value Add=23.7 Min
NVA=3.45 Min Defect=8% Total C/T=19.29 Min Value Add=15.84 Min
7.45 Min 1.40 Min
1.5 Min 1.0 Min
6.59 Min 1.06 Min
23.7 Min 1.05 MIn
15.84 Min 1.21 Min
NVA=8.3 Min LEAD TIME=5.72 Min
VAT=55.08 Min MARKETING
DEPARTMENT DAILY
PLAN
VALUE STREAM MAPPING CUSTOMER DEMAND: 72 PICES PER SHIFT (Takt time:6.6 min)
Fig.6 Future value stream mapping for 1 hp electrical motor
The value added activity after implementing improvements was found to be 55.08 min and non-value added activity observed was 8.3 min. After implementing lean techniques and concepts the lead time is reduced by 1.5 min and the non-value added is reduced by 4.2 min.
Table 3: Exhibits the improved cycle time, value added time and non-value added time
Process
Cycle time in (min)
Value added time in (min)
Non-Value added time in (min)
Machine shop 19.29 15.84 3.45
Winding 10.5 7.45 3.05
Varnish 1.6 1.5 0.1
Spigot 6.99 6.59 0.4
Assembly 25 23.7 1.3
Total 63.38 55.08 8.3
7. MEASURE BENEFITS
V. CONCLUSION
Implementing Lean concepts is an effective and efficient way to enhance the competitiveness of manufacturing. This project described the different lean concepts applied in electrical motor manufacturing industry with an aim to reduce the lead time of the manufacturing process. Value stream mapping has been drawn for the production line to estimate the value added and non-value added activities. For 1 hp electrical motor the lead time was found to be 1352 min and after implementation of lean technique it got reduced to 1144 min, NVA of 208 min. was reduced which helped the industry to improve their productivity.
REFERENCES
1.
Dinesh J. and PrabhukarthiA., 2013, Reduction of Lead Time Using Value Stream Mapping in Pump Manufacturing Industry, Proceedings of the National Conference onManufacturing Innovation Strategies & Appealing Advancements, PSG College ofTechnology, Coimbatore, India, PP. 1-6.2.
Eswaramoorthi, G.R. Kathiresan, T.J. Jayasudhan, P.S.S. Prasad & P.V. Mohanram (2011): Flow index based line balancing: a tool to improve the leanness of assembly line design, International Journal of Production Research,DOI:10.1080/00207543.2011.575895.3.
Eswaramoorthi, G.R. Kathiresan, P.S.S.Prasad, P.V.Mohanram “A survey on lean practices in Indian machine tool industries” International journal of advanced manufacturing technology, volume 52: 1091-1101, 2011 pp 103-109.4. Fatimah MutasharYasir, 2015,Reducing of Manufacturing Lead Time by Implementation of Lean Manufacturing Principles, International Journal of Scientific & Engineering Research, ISSN: 2278-0181, Vol. 6, Issue.06, PP.762-766.
5. Hopp, W. J., Spearman, M. L., Woodruff, D. L., 1990, Practical Strategies of Lead Time Reduction, Manufacturing Review, Vol. 3, No. 2, pp.78-84.
6. Jayaganthan., “Lead time reduction through value stream mapping”, International Journal of IT, Engineering and Applied Sciences Research (IJIEASR) ISSN: 2319-4413 Volume 3, No. 5, May 2014, pp 531-539.