Hybrid neural network approach for predicting maintainability of
object-oriented software
LOVKUMAR1ANDSANTANUKU. RATH2
Department of Computer Science and Engg. NIT Rourkela, Rourkela
Odisha - 769008, India.
Abstract. Estimation of different parameters for object-oriented systems development such as effort, quality, and risk is of major concern in software development life cycle. Majority of the approaches available in literature for estimation are based on regression analysis and neural network techniques. Also it is observed that numerous software metrics are being used as input for estimation. In this study, object-oriented metrics have been considered to provide requisite input data to design the models for prediction of maintainability using three artificial intelligence (AI) techniques such as neural network, Neuro-Genetic (hybrid approach of neural network and genetic algorithm) and Neuro-PSO (hybrid ap-proach of neural network and Particle Swarm Optimization). These three AI techniques are applied to predict maintainability on two case studies such as User Interface System (UIMS) and Quality Evalua-tion System (QUES). The performance of all three AI techniques were evaluated based on the various parameters available in literature such as mean absolute error (MAE) and mean Absolute Relative Error (MARE). Experimental results show that the hybrid technique utilizing Neuro-PSO technique achieved better result for prediction of maintainability when compared with the other two.
Keywords: Artificial neural network, software metrics, Genetic algorithm, maintainability, Neurons, Particle swarm optimization, QUES, UIMS.
(Received August 28th, 2014 / Accepted January 22th, 2015)
1 Introduction
Maximum amount of cost is always associated with any software product over its lifetime during software main-tenance period. One of the approaches for controlling maintenance costs is to utilize software metrics during the development phase [2]. A number of metrics are available in literature to evaluate the quality of software [6][1][13]. In practice, reliability and maintainability play a major role to meet quality. Reliability is gener-ally measured in terms of the number of faults found in the developed software during a particular time period. Maintainability is typically measured in terms of effort given for change. Change effort can mean either the av-erage effort to make a change to a class or component
or connector or configuration, or the total effort spent on changing these elements.
Metrics-based maintainability prediction helps to reduce future maintenance efforts by enabling devel-opers, identifying the determinants of software qual-ity, and improving quality of design or coding. It also provides managers with information for more effective planning of valuable resources [19]. In order to pre-dict the maintainability of a different elements (Ob-ject, Class, Method, etc.), several statistical methods are available in literature. But less importance has been given on use of machine learning techniques. Artifi-cial intelligence techniques, a subset of machine learn-ing methods have the ability to measure the properties
Kumar and Rath Hybrid neural network approach for predicting maintainability of object-oriented software 11 of a class of object-oriented software, that human
be-ings recognize as intelligent behavior. These methods are able to approximate the non-linear function with more precision. Hence they can be applied for pre-dicting maintainability in order to achieve better accu-racy. In this paper, ANN with gradient descent learning method [3], hybrid approach of neural network and par-ticle swarm optimization such as Neuro-PSO [18], and hybrid approach of ANN and genetic algorithm such as Neuro-genetic (Neuro-GA) [5] techniques are used for maintainability prediction on two commercial soft-ware product such as User Interface System (UIMS) and Quality Evaluation System (QUES). To train these models, object-oriented software metrics are consid-ered as input data.
The remainder of the paper is organized as follows: Section 2 shows the related work in the field of software maintainability estimation and object-oriented metrics. Section 3 highlights on research background related to this study. Section 4 briefs about the methodolo-gies used to estimate the maintainability. Section 5 highlights on the results for maintainability prediction, achieved by applying ANN, GA, and Neuro-PSO techniques. Section 6 represents a comparison on the performance of the designed models based on the different performance parameters. In Section 7 threats to validity have been discussed and Section 8 concludes the paper with scope for future work.
2 Related work
It is observed in literature that software metrics are used in design of prediction models which serve the purpose of computing the prediction rate in terms of accuracy such as fault, effort, re-work, and maintainability.
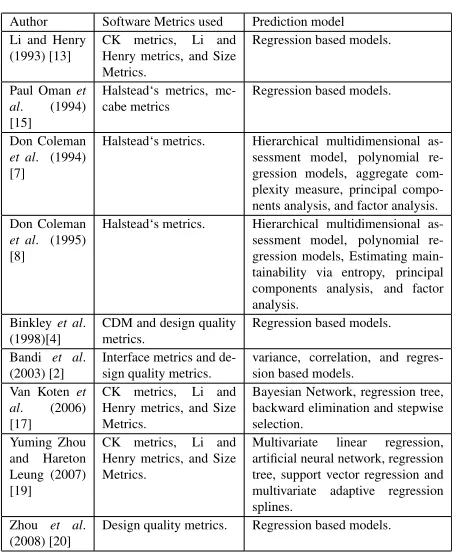
In this work, the use of software metrics for main-tainability prediction has been emphasis. Table 1 shows the summary of literature review on maintainability; where it describes the applicability of numerous soft-ware metrics available in literature in designing respec-tive prediction models. Table 1 also shows the differ-ent prediction models used in literature for predicting maintainability.
From Table 1, we interpreted that many of the au-thors have used statistical methods such as regression based analysis and their different deviations in predict-ing the maintainability. But keen observation reveals that very less work has been carried out on application of neural network models for designing their respec-tive prediction models. Neural network models over the years have seen an explosion of interest, and ap-plicability across a wide range of problem domain. In-deed, these models can be mainly used to solve
prob-Table 1:Summary of Empirical Literature on Maintainability
Author Software Metrics used Prediction model Li and Henry
(1993) [13]
CK metrics, Li and Henry metrics, and Size Metrics.
Regression based models.
Paul Omanet al. (1994) [15]
Halstead‘s metrics, mc-cabe metrics
Regression based models.
Don Coleman
et al. (1994) [7]
Halstead‘s metrics. Hierarchical multidimensional as-sessment model, polynomial re-gression models, aggregate com-plexity measure, principal compo-nents analysis, and factor analysis. Don Coleman
et al. (1995) [8]
Halstead‘s metrics. Hierarchical multidimensional as-sessment model, polynomial re-gression models, Estimating main-tainability via entropy, principal components analysis, and factor analysis.
Binkleyet al. (1998)[4]
CDM and design quality metrics.
Regression based models.
Bandi et al. (2003) [2]
Interface metrics and de-sign quality metrics.
variance, correlation, and regres-sion based models.
Van Kotenet al. (2006) [17]
CK metrics, Li and Henry metrics, and Size Metrics.
Bayesian Network, regression tree, backward elimination and stepwise selection.
Yuming Zhou and Hareton Leung (2007) [19]
CK metrics, Li and Henry metrics, and Size Metrics.
Multivariate linear regression, artificial neural network, regression tree, support vector regression and multivariate adaptive regression splines.
Zhou et al. (2008) [20]
Design quality metrics. Regression based models.
lems related to prediction and classification and act as efficient predictors of dependent as well as independent variables due to its special modeling technique where in they posses the ability to model complex functions. In this paper, software metrics have been considered for predicting maintainability by applying three artifi-cial intelligence techniques, based on neural network applications.
3 Research background
The following subsections highlight on the data set used for predicting maintainability. Data normalization and cross-validation methods have been considered to ob-tain better accuracy, and then dependent and indepen-dent variables are chosen for models to be applied for maintainability estimation.
3.1 Metrics set
Kumar and Rath Hybrid neural network approach for predicting maintainability of object-oriented software 12 Table 2:Definition of the metrics used [13]
Metric Description
Weighted method per class (WMC). Sum of the complexities of all class methods.
Depth of inheritance tree (DIT). Maximum length from the node to the root of the tree.
Number of children (NOC). Number of immediate sub-classes subordinate to a class in the class hierarchy.
Response for class (RFC). A set of methods that can potentially be executed in response to a mes-sage received by an object of that class.
Lack of cohesion among methods (LCOM).
Measures the dissimilarity of methods in a class via instanced variables.
Message-passing coupling (MPC). The number of send statements defined in a given class. Data abstraction coupling (DAC). The number of abstract data types defined in a given class. Number of methods (NOM ). The number of methods implemented within a given class.
SIZE1. The number of semicolons in a given class.
SIZE2. Total number of attributes and local methods in a given class.
or ‘deletion’ of lines of code in a class [13]. The metrics selected in this study are tabulated in Table 2.
3.2 Effectiveness of metrics
Once the maintenance data values are determined, an attempt is made to establish a relationship between the maintainability and the metrics. Hence in this ap-proach, change is considered as a dependent variable and each of the software metrics as an independent vari-able while developing the relation. Maintainability is thus assumed to be a function of WMC, DIT, NOC, RFC, LCOM, MPC, DAC, NOM, SIZE1, and SIZE2, and is represented as:
M aintainability=f(W M C, DIT, N OC, RF C, LCOM, M P C, DAC, N OM, SIZE1, SIZE2)
(1)
3.3 Case study
In this paper, to analyze the effectiveness of the pro-posed approach, the data sets (metric values) of two commercial software system used by Li and Henry (1993) are considered as case studies [13]. Software systems such as User Interface System (UIMS) and Quality Evaluation System (QUES) are chosen for com-puting the maintainability, which are developed us-ing Classic-Ada language. Classic-ADa is an object-oriented programing language that adds the capabil-ity of object-oriented programing to ADa by providing object-oriented construct in addition to the ADa con-structs [13]. Classic-ADa metrics analyzer has been used to gather metrics from Classic-ADa’s design and source code. The data set for over three years is being
considered for our analysis. UIMS and QUES software system have 39 and 71 classes respectively.
3.4 Descriptive statistics
This subsection highlights on the descriptive statistics of maintainability data. The metric values of the UIMS and QUES systems comprising the CK metric suite, Li & Henry, SIZE, and Change metrics, which in turn con-stitute the data set for the respective software systems along with their descriptive statistics such as Min, Max, Median, Mean, and Standard deviation are tabulated in Table 3.
In this analysis, we disregarded the CBO metric of the CK metrics suite for computing maintainability as it measures “non-inheritance related coupling" [6]. Also the derivative of inheritance metric ‘NOC’ in QUES software product, has all its 71 classes with NOC val-ues as zero. This indicates that there are no imme-diate sub-classes of a class in the class hierarchy and hence NOC is not considered in computing maintain-ability in this analysis. From Table 3, we understood that the DIT metric has low value of median and mean for both UIMS and QUES data sets. The low value of median and mean for DIT shows that inheritance is not being used in both software system. Similarly medians and means of NOM and SIZE2 are found in the UIMS and QUES data sets and they suggest that the class size at the design level in both systems are similar. How-ever, the medians and means of SIZE1 in the QUES data set are significantly larger than those in the UIMS data set. This suggests that the complexities of the prob-lems processed by the two systems are rather different. Moreover, the medians and means of RFC and MPC in the QUES data set are of greater value in comparison
Kumar and Rath Hybrid neural network approach for predicting maintainability of object-oriented software 13 Table 3:Descriptive statistics of classes for UIMS and QUES [13]
UIMS WMC DIT NOC RFC LCOM MPC DAC NOM SIZE1 SIZE2 CHANGE
Max. 69 4 8 101 31 12 21 40 439 61 289
Min. 0 0 0 2 1 1 0 1 4 1 2
Median 5 2 0 17 6 3 1 7 74 9 18
Mean 11.38 2.15 0.94 23.20 7.48 4.33 2.41 11.38 106.44 13.97 46.82
Std Dev. 15.89 0.90 2.01 20.18 6.10 3.41 4.00 10.21 114.65 13.47 71.89
QUES WMC DIT NOC RFC LCOM MPC DAC NOM SIZE1 SIZE2 CHANGE
Max. 83 4 0 156 33 42 25 57 1009 82 42.09
Min. 1 0 0 17 3 2 0 4 115 4 6
Median 9 2 NA 40 5 17 2 6 211 10 52
Mean 14.95 1.91 0 54.38 9.18 17.75 3.44 13.41 275.58 18.03 62.18
Std Dev. 17.05 0.52 0 32.67 7.30 8.33 3.91 12.00 171.60 15.21 42.09
to UIMS data set. This suggests that the coupling be-tween classes in the QUES is higher than those in the UIMS. In contrast, the median and mean of LCOM in the QUES data set are similar to the median and mean of LCOM in the UIMS data set and implies that these two systems have similar cohesion. It can also be seen that the mean of CHANGE in the QUES data set is larger than that in the UIMS data set.
3.5 Data normalization technique
Normalization of input feature values has been carried out, over the range [0,1], so as to adjust the defined range of input feature values and avoid the saturation of neurons. In literature, techniques such as Min-Max nor-malization, Z-Score nornor-malization, and Decimal scal-ing are available for normalizscal-ing the data. In this study, we consider Min-Max normalization technique to nor-malize the data [10]. Min-Max normalization technique has been considered in this study because it has the ad-vantage of preserving exactly all relationships in the data, which is usually not possible to avail using other similar techniques. It performs a linear transformation on the original data. After applying Min-Max normal-ization, each attribute will lie within the range of [0,1] values and it will remain same. Min-Max normalization is calculated by using the following Equation:
N ormalized(x) =x0= x−min(X)
max(X)−min(X) (2)
where min(X) and max(X) represent the minimum and maximum values of the attribute X respectively.
3.6 Cross-validation method
Cross-validation is a statistical learning method which is used to evaluate and compare the models by parti-tioning the data into two portions. One portion of the
divided set is used to train or learn the model and the rest of the data is used to validate the model.
K-fold cross-validation is the basic form of cross validation [12]. In K-fold cross-validation the data are first partitioned intoK equal (or nearly equally) sized portions or folds. For each of theKmodel,K-1 folds are used for training and the remaining one fold is used for testing purpose. The significance of K-fold-cross-validation lies in it’s ability to use the data set for both training and testing. So the performance of each model on each fold can be tracked using predetermined per-formance metrics available in literature. In literature, it is observed that 5-fold and 10-fold cross-validation ap-proaches have been used for designing a model. In this paper, 10-fold cross-validation is used in QUES and 5-fold cross-validation is used in UIMS for comparing the models, i.e., data sets are divided into 10 and 5 parts in QUES and UIMS respectively (each fold in both QUES and UIMS contain seven number of data samples).
4 Techniques for predicting Maintainability
The subsequent subsections highlight on the use of arti-ficial intelligence techniques (AI) for predicting main-tainability [3][14]. These AI techniques are:
• 1. Artificial neural network (ANN) with Gradient descent learning method [3][14].
• 2. Hybrid approach of ANN and genetic algo-rithm (Neuro-GA (NGA) and Adaptive Neuro-GA (ANGA)) [5].
• 3. Hybrid approach of ANN and Particle Swarm Optimization (Neuro-PSO (NPSO) and Modified Neuro-PSO (MNPSO)) [18].
4.1 Artificial neural network (ANN) model
Kumar and Rath Hybrid neural network approach for predicting maintainability of object-oriented software 14 predicting maintainability using object-oriented metrics
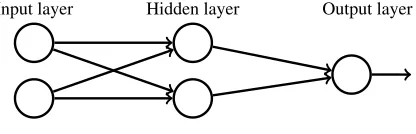
for two software products UIMS and QUES. Figure 1 shows the architecture of ANN, which contains three layers, namely input layer, hidden layer, and output layer.
Input layer Hidden layer Output layer
Figure 1:Artificial neural network
Here, for input layer, linear activation function is used, and for hidden layer and output layer, sigmoidal function or squashed-S function is used.
Neural network can be represented as:
Y0=f(W, X) (3)
whereXis the input vector, Y0 is the output vector, and
Wis the weight vector. The weight vectorWis updated in every iteration so as to reduce Mean Square Error (MSE). MSE is is calculated using following equation
M SE = 1
n
n X
i=1
(yi0−yi)2 (4)
where y is the actual output and y0 is the expected out-put.
Different methods are available in literature to up-date weight vector ‘W’ such as Gradient descent, New-ton’s method, Quasi-Newton method, Gauss Newton conjugate-gradient method, and Levenberg Marquardt method etc. In this study, we considered Gradient de-scent method for updating the weight vector ‘W’ be-cause, although the convergence of Gradient descent method is stable, but the computation complexity is low as compared with other methods.
Gradient descent learning method is used for updat-ing the weights durupdat-ing learnupdat-ing phase [3]. It uses first-order derivative of total error to find the minima in er-ror space. Normally Gradient vectorGis defined as the 1st order derivative of error functionEk, and the error
function is represented as:
Ek= 1
2(y
0
k−yk)2 (5)
Gradient vectorGis represented as:
G=∂Ek
∂W = ∂1
2((y
0
k−yk)2)
∂W (6)
After obtaining the value of gradient vector G in each iteration, weighted vectorW is updated as:
Wk+1=Wk−αGk (7)
whereWk+1 is the updated weight,Wk is the current
weights,Gk is gradient vector,αis the learning
con-stant, y and y0 are the actual and expected output re-spectively.
4.2 Neuro-Genetic (NGA) Approach
In this approach, genetic algorithm is used for updat-ing the weight durupdat-ing learnupdat-ing phase. A neural network with a configuration of ‘l-m-n’ has been considered for estimation, i.e., the network consists of ‘l’ number of input neurons, ‘m’ number of hidden neurons, and ‘n’ number of output neurons. In this paper, for input layer, linear activation function is used, and for hidden layer and output layer, sigmoidal function or squashed-S function is used.
The number of weightsN required for this network with a configuration of ‘l-m-n’ can be computed using the following equation:
N = (l+n)∗m (8) with each weight (gene) being a real number and assuming the number of digits (gene length) in weights to bed. The length of the chromosomeLis computed using the following equation:
L=N∗d= (l+n)∗m∗d (9)
For determining the fitness value of each chromo-some, weights are extracted from each chromosome us-ing the followus-ing equation:
Wk=
if0<=xkd+1<5
−xkd+2∗10d−2+xkd+3∗10d−3+....+x(k+1)d
10d−2
if5<=xkd+1<= 9
+xkd+2∗10d−2+xkd+3∗10d−3+....+x(k+1)d
10d−2
(10) The fitness value of each chromosome is computed using following equation:
Fi = 1
Ei
= q 1
Pj=N
j=1 Ej N
= q 1
Pj=N
j=1 Tji−Oji N
(11)
whereNis the total number of training data set.Tji
andOjiare the estimated and actual output of input
in-stancejfor chromosomei.
Kumar and Rath Hybrid neural network approach for predicting maintainability of object-oriented software 15 Figure 2 shows the block diagram for Neuro-GA
ap-proach, which represent the steps followed to design the estimation model.
Random population of
‘n’ chromosomes
is generated
Weight set is extracted
Weight for training the network is fed as input
Fitness value is computed using Equation 11
Stopping criterion met ?
Model is used for testing
Yes Min fitness value
chromosome is replaced with Max
fitness value chromosome Two-point cross over is performed
No
Figure 2:Flow chart representing Neuro-GA execution
4.3 Adaptive Neuro Genetic (ANGA) Approach
To overcome the limitations of genetic algorithm such as premature convergence due to local optima and low convergence speed, an attempt has been made towards the improvement of parameters such as cross over prob-ability (Pc) and mutation probability (Pm). In this
pa-per (Pc) and (Pm) values are adaptively decreased to
prevent disruption of any proper solution. (Pc) and
(Pm) values are updated using Equations 12 and 13.
After implementation, it was observed that Adaptive Neuro-GA Approach yields better result in comparison with Neuro-GA.
(Pc)k+1= (Pc)i−
C1∗n
7 (12)
(Pm)k+1= (Pm)i−
C2∗n
7 (13)
where(Pc)k+1and(Pm)k+1are the updated
prob-ability of cross over and mutation,(Pc)iand(Pm)iare
the initial probability of cross over and mutation, C1
and C2 are positive constant and n is the number of chromosomes having same fitness value.
4.4 Neuro Particle Swarm Optimization (NPSO) Ap-proach
Neuro Particle Swarm Optimization is a hybrid ap-proach of neural network and Particle Swarm Optimiza-tion [18]. In this approach, PSO is used for updating
the weight during learning phase. PSO is a popula-tion based search algorithm. In this paper PSO is used as back propagation algorithm to train the network. A neural network with a configuration of ‘l-m-n’ is con-sidered for estimation, i.e., the network consists of ‘l’ number of input neurons, ‘m’ number of hidden neu-rons, and ‘n’ number of output neurons. In this paper, for input layer, linear activation function is used, and for hidden layer and output layer, sigmoidal function or squashed-S function is used. PSO encodes the param-eters of neural networks as particles and the population of particles are referred as swarm. Here, the synaptic weights of the neural network are initialized to as parti-cles and the PSO is applied to obtain the optimized set of synaptic weights. In NPSO, initially particle swarm is generated with random velocity (V) and position (X). Fitness value is calculated using following Equation:
Fi = 1
Ei
= qP1
j=N j=1 Ej
N
(14)
Velocity (V) and position (X) of particles are up-dated using Equations 15 and 16, respectively.
Vki+1=Vki+C1R1(P bestik−Xki)+C2R2(Gbestnk−Xki)
(15)
Xki+1=Xki+Vki+1 (16)
where
• Vi
k+1andX
i
k+1are the updated velocity and
posi-tion.
• Vi
k andXki are the current velocity and position. • PbestandGbestare the local and global best
po-sition respectively.
• C1 and C2 are positive constants, usually they range between one to four.
• R1andR2are two random function whose values lies in between zero to one.
Figure 3 shows the block diagram for NPSO ap-proach, which represents the steps followed to design the estimation model.
4.5 Modified Neuro Particle Swarm Optimization (MNPSO) Approach
Kumar and Rath Hybrid neural network approach for predicting maintainability of object-oriented software 16
Random particle swarms is generated with random position (X) and velocity
(V)
Fitness value is computed using Equation 14
Fitness (X)>
Pbest ?
Pbest is replaced by X
Pbest=Pbest
Fitness (X)>
Gbest ?
Gbest is replaced by X
Gbest=Gbest
Stopping criterion met ?
Model is used for testing Particle velocity is
calculated using Equation 15 Position is updated
using Equation 16
Yes
No
No
Yes
Yes No
Figure 3:Flow chart representing PSO execution
incorporated just before the completion of one gener-ation. In this paper (Pm) value is adaptively decreased
to prevent disruption of very good solution. (Pm) value
is updated using Equation 17.
(Pm)k+1= (Pm)i−
C∗n
10 (17)
where(Pm)k+1is the updated probability of
muta-tion,(Pm)iis the initial probability of mutation, and n
is the generation number.
5 Implementation
In this section, the relationships between value of met-rics and maintainability of the classes are determined. Software metrics are considered as input nodes of neu-ral networks and the output obtained is the computed maintainability of the object-oriented software. Accu-racy of estimation for Maintainability for the model de-signed by using different AI techniques is determined by using performance evaluation parameters such as mean relative error (MRE) [9] and mean absolute rel-ative error (MARE) [9]. Parameters like True error (e)
and estimate of true error (ˆe) are being used for evalu-ating models involving cross validation approach [11].
The following sub-sections give a brief note on im-plementation details of the applied neural network tech-niques.
5.1 Artificial neural network (ANN) model
In this paper, architecture of ANN with three layers, i.e., input layer, hidden layers and output layers is consid-ered, in which nine nodes in QUES and ten nodes in UIMS act as input nodes, the number of hidden nodes vary from nine to twenty and one node acts as an out-put node. Software metrics are considered as inout-put and output is the computed maintainability of the object-oriented software. The network is trained using Gra-dient descent learning method.
Gradient descent learning method is used for updat-ing the weights usupdat-ing Equation 7. True error and es-timate of true error determine the suitable model to be chosen for predicting maintainability. The hidden node with least deviation between true error and the estimate of true error in each fold is chosen as suitable model for estimation. Figure 4 depicts the distribution of the hid-den nodes of the suitable model in each fold for UIMS and QUES case studies. The final model chosen for pre-dicting maintainability is based on the median values of the hidden nodes in their respective folds.
1 2 3 4 5 6 7 8 9 10
10 12 14 16 18 20
Fold No.
Number of Hidden Node
UIMS QUES
Figure 4:Number of hidden nodes in each fold
From Figure 4, the median value for all the 10 folds in QUES and 5 folds in UIMS is found to be ‘12’ and ‘11’ respectively. The median value determines the fi-nal model to be designed based on the number of hid-den nodes. After ihid-dentifying, the suitable model, i.e., model having ‘11’ number of hidden neurons in UIMS and ‘12’ number of hidden neurons in QUES is evalu-ated. Next, the model is trained using gradient descent learning method unless and until the neurons achieve the threshold value of ‘MSE’ or reach stopping crite-rion of 1,000 epochs. Table 4 shows the various perfor-mance parameters for UIMS and QUES software sys-tem respectively. Table 4 reports that the high value of Pearson’s correlation (‘r’) in case of UIMS is found
Kumar and Rath Hybrid neural network approach for predicting maintainability of object-oriented software 17 to be 0.9675, which is an indication that both actual and
estimated maintainability values are strongly dependent in a linear fashion on each other. But in case of QUES, Pearson’s correlation (‘r’) is 0.7382, which is an indica-tion that both actual and estimated maintainability val-ues are not too much linearly dependent. So this model of predicting maintainability does not yield comparably good result for QUES dataset.
Table 4:Performance matrix
r Epochs MAE MARE
UIMS 0.9675 549 0.0997 0.4252
QUES 0.7382 1,000 0.1340 0.4363
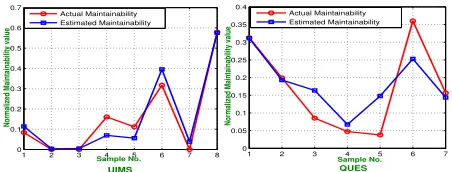
Figure 5 shows the variance of MSE verses number of iterations for UIMS and QUES system respectively. Figure 6 depicts the closeness between the actual and estimated maintainability of UIMS and QUES.
0 100 200 300 400 500 600
0 0.1 0.2 0.3 0.4 0.5
Iteration No.
Mean Square Error
0 200 400 600 800 1000
0 0.05 0.1 0.15 0.2 0.25 0.3 0.35
Iteration No.
Mean Square Error
UIMS QUES
Figure 5:MSE Versus Number of Iterations
1 2 3 4 5 6 7 8 0
0.1 0.2 0.3 0.4 0.5 0.6 0.7
Sample No.
Normalized Maintainability value
1 2 3 4 5 6 7 0
0.05 0.1 0.15 0.2 0.25 0.3 0.35 0.4
Sample No.
Normalized Maintainability value
Actual Maintainability Estimated Maintainability
Actual Maintainability Estimated Maintainability
QUES UIMS
Figure 6:Actual Effort Versus Estimated Maintainability
5.2 Neuro-genetic (Neuro-GA) approach
In this paper, l-m-1 configuration of neural network is considered, i.e.,
• UIMS consists of 10 input nodes, 09-20 vary-ing hidden nodes and one output node. The to-tal number of weights used in 10-m-1 configura-tion model are determined using equaconfigura-tion 8, i.e.,
(10 + 1) ∗m = 11∗m (where ‘m’ represents
the number of hidden nodes varying from nine to twenty)
• QUES consists of 9 input nodes, 9-20 varying hid-den nodes and one output node. The total number of weights used in 9-m-1 configuration model are determined using equation 8, i.e.,(9 + 1)∗m = 10∗m(where ‘m’ represents the number of hidden nodes varying from nine to twenty)
Each weight is considered as a gene of length 5, so the length of one chromosome is calculated using Equation 9, therefore the length of each chromosome is repre-sented as:
L=
(10 + 1)∗m∗5 = 55∗m For UIMS
(9 + 1)∗m∗5 = 50∗m For QUES
(18) In this study a population of size 50 is considered, i.e., initially 50 chromosomes are randomly generated. The input-hidden layer and hidden-output layer weights of the network are computed using Equation 10. In case of NGA, two-point cross-over operation is performed on the generated population, i.e., probability of crossover is constant. If probability of cross over (Pc) and
proba-bility of mutation (Pm) values are considered to be
con-stant, it may so happen that, as the generation progress towards global optima, any solution giving better result may get disrupted and may move to higher fronts by which the approach may take huge amount of time to converge. Due to this reason, Adaptive neuro genetic approach (ANGA) has been considered. In ANGA,Pc
andPmvalues are adaptively decreased to prevent
dis-ruption of solutions with better result. (Pc) and (Pm)
values are updated using Equations 12 and 13. In this paper, initially (Pc) and (Pm) values are chosen as 0.8
and 0.2 respectively. Constant C1 andC2 values are chosen as 0.1 and 0.01 respectively.
The execution of the algorithm terminates when 95% of the chromosomes achieve same fitness values. True error and estimate of true error determine the suit-able model to be chosen for predicting maintainability. The hidden node with least deviation between true error and the estimate of true error in each fold is chosen as suitable model for estimation. Figure 7 depicts the dis-tribution of the hidden nodes of the suitable model in each fold. The final model chosen for predicting main-tainability is based on the median values of the hidden nodes in their respective folds.
Kumar and Rath Hybrid neural network approach for predicting maintainability of object-oriented software 18
1 2 3 4 5
8 9 10 11 12 13 14 15 16 17 18 Fold No.
Number of Hidden Node
1 2 3 4 5 6 7 8 9 10
8 10 12 14 16 18 20 Fold No.
Number of Hidden Node
NGA
ANGA NGA
ANGA
QUES UIMS
Figure 7:Number of Hidden nodes in each fold
hidden nodes. Next, the model is trained using Neuro-GA method unless and until 95% of the chromosomes achieve same fitness values or reach maximum iteration limit (of 200 epochs). Table 5 shows the various per-formance parameters for two products. Table 5 reports that the high value of pearson’s correlation (‘r’) in case of UIMS and QUES, which is an indication that both actual and estimated maintainability are strongly linear dependence on each other. From Table 5, it is evident that ANGA Approach achieved better performance as compared to NGA.
Table 5:Performance matrix
Product r MAE MARE
NGA UIMS 0.9500 0.0832 0.3329
QUES 0.9647 0.1481 0.3380
ANGA UIMS 0.9804 0.1023 0.2442
QUES 0.8696 0.1468 0.3133
Figure 8 shows the variance of number of chromo-somes having same fitness value and generation num-ber of UIMS and QUES. From Figure 8, it is evident that NGA consumes more generation to achieve the threshold value. Figure 9 depicts the closeness between the actual and estimated maintainability of UIMS and QUES.
0 10 20 30 40 50 60 70 80 0 5 10 15 20 25 30 35 40 45 50 Generation No.
No. of Choromosome havine same fitness value
0 20 40 60 80 100 120 0 5 10 15 20 25 30 35 40 45 50 Generation No.
No. of Choromosome havine same fitness value
NGA ANGA NGA ANGA QUES UIMS
Figure 8: Number of chromosomes containing same fitness value Versus Iteration Number
1 2 3 4 5 6 7 0 0.2 0.4 0.6 0.8 1 Sample No.
Normalized Maintainability value
1 2 3 4 5 6 7 0 0.2 0.4 0.6 0.8 1 Sample No.
Normalized Maintainability value
1 2 3 4 5 6 7 8 0 0.2 0.4 0.6 0.8 Sample No.
Normalized Maintainability value 01 2 3 4 5 6 7
0.2 0.4 0.6 0.8
Sample No.
Normalized Maintainability value
Actual Maintainability Estimated Maintainability
Actual Maintainability Estimated Maintainability
Actual Maintainability
Estimated Maintainability Actual Maintainability Estimated Maintainability
UIMS (ANGA)
QUES (ANGA)
UIMS (NGA) QUES (NGA)
Figure 9:Actual Effort Versus Estimated Maintainability
5.3 Neuro Particle Swarm Optimization (NPSO) Ap-proach
In this approach a population of size 50 is considered, i.e., initially a swarm of 50 particles are generated with random position and velocity. After each generation, velocity and position of particles are updated using Equations 15 and 16 respectively. In MNPSO, the ini-tial probability of mutation (Pm) is considered as 0.2,
its constant value is taken as 0.01. They are updated using Equation 17. The randomly generated particles undergo mutation. The training process is same as that of NPSO, but a mutation phase is incorporated just be-fore the completion of one generation. The execution of the algorithm continues until 100 generation.
we chose True error and estimate of true error to de-termine the suitable for predicting maintainability. The hidden node with least deviation between true error and the estimate of true error in each fold is chosen as suit-able model for estimation. Figure 10 depicts the dis-tribution of the hidden nodes of the suitable model in each fold. The final model chosen for predicting main-tainability is based on the median values of the hidden nodes in their respective folds.
1 2 3 4 5
12 13 14 15 16 17 18 19 20 Fold No.
Number of Hidden Node
1 2 3 4 5 6 7 8 9 10
11 12 13 14 15 16 17 18 19 20 Fold No.
Number of Hidden Node
NPSO MNPSO
NPSO MNPSO
UIMS QUES
Figure 10:Number of Hidden nodes in each fold
From Figure 10, the median value for all the 10 folds in QUES is found to be ‘15’ in case NPSO and MNPSO. The median value for all the 5 folds in UIMS is found to be ‘14’ in case of NPSO and ‘13’ in case of MNPSO. Median values determine the final model to be designed based on the number of hidden nodes. Af-ter identifying, the suitable model, the model is trained
Kumar and Rath Hybrid neural network approach for predicting maintainability of object-oriented software 19 using NPSO and MNPSO approaches up to 100
genera-tion. Table 6 shows the various performance parameters for two products. Table 6 reports that from the higher value of Pearson’s correlation (‘r’) in case of UIMS and QUES, here is an indication that both actual and esti-mated maintainability are strongly linear dependence on each other. From Table 6, it is evident that MNPSO Approach achieves better performance as comparde to NPSO Approach.
Table 6:Performance matrix
Product r MAE MARE
NPSO UIMS 0.9850 0.1030 0.3321
QUES 0.8618 0.1490 0.4189
MNPSO UIMS 0.9805 0.0790 0.2416
QUES 0.9832 0.1320 0.3089
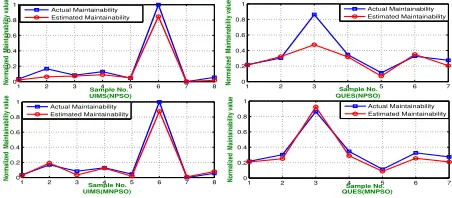
Figure 11 shows the variance of global fitness value and generation number for UIMS and QUES. From Fig-ure 11, the global fitness value using MNPSO is bet-ter then that obtained using NPSO approach. Figure 12 depicts the closeness between the actual and estimated maintainability of UIMS and QUES case studies.
0 20 40 60 80 100 0
50 100 150 200 250 300 350 400
Generation No.
Fitnes Value
0 20 40 60 80 100 0
10 20 30 40 50 60 70
Generation No.
Fitnes Value
NPSO MNPSO
NPSO MNPSO
QUES UIMS
Figure 11:Fitness value Versus Generation Number
1 2 3 4 5 6 7 8 0
0.2 0.4 0.6 0.8 1
Sample No.
Normalized Maintainability value
1 2 3 4 5 6 7 0
0.2 0.4 0.6 0.8 1
Sample No.
Normalized Maintainability value
1 2 3 4 5 6 7 0
0.2 0.4 0.6 0.8 1
Sample No.
Normalized Maintainability value
Actual Maintainability Estimated Maintainability
1 2 3 4 5 6 7 8 0
0.2 0.4 0.6 0.8 1
Sample No.
Normalized Maintainability value
Actual Maintainability Estimated Maintainability
Actual Maintainability Estimated Maintainability
Actual Maintainability Estimated Maintainability
UIMS(NPSO) QUES(NPSO)
QUES(MNPSO) UIMS(MNPSO)
Figure 12:Actual Effort Versus Estimated Maintainability
6 Comparison of models
Figures 13 shows theP earson0sresidual boxplots for a model using the normalized values of UIMS and QUES data set, allowing a visual comparison.
ANN NGA ANGA PSO MPSO
−0.6 −0.4 −0.2 0 0.2
Pearson’s Residual
ANN NGA ANGA PSO MPSO
−0.8 −0.6 −0.4 −0.2 0 0.2 0.4 0.6
Pearson’s Residual
UIMS
QUES
Figure 13:Residual boxplot for UIMS and QUES
The line in the middle of each box represents the median of theP earson0sresidual. In case of UIMS, all the approaches have a median residual value close to zero, but in case of QUES data set except ANN approach, all other approaches have a median resid-ual close to zero. Of all the approaches considered, MNPSO approach has the narrowest box, small sized whiskers, and few number of outliers. Based on these boxplots, it is evident that the model designed by using MNPSO approach obtained the best estimation accu-racy as compared to other approaches.
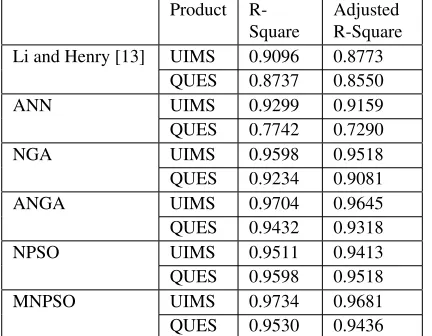
This paper also presents an comparative analysis of the proposed work with the work done by Li and Henry [13]. In their analysis, Li and Henry [13] have used only two performance parameters such as R-Square and Ad-justed R-Square to compare the designed models. In this study also R-Square and Adjusted R-Square have been used for comparison. Table 7 shows the compar-ative results of the proposed work with that of related work [13] based on R-Square and Adjusted R-Square values. R-Square measures the percentage of the vari-ance in the dependent variable accounting for indepen-dent variables in the regression model based on the sam-ple data. Adjusted R-Square measures the percentage of the variance in the dependent variable accounting for independent variables in the regression model based on the population.
Table 7 reports that, when compared with the perfor-mance parameters values for ‘R-Square’ and Adjusted R- Square for the two software products namely UIMS and QUES with respect to the work of Li and Henry [13], the proposed Modified Neuro-PSO (hybrid ap-proach of neural network and PSO) obtained better pre-diction rate of maintainability.
Kumar and Rath Hybrid neural network approach for predicting maintainability of object-oriented software 20 Table 7:Performance based on R-Square and Adjusted R-Square for
UIMS and QUES
Product
R-Square
Adjusted R-Square
Li and Henry [13] UIMS 0.9096 0.8773
QUES 0.8737 0.8550
ANN UIMS 0.9299 0.9159
QUES 0.7742 0.7290
NGA UIMS 0.9598 0.9518
QUES 0.9234 0.9081
ANGA UIMS 0.9704 0.9645
QUES 0.9432 0.9318
NPSO UIMS 0.9511 0.9413
QUES 0.9598 0.9518
MNPSO UIMS 0.9734 0.9681
QUES 0.9530 0.9436
predicting maintainability. Other techniques such as Neuro-Genetic (hybrid approach of neural network and genetic algorithm) and Neuro-PSO (hybrid approach of neural network and Particle Swarm Optimization) have not yet been applied for predicting maintainability [16]. Yuming Zhou et al. [19] and Van Koten et al. [17] have used same UIMS and QUES software system for predicting maintainability based on different regression and simple neural network models. They have consid-ered ‘MMRE’ as a performance parameter to compare the models designed for predicting maintainability of object-oriented software systems. Table 8 shows the MMRE value of the proposed work and the work done by Yuming Zhouet al. [19] and Van Kotenet al. [17].
Table 8 reports that, in case of QUES software MMRE value obtained is almost same but in case of UIMS software, the proposed approach obtained better prediction rate for maintainability.
7 Threat to Validity
Several issues affect the results of the experiment are:
• Two object-oriented systems, i.e., UIMS and QUES used in this study are design in ADA lan-guage. The models design in this study are likely to be valid for other object-oriented programing language such as Java or C++. further research can extend to design a model for other develop-ment paradigms.
• In this study, only eleven set of software metrics are used to design a models. Some of the metrics which are widely used for object-oriented software are further considered for predicting maintainabil-ity.
Table 8:Performance based on MMRE for UIMS and QUES
MMRE
Author Technique UIMS QUES
Van Koten
et al. [17]
Backward Elimination 2.586 0.403
Bayesian Network 0.972 0.452
Regression Tree 1.538 0.493
Stepwise Selection 2.473 0.392
Zhouet al. [19]
Artificial neural network 1.95 0.59
MARS 1.86 0.32
Multivariate linear re-gression
2.70 0.42
Regression tree 4.95 0.58
SVR 1.68 0.43
Proposed Tech-niques
Artificial neural network 0.425 0.436
Neuro-GA 0.332 0.338
Adaptive Neuro-GA 0.244 0.313
Neuro-PSO 0.332 0.418
Modified Neuro-PSO 0.241 0.308
• We only consider AI techniques for designing the prediction models to predict maintainability. Fur-ther, we can extend the work to reduce the feature using feature reduction techniques such as PCA, RST, statistical test, etc..
8 Conclusion
In this paper, we propose a prediction models to predict maintainability of object-oriented software using soft-ware metrics. Gradient descent, Neuro-GA, Adaptive Neuro-GA, Neuro-PSO and Modified Neuro-PSO ap-proaches have been applied to design a model by em-ploying 10-fold cross-validation technique for QUES and 5-fold cross-validation technique for UIMS on varying size of hidden neurons. These techniques have the ability to predict the output based on historical data. The software metrics are used as requisite input data to train the models and estimate the number of changes made in the code during maintenance period. The re-sults reveal that the modified Neuro-PSO prediction ap-proach obtained low values of MAE and MARE, when compared with gradient descent prediction and Neuro-GA model. These low values of performance parame-ters emphasize on qualitative prediction model obtained in the estimation analysis. Also this comparative analy-sis highlights that there exists a strong relation between software metrics and maintainability.
Further, work should be replicated to other system
Kumar and Rath Hybrid neural network approach for predicting maintainability of object-oriented software 21 like open source projects and service oriented system
using different AI techniques in order to analyze which model performs better in achieving higher accuracy for maintainability prediction. Also, work can be extended on the usage of feature reduction techniques such as rough set and principal component analysis to minimize the computational complexity of the input data set.
References
[1] Abreu, F. B. E. and Carapuca, R. Object-Oriented software engineering: Measuring and controlling the development process. In Proceedings of the 4th International Conference on Software Quality, volume 186, 1994.
[2] Bandi, R. K., Vaishnavi, V. K., and Turk, D. E. Predicting maintenance performance using object-oriented design complexity metrics. IEEE Transactions on Software Engineering, 29(1):77– 87, 2003.
[3] Battiti, R. First and second-order methods for learning between steepest descent and newton’s method. Neural Computation, 4(2):141–166, 1992.
[4] Binkley, A. B. and Schach, S. R. Validation of the coupling dependency metric as a predictor of run-time failures and maintenance measures. In
Proceedings of the 20th international conference on Software engineering, pages 452–455. IEEE Computer Society, 1998.
[5] Burgess, C. and M.Lefley. Can genetic program-ming improve software effort estimation. In-formation and Software Technology, 43:863–873, 2001.
[6] Chidamber, S. R. and Kemerer, C. F. Towards a metrics suite for Object-Oriented design, vol-ume 26. ACM, 1991.
[7] Coleman, D., Ash, D., Lowther, B., and Oman, P. Using metrics to evaluate software system main-tainability.IEEE Computer, 27(8):44–49, 1994.
[8] Coleman, D., Lowther, B., and Oman, P. The ap-plication of software maintainability models in in-dustrial software systems.Journal of Systems and Software, 29(1):3–16, 1995.
[9] Hyndman, R. J. and Koehler, A. B. Another look at measures of forecast accuracy. International Journal of Forecasting, 22(4):679–688, 2006.
[10] Jain, Y. K. and Bhandare, S. K. Min max nor-malization based data perturbation method for pri-vacy protection. International Journal of Com-puter and Communication Technology, 2(8):45– 50, 2011.
[11] Kim and Ji-Hyun. Estimating classification error rate: Repeated cross-validation, repeated hold-out and bootstrap.Computational Statistics and Data Analysis, 53(11):3735–3745, 2009.
[12] Kohavi, R. A study of cross-validation and boot-strap for accuracy estimation and model selec-tion. In Proceedings of the 14th International Joint Conference on Artificial Intelligence, San Mateo, pages 1137–1143, 1995.
[13] Li, W. and Henry, S. Maintenance metrics for the Object-Oriented paradigm. InProceedings of First International Software Metrics Symposium, pages 52–60, 1993.
[14] McCulloch, W. and Pitts, W. A logical calculus of ideas immanent in nervous activity. Bulletin of Mathematical Biophysics, 5(4):115–133, 1943.
[15] Oman, P. and Hagemeister, J. Construction and testing of polynomials predicting software main-tainability. Journal of Systems and Software, 24(3):251–266, 1994.
[16] Riaz, M., Mendes, E., and Tempero, E. A system-atic review of software maintainability prediction and metrics. InProceedings of the 2009 3rd Inter-national Symposium on Empirical Software Engi-neering and Measurement, pages 367–377, 2009.
[17] Van Koten, C. and Gray, A. An application of bayesian network for predicting object-oriented software maintainability. Information and Soft-ware Technology, 48(1):59–67, 2006.
[18] Zhou, J., Duan, Z., Li, Y., Deng, J., and Yu, D. Pso-based neural network optimization and its uti-lization in a boring machine. Journal of Systems and Software, 178(1):19–23, 2006.
[19] Zhou, Y. and Leung, H. Predicting object-oriented software maintainability using multivariate adap-tive regression splines. Journal of Systems and Software, 80(8):1349–1361, 2007.
![Table 2: Definition of the metrics used [13]](https://thumb-us.123doks.com/thumbv2/123dok_us/8364200.1672768/3.612.58.525.133.322/table-denition-of-the-metrics-used.webp)
![Table 3: Descriptive statistics of classes for UIMS and QUES [13]](https://thumb-us.123doks.com/thumbv2/123dok_us/8364200.1672768/4.612.103.491.145.280/table-descriptive-statistics-classes-uims-ques.webp)