INTRODUCTION AND WORK OBJECTIVE
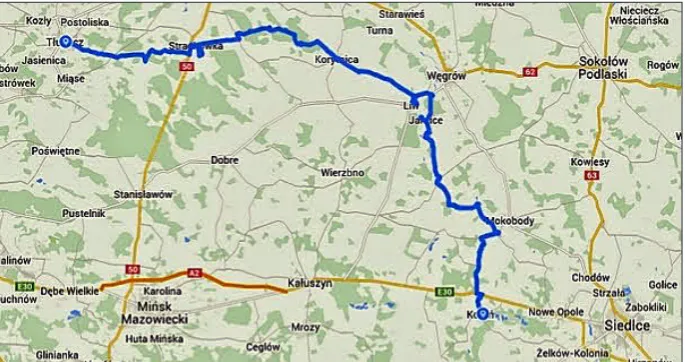
The River Liwiec is a left-bank tributary of the River Bug. With a length of about 126 km, its source is found in the vicinity of Sobicze, Zbuc-zyn Commune (Gmina), Siedlce County ( Powi-at). The river runs through the Siedlecka Upland, Węgrów Basin and Wołomińska Lowland and ter-minates in the vicinity of Kamieńczyk, the Lower Bug Valley [Starczewski et al. 2014]. There are no embankments along the river channel and the Liwiec is barely regulated, apart from the upper reach and several parts of the lower reach [Kot 1995]. As the river runs close to a large urban ag-glomeration, it has become a very attractive place of weekend recreation. Thus, the quality of its water has become of particular importance, be-cause it conditions the river’s social, economic and recreational use.
The quality of surface waters is modified by natural and anthropogenic factors [Bogdał and
Ostrowskia 2007, Grabińska 2011, Kanownik et al. 2013]. The natural factors include geological makeup, soil type, climatic and hydrological con-ditions as well as the processes occurring in the soil environment. In turn, the Anthropogenic fac-tors encompass the type of terrain use and man-agement [Bogdał et al. 2012, Kowalik et al. 2014, 2015]. In the basins, the total area of which in-cludes a marked share of ploughed land, the qual-ity of surface waters is predominantly affected by crop- and fertiliser-related pollutants [Kiryluk and Rauba 2009, Kornaś and Grześkowiak 2011, Szymczyk and Rafałowska 2011]. The waters leaving the basins located in agricultural areas tend to contain the highest concentration of ni-trogen and phosphorus compounds [Ławniczak et al. 2008]. An accumulation of pollutants in the water environment may be also boosted by the wastewater from industrial facilities and urban agglomerations [Mosiej et al. 2007, Lampart-Kałużniacka et al. 2012, Policht-Latawiec et al.
Accepted: 2019.10.10 Available online: 2019.10.30
Volume 20, Issue 10, November 2019, pages 110–117 https://doi.org/10.12911/22998993/113075
Multidimensional Assessment of Variation of Physio-Chemical
Parameters of the Liwiec River Basin Waters
Katarzyna Rymuza
11 Faculty of Natural Sciences, Siedlce University of Natural Sciences and Humanities, ul. Prusa 14, 08-110 Siedlce, Poland
e-mail: [email protected]
ABSTRACT
The objective of the work was to utilise multidimensional statistical methods to assess the physio-chemical status
of waters of the River Liwiec catchment. The water quality assessment and comparison in terms of fifteen param -eters were based on the monitoring data collected at eight measurement points in 2017. The principal component analysis demonstrated that the water quality in the River Liwiec catchment was principally conditioned by water temperature, pH, soluble oxygen content, nitrite nitrogen content and organic carbon content. The cluster analysis
conducted based on principal components yielded three clusters of measurement points. The first cluster included the following measurement points: Liwiec-Kamieńczyk, Liwiec Wólka Proszewska, Liwiec Borzychy and Liwiec Krześlin. The waters at these points contained the least organic carbon and ammonium nitrogen. The second clus
-ter consisted of the Muchawka Żytnia and Muchawka Rakowiec tributaries charac-terised by the highest amount
of phosphorus, Kiejdhal nitrogen, ammonium nitrogen, nitrite nitrogen and organic carbon. The third cluster was
made up of the Kostrzyń Proszew and Kostrzyń Łączka tributaries, both having the lowest values of nearly all the
examined parameters.
2013, 2015]. The pollution poses a threat to the proper functioning of water ecosystems [Jaskuła et al. 2015, Pytka et al. 2013].
The water quality assessment is performed by Voivodeship Inspectorates for Environmental Protection (WIOŚ). The monitoring results con-sist of a large amount of data which is difficult to analyse and interpret unequivocally. As a result, such analyses employ multidimensional statisti-cal methods such as principal component analy-sis, cluster analyanaly-sis, factorial analysis or multidi-mensional comparative analysis [Akin et al. 2011, Boyacioglu et al. 2010, Brahman et al. 2013].
The objective of the work was to (i) use mul-tidimensional statistical methods for assessing the physio-chemical condition of waters of individu-al stretches of the River Liwiec and its tributaries, and (ii) rank the quality of these waters based on the following multidimensional statistical meth-ods of data analysis: principal component, cluster analysis and multidimensional comparative anal-ysis using the zero unitarisation method.
MATERIALS AND METHODS
The analysis of monitoring data collected in the year 2017 was performed, including the following eight measurement points: Liwiec-Kamieńczyk, Liwiec-Krześlin, Liwiec-Wólka Proszewska, Liwiec Borzychy, Muchawka-Ra-kowiec, Muchawka-Żytnia, Kostrzyń-Łączka and Kostrzyń- Proszew.
The following chemical parameters were analysed: X1 – water temperature (°C), X2 − dis-solved oxygen (mg O2/l), X3 – BOD5 (mg O2/l), X4 – total organic carbon content (mg C/l), X5
− conductivity at 20°C (uS/cm), X6 – dissolved substances (mg/l), X7 – overall hardness (mg CaCO3/l), X8 − water pH, X9 – ammonium nitro-gen (mg N-NH4/l), X10 –Kjeldahl nitrogen (mg N/l), X11 – nitrate nitrogen (mg N-NO3/l), X12 – nitrite nitrogen (mg N-NO2/l), X13 – total nitrogen (mg N/l), X14 – phosphate phosphorus content (mg PO4/l), X15 – total phosphorus content (mg P/l).
The initial data analysis consisted in calculat-ing the basic statistical measures: mean, variation coefficient, and maximum and minimum values.
The principal component analysis was used in order to analyse the multidimensional variation of physio-chemical parameters at measurement points. As the examined indicators had different units, the variables were standardised. Selection of the number of components included in further analysis was based on the Kaisler criterion ac-cording to which analysis of the components with eigenvalue greater than 1 is performed. Next, the cluster analysis was applied to group the measurement points located in the River Liwiec basin according to water quality. The grouping was based on the Ward’s method, and employed the Euclidean distance. The Mojena rule was used to determine the dendrogram cut-off point [Mojena 1977].
The measurement points were ranked ac-cording to the physio-chemical quality of waters taking into account all the parameters and based on multidimensional comparative analysis which relies on obtaining, through normalisation, unit-less values of characteristics. As a result, a single (instead of many) synthetic variable is formed, which represents a complex phenomenon.
Normalisation of variables was based on the method of zero unitarisation. The character of the
variables was determined prior to normalisation. The following stimulants were assumed: wa-ter temperature, wawa-ter pH and dissolved oxygen content. The remaining variables were classified as destimulants. The normalisation of stimulants was preformed according to the following formu-la [Kukuła 2000]:
zij=b 1
i− ai(xij− ai) (1) In turn, normalisation of destimulants was carried out using the following formula:
zij=b 1
i− ai(bi− xij) (2)
where: zij − normalised value of the i-th
charac-teristic and j-th river section, i = 1, ...,19, j =1, ...,12,
xij − value of the i-th characteristic and
j-th river section, i = 1, ...,19, j =1, ...,12,
ai − minimum value of the i-th
characteristic,
bi − maximum value of the j-th characteristic.
The obtained values of normalised variables were used to calculate, for each measurement point, the synthetic measure (aggregate evalua-tion) following the formula:
qi=1s ∑ zij s
i=1
, (3)
where s denotes the number of variables enter-ing analysis.
The values of the synthetic measure qq were put in order to rank river stretches and its tributar-ies according to water quality.
All the calculations were performed in STA-TISTICA 12.0 and EXCEL.
ANALYSIS OF RESULTS
Means, minimum and maximum values of water quality parameters for the River Liwiec Ba-sin are shown in Table 1. The lowest variation was found for pH (3.792%) and water temperature (V = 7.85%), it being the highest for ammonium nitrogen (90.25%) and nitrate nitrogen (36.36%). Principal component analysis demonstrated that the water quality in the River Liwiec ba-sin was affected by the characteristic associated with the first three principal components: PC1, PC2 and PC3 (as indicated by their eigenvalues which exceed 1). The components accounted for about 90% of the total (combined) variance of the
Table1. Basic statistics of physio-chemical parameters of the River Liwiec Basin
Parameter mean V min max
value River value River
Water temperature 16.744 7.853 14.950 Muchawka Rakowiec 19.233 Liwiec Kamieńczyk
Dissolved oxygen 7.848 14.709 6.583 Muchawka Żytnia 9.833 Liwiec Kamieńczyk
BOD5 3.123 10.824 2.683 Muchawka Żytnia 3.767 Liwiec Kamieńczyk
Total organic carbon 13.159 10.317 10.958 Liwiec Kamieńczyk 15.700 Muchawka Rakowiec
Conductivity at 20°C 461.563 12.459 360.333 Kostrzyń Łączka 566.500 Liwiec Wólka
Dissolved substances 306.458 12.602 234.333 Kostrzyń Łączka 376.333 Liwiec Wólka Proszewska
Overall hardness 239.958 12.463 190.333 Kostrzyń Łączka 291.333 Liwiec Krześlin
pH 7.440 3.792 6.983 Kostrzyń-Łączka 7.967 Liwiec Kamieńczyk
Ammonium nitrogen 0.137 90.250 0.029 Liwiec Kamieńczyk 0.443 Muchawka Rakowiec
Kjeldahl nitrogen 1.969 15.181 1.610 Kostrzyń Proszew 2.582 Muchawka Rakowiec
Nitrate nitrogen 1.636 41.258 0.620 Kostrzyń-Łączka 2.603 Liwiec Wólka Proszewska
Nitrite nitrogen 0.026 36.360 0.013 Liwiec Kamieńczyk 0.041 Muchawka Rakowiec
Total nitrogen 3.645 21.122 2.427 Kostrzyń Łączka 4.454 Liwiec Kamieńczyk
Phosphate phosphorus (V) 0.069 16.990 0.052 Liwiec Krześlin 0.086 Muchawka Żytnia
multidimensional variation in the water quality parameters (Table 2).
The first principal component was strongly positively associated with the water temperature (0.961), water pH (0.954), dissolved oxygen con-tent (0.899) and nitrite nitrogen concon-tent (0.807), and negatively correlated with organic carbon content (-0.835). The parameters had the greatest share in the multivariate variation in water qual-ity. The values of correlation coefficients indicate that the in river stretches where water contained relatively high amounts of organic carbon, lesser dissolved oxygen, lower temperature and lower pH values were observed. The total and phosphate phosphorus contents, nitrite and Kjeldahl nitro-gen contents as well as dissolved substances were the most strongly associated with the second prin-cipal component, which accounted for about 33% variation. An increase in the amount of both forms of phosphorus was followed by a rise in the nitrite and Kjeldahl nitrogen content and dissolved sub-stances. The third component, predominantly as-sociated with BOD5 (0.910), accounted for over 12% of multivariate water quality in the Liwiec River basin (Table 1). Nachlik [2004] claims that depending on their concentration, the nitrogen compounds in surface waters may stimulate the
development of algae and reduce the dissolved oxygen levels. The concentration of the nitrogen and phosphorus compounds in river water is low in the basins with predominantly sandy soils, and a rich forest cover as well as high in the basins where soils are predominantly compacted and used for intensive agricultural production pur-poses [Melcer and Olejnik 2006]. Some authors stress the fact that a rich forest cover contributes to the reduced infiltration of pollutants from sur-face sources to the water. In such basins, a decline in the concentration of these compounds in the river waters along the river course is observed because of the process called self-purification of waters [Górecki and Olejnik 2005].
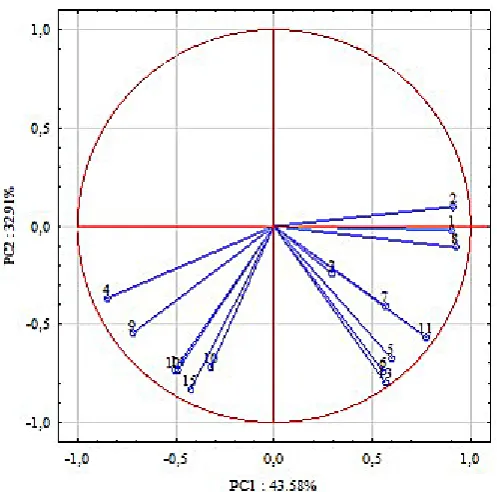
The location of characteristics in the system of the first two principal components indicates that there was a strong positive association of the organic carbon content with the ammonium nitrogen content, as well as the total nitrogen con-tent and dissolved substances with conductivity. Moreover, at the measurement points where the organic nitrogen content was higher, a lower dis-solved oxygen content was found (Fig. 1).
The cluster analysis yielded three clusters of measurement points in the River Liwiec basin which had different physio-chemical
Table 2. Eigenvalues and correlation coefficients between water quality parameters and three
principal components
Parameter PC1 PC2 PC3
Water temperature 0.961 0.096 0.089
Dissolved oxygen 0.899 0.170 0.351
BOD5 0.337 -0.147 0.910
Total organic carbon -0.835 -0.447 -0.056
Conductivity at 20°C 0.648 -0.652 -0.391
Dissolved substances 0.603 -0.722 -0.271
Overall hardness 0.663 -0.640 -0.386
pH 0.954 -0.007 0.152
Ammonium nitrogen -0.683 -0.576 0.360
Kjeldahl nitrogen -0.266 -0.711 0.485
Nitrate nitrogen 0.807 -0.519 -0.003
Nitrite nitrogen -0.442 -0.788 -0.209
Total nitrogen 0.618 -0.747 0.167
Phosphate phosphorus (V) -0.440 -0.839 -0.155
Total phosphorus -0.353 -0.850 0.323
Eigenvalue 7.86 5.60 1.97
Cumulated variance 46.26 79.25 90.82
1 – water temperature (°C), 2 − dissolved oxygen (mg O2/l), 3 – BOD5 (mg O2/l), 4 – total organic carbon (mg C/l), 5 – conductivity at 20°C (uS/cm), 6 – dissolved substances (mg/l), 7 – overall hardness (mg CaCO3/l), 8 − water pH,
9 – ammonium nitrogen (mg N-NH4/l), 10 – Kjeldahl nitrogen (mg N/l), 11 – nitrate nitrogen (mg N-NO3/l), 12 – nitrite nitrogen (mg N-NO2/l), 13 – total nitrogen (mg N/l), 14 – phosphate phosphorus (mg PO4/l),
parameters of water (Fig. 3). The first cluster included four measurement points: Liwiec-Kamieńczyk, Liwiec Wólka Proszewska, Li-wiec Borzychy and LiLi-wiec Krześlin. The sec-ond cluster consisted of the Muchawka Żytnia and Muchawka Rakowiec tributaries, and the third one was made up of Kostrzyń Proszew and Kostrzyń Łączka (Fig. 2).
The waters of the measurement points form-ing group 1 had the highest mean values of most physio-chemical parameters, that is: water tem-perature, dissolved oxygen content, BOD5, con-ductivity, dissolved substances, overall hardness and nitrate nitrogen content. Group 1 had the low-est values of organic carbon content and ammoni-um nitrogen content. The waters in group 3 (tribu-tary of the River Kostrzyń) had the lowest values of almost all the parameters excluding dissolved oxygen content, ammonium and nitrite nitrogen contents, and phosphate phosphorus content. The tributary of the River Liwiec − Muchawka − con-tained the highest amount of phosphorus, Kjel-dahl nitrogen, ammonium and nitrite nitrogen, and organic carbon (Table 2).
Table 4 presents the measurement points ranked according to water quality. The values of the synthetic variable indicate that water at the Kostrzyń Proszew and Kostrzyń Łączka measurement points was of the best quality, as it had the lowest values of dissolved substanc-es, overall hardness, most of the nitrogen forms
and total phosphorus. The worst parameters were found for the waters of the Muchawka-Żytnia and Muchawka-Rakowiec rivers, as they had the highest amounts of e.g.: organic carbon, phosphorus and all the nitrogen forms. The research by Grabińska [2011] as well as Szymczyk and Rafałowska [2011] demonstrat-ed that the main sources of surface water pollu-tion with nitrogen and phosphorus compounds include the run-off of the pollutants from cul-tivated land and wastewater. High fertilisation levels may also contribute to the leaching and transfer of these compounds into surface waters [Kiryluk and Rauba 2011].
CONCLUSIONS
1. Principal component analysis demonstrated that the waters of the River Liwiec at the ana-lysed points were the most affected by char-acteristics associated with the first principal component PC1 (water temperature, water pH, dissolved oxygen content, nitrite nitrogen con-tent and organic carbon concon-tent).
2. The values of correlation coefficients indicate that in the river stretches where water con-tained relatively high amounts of organic car-bon, lesser dissolved oxygen, lower tempera-ture and lower pH values were observed.
Fig. 2. Location of physio-chemical parameters of the River Liwiec waters in the space
3. On the basis of the cluster analysis, the mea-surement points in the River Liwiec were di-vided into 3 groups basin which had different physio-chemical parameters. The first cluster
included four measurement points: Liwiec-Kamieńczyk, Liwiec Wólka Proszewska, Li-wiec Borzychy and LiLi-wiec Krześlin. The sec-ond cluster consisted of the Muchawka Żytnia
Table 3. Mean values of characteristics obtained by means of cluster analysis
Parameter Group 1 Group 2 Group 3
Water temperature 17.65 15.84 15.83
Dissolved oxygen 8.83 6.67 7.06
BOD5 3.21 3.10 2.97
Total organic carbon 12.19 14.76 13.50
Conductivity at 20°C 499.42 465.50 381.92
Dissolved substances 330.46 313.42 251.50
Overall hardness 262.21 234.92 200.50
pH 7.65 7.25 7.21
Ammonium nitrogen 0.06 0.29 0.13
Kjeldahl nitrogen 1.89 2.40 1.70
Nitrate nitrogen 2.21 1.36 0.77
Nitrite nitrogen 0.02 0.04 0.02
Total nitrogen 4.15 3.80 2.49
Phosphate phosphorus (V) 0.06 0.08 0.06
Total phosphorus 0.16 0.20 0.14
Table 4. River Liwiec basin waters ranked based on multidimensional comparative analysis
Measurement point Value of synthetic variable Rank
Kostrzyń-Proszew 10.90 1
Kostrzyń-Łączka 9.92 2
Liwiec-Kamieńczyk 9.67 2
Liwiec-Krześlin 8.48 4
Liwiec-Borzychy 8.41 5
Liwiec-Wólka Proszewska 6.54 6
Muchawka Żytnia 6.09 7
Muchawka-Rakowiec 2.69 8
and Muchawka Rakowiec tributaries, while the third one was made up of Kostrzyń Proszew and Kostrzyń Łączka
4. The waters of the measurement points form-ing group 1 had the highest mean values of most physio-chemical parameters. The waters in group 3 (tributary of the River Kostrzyń) had the lowest values of almost all the param-eters excluding the dissolved oxygen content, ammonium and nitrite nitrogen contents, and phosphate phosphorus content.
5. The values of the synthetic variable indi-cate that the water at the measurement point Kostrzyń Proszew and Kostrzyń Łączka was of the best quality, as it had the lowest values of dissolved substances. The worst parameters were found for the waters of the Muchawka-Żytnia and Muchawka-Rakowiec rivers, as they had the highest amounts of e.g.: organic carbon, phosphorus and all the nitrogen forms.
REFERENCES
1. Akin B.S., Atici T., Katircioglu H. Keskin F., 2011. Investigation of water quality on Gökçekaya dam lake using multivariate statistical analysis, in
Eskişehir. Environmental Earth Sciences, 63(6),
1251–1261.
2. Bogdał A., Kowalik T., Kanownik W., Ostrowski K., Wiśnios M., 2012. Ocena stanu fizykochemicz-nego wód opadowych i odpływających ze zlewni
potoku Wolninka. Gaz, Woda i Technika Sanitarna, 8, 362–365.
3. Bogdał A., Ostrowski K., 2007. Wpływ rolniczego użytkowania zlewni podgórskiej i opadów atmos
-ferycznych na jakość wód odpływających z jej ob
-szaru. Woda-Środowisko-Obszary Wiejskie, 7(20),
59–69.
4. Boyacioglu H., Boyacioglu H., 2010. Detection of seasonal variations in surface water quality using discriminant analysis. Environmental monitoring and assessment, 162(1–4), 15–20.
5. Brahman, K. D., Kazi, T. G., Afridi, H. I., Naseem, S., Arain, S. S., Wadhwa, S. K., Shah, F., 2013.
Si-multaneously evaluate the toxic levels of fluoride
and arsenic species in underground water of Thar-parkar and possible contaminant sources. A mul-tivariate study. Ecotoxicology and Environmental Safety, 89, 95–107.
6. Górecki K., Olejnik M., 2005. Changes in levels
of nitrogen compounds in water of Warta river on
Oborniki-Skwierzyna stretch. Acta Sci. Pol., Form.
Circ. 4(2), 21–30.
7. Grabińska B. 2011. Changes in the quality of the
river water on the background of the diversity of natural conditions and usage basin. The resources conservation and water quality in rural landscape.
Współczesne Problemy Kształtowania i Ochrony Środowiska. Olsztyn. UWM, 223–253.
8. Jaskuła J., Sojka M., Wicher-Dysarz, J., 2015. Anal
-iza tendencji zmian stanu fizykochemicznego wód rzeki głównej. Inżynieria Ekologiczna, 44, 154–161.
9. Kanownik W., Kowalik T., Bogdał A., Ostrowski
K., 2013. Quality categories of stream water
includ-ed in a Small Retention Program. Pol. J. Environ.
Stud., 22(1), 159–165.
10. Kiryluk A., Rauba M. 2011. Impact of agriculture on the concentration of total phosphorus in the surface
water catchment area Ślina. Inżynieria Ekologiczna,
26, 122–132.
11. Kornaś M., Grześkowiak A., 2011. Wpływ użytkowania zlewni na kształtowanie jakości
wody w zbiornikach wodnych zlewni rzeki Drawa [The impact of land use on water quality in water-reservoirs of the Drawa River catchment].
Woda-Środowisko-Obszary Wiejskie, 11, 1(33), 125–137.
12. Kot H. (red.), 1995. Przyroda województwa siedleckiego, Zakład Badań Ekologicznych ‚Ekos’, Siedlce, 141−155.
13. Kukuła K., 2000. Metoda unitaryzacji zerowanej, PWN Warszawa.
14. Lampart-Kałużniacka M., Wojcieszonek A., Pikuła K., 2012. Ocena stanu ekologicznego wód rzeki Regi na odcinku w obszarze miasta Gryfice. An
-nual Set The Environment Protection, 14, 437–446.
15. Ławniczak A. E., Zbierska J., Kupiec J., 2008.
Changes of nutrient concentrations in water sensi-tive to nitrate pollution from agricultural sources in
the Samica Stęszewska river catchment. Annals of
Warsaw University of Life Sciences Land Reclama-tion, 40, 15–25.
16. Mecler B., Olejnik M., 2006. Wpływ wybranych czynników na zanieczyszczenie związkami biogen
-nymi powierzchniowych wód płynąch w zlewni Baryczy. Acta Sci. Pol., Form. Circum., 5(2), 59–71.
17. Mojena, R., 1977. Hierarchical grouping methods and stopping rule: an evaluation. The Computer
Journal., 20, 359−363.
18. Mosiej J., Komorowski H., Karczmarczyk A., Suska
A., 2007. Wpływ zanieczyszczeń odprowadzanych z aglomeracji łódzkiej na jakość wody w rzekach
Ner i Warta. Acta Sci. Pol., Formatio Circumiectus,
6(2), 19–30.
19. Nachlik E., 2004. Identyfikacja i ocena antropogenic
-znych oddziaływań na wody i ich skutków wraz ze ws
20. Policht-Latawiec A., Kanownik W., Łukasik D., 2013. Wpływ zanieczyszczeń punktowych na jakość wody rzeki San. Infrastruktura i Ekologia Terenów Wiejskich, 4 (1), 253–269.
21. Policht-Latawiec, A., Żarnowiec W., Majew
-ska M., 2015. Analiza zmienności parametrów jakościowych wody w rzece Biała Tarnowska. Inżynieria Ekologiczna, 44, 217−246.
22. Pytka, A., Jóźwiakowsk, K., Marzec, M., Gizińska, M., Sosnowska, B., 2013. Ocena wpływu zanieczyszczeń antropogenicznych na jakość wód
rzeki Bochotniczanki. Infrastruktura i Ekologia
Terenów Wiejskich, 3, 15–29.
23. Starczewski K., Rymuza K., Affek-Starczewska A., Pawlonka Z., Bombik A., 2014. Konkurencyjność i atrakcyjność turystyczna gmin województwa mazowieckiego położonych nad rzeką Liwiec. Acta
Universitatis Lodzensis Folia Oeconomica, 6(308) 55–77.
24. Szymczyk S., Rafałowska M., 2011. The influence
of the intensity of the agricultural production and the land reclamation drainage on the quality of the sur-face water and groundwater. In: The resources con-servation and water quality in the rural landscape.