A Study of Highways Performance with a Molp-Dea
Model and an Interactive Tri-Criteria Linear Programming
Package (Trimap)
João Carlos Namorado Clímacoa
a Faculdade de Economia da Universidade de Coimbra & INESC-Coimbra,
Coimbra, Portugal
João Carlos Correia Baptista Soares de Mellob b Universidade Federal Fluminense, Niterói, Brazil
Lidia Angulo Mezac
c Universidade Federal Fluminense, Volta Redonda, Brazil
Abstract
This paper deals with the evaluation of a few Brazilian privatised highways. We use Data Envelopment Analysis (DEA) for that. As the number of highways is too small, we need to use an additional method to avoid ties in the evaluation index. The MCDEA model of Li and Reeves (a tri-objective model) is adequate to solve this problem. The authors suggest the extension of the CCR model, considering two extra objective functions, i.e. a min-max function, corresponding to a measure of equity and a min-sum function, favouring some sort of overall evaluation of the DMUs, from the point of view of the DMU under analysis. The graphic decomposition of the weighting space (used in TRIMAP as an operational tool), the possibility of introducing constraints on the objective function values during the search automatically translated into the weighting space make it specially adequate to explore the MCDEA model. Keywords: Multi-Objective, Data Envelopment Analysis, Road Transport,
Highways, MCDEA, TRIMAP.
Introduction
For a number of years, several researchers have remarked that Multi Criteria Decision Aid – MCDA, including MOLP (Multi Objective Linear Programming) one of itsbranches,and Data Envelopment Analysis – DEA contain common points. Thus, many works have taken advantage of these similarities. The idea of using MCLP in a DEA context grew up from the Pareto efficiency concept that both approaches share. Some articles such as Joro et al. (1998), Li and Reeves (1999), Lins et al. (2004), Quariguasi-Frota-Neto and Angulo-Meza (2007) use simultaneously both DEA and MOLP. A revision of models that use the common characteristics of DEA and MOLP is described in Clímaco et al. (2008).
The model for the evaluation of the highways is based on a combination of the Li and Reeves’s (1999) MCDEA model with Clímaco and Antunes (1989) TRIMAP. The MCDEA uses three objective functions thus allowing, among other, to evaluate how far one has compromised between the values of the two additional objective and the optimisation of the DEA-CCR (Charnes, et al., 1978) model. The authors contend that the model solves two common drawbacks in DEA: the large number of efficient DMUs and zero multipliers. However, Li and Reeves’s work barely exploits the potentialities of the proposed model, largely because of the computational tools that were used. As the model has three objective functions, the TRIMAP package is adequate for a fuller analysis.
MOLP and DEA share several concepts. To avoid confusions, the word “weights” shall be used here for the objective functions weighing coefficients in the multi-objective problem. We shall refer to the input and output coefficients as “multipliers”. Likewise, “efficient” will be always used only in its DEA context and Pareto’s optimal solutions will be referred to as “non-dominated” in MOLP problems.
Li and Reeves’s model will be reviewed in the next section. Next, the TRIMAP relevant points for this paper will be briefly discussed. Section 4 shows how TRIMAP can be used with the MCDEA model. In section 5, we use the model developed in the previous sections to evaluate the highways. Conclusions will be presented at the end of this paper.
The Li And Reeves’s Model
Researchers Xiao-Bai Li and Gary R. Reeves (1999) have presented a multi-objective model aiming at solving two common problems in DEA: to increase and improve the degree of DMU discrimination and bring about a better distribution of the multipliers for the variables. The first problem occurs when the number of DMUs is insufficient in relation to the number of inputs and outputs because standard models class too many DMUs as efficient. The second problem arises when a given DMU is efficient with non-zero multipliers for just a few variables, benefiting those in which the DMU presents a good performance and ignoring those in which the DMU has a weak performance. These two problems are closely related.
classical DEA objective function. Two other efficiency measures are introduced and optimised by another two additional objective functions. The constraints imposed to all these three functions are the same as in the CCR multipliers model Charnes et al. (1978). The two additional objective functions reduce the freedom to choose the multipliers.
In DEA, a given DMU is efficient whenever for DMU 0, h0 = 1 in (1), meaning that the constraint for that DMU is active and, thus, its slack is nought. The basic idea is to take this slack as an efficiency measure instead of h. The slack symbol is d. So, the CCR model in (1) can be reformulated as (2):
(1)
(2)
In which vi and ur are respectively the inputsi, i 1,...,m= , and outputs r, r 1,...,s= , multipliers; xij e yrj are the inputsi and outputs r of DMU j, j=1,...,n; xio and yro are the inputsi and outputs r of DMU 0. Besides these, d0 is the deviation
variable for DMU 0 and dj is the deviation variable for the DMU of order j, i.e., it measures the efficiency deviation of the DMU. In this model, DMU 0 is efficient if, and only if, d0 = 0, or h0= 1. If DMU 0 is not efficient its efficiency score is h0 = 1 – d0. So, the lesser is d0 , the more efficient is a DMU. As d0 Î [0, 1[ it can be taken as a measure of “inefficiency” meaning the lesser is the value of d0, the lesser is the “inefficiency, i.e., the more efficient is DMU0. It should be emphasised that, according to the Li and Reeves’s model the only deviation between 0 and 1 is that of the DMU
0
0
s
0 r rj
r 1
m i ij i 1
s m
r rj i ij
r 1 i 1
r i
Max h u y sujeito a
v x 1
u y v x 0, j = 1,.., n u ,v 0, r,i
= = = = = = − ≤ ≥ ∀
∑
∑
∑
∑
0 0 s0 0 r rj
r 1
m i ij i 1
s m
r rj i ij j
r 1 i 1
r i j
Min d ou Max h u y sujeito a:
v x 1
u y v x d 0, j=1,..,n u , v , d 0, r, i
under analysis. The deviations of the other DMUs can be greater than 1.
It can be said, then, that this formulation of the classical DEA method minimizes the DMU inefficiency, as measured by d0, with the constraint that the weighted sum of the outputs must be less or equal to the weighted sum of the inputs for each DMU. To increase the selectivity in the choice of multipliers, the MCDEA model includes two further objective functions: a “minisum” objective, i. e., the minimization of the sum of deviations, and a “minimax”, i.e., the minimization of the maximal deviation.
Thus, the multi-objective programming problem, Multiple Criteria Data Envelopment Analysis – MCDEA becomes (3):
(3)
The first objective function is the common one of efficiency maximization; the second is the “minisum” that optimises the overall evaluation of all DMUs, from the point of view of the DMU under analysis. It should be emphasised that this is an evaluation principle related to the benevolent cross evaluation established by Doyle and Green (1994). The third objective function is minimax, which is a measure of equity.
The relative efficiency of a given DMU can be defined in relation to the second and third objectives: DMU 0 is minisum efficient if, and only if, the d0 value corresponding to the solution that minimises the model’s second objective is nought; similarly, DMU 0 is minimax efficient if, and only if, the d0 value corresponding to the solution that minimises the model (3) third objective is nought.
Generally, minimax and minisum objetives do not bring any benefit to the classical DMU efficiency (as opposed to the classical DEA objective). Therefore, they tend to constrain the multipliers that refer to the classical efficiency (if DMU
0 is minimax, or minisum, efficient, it should be DEA efficient as well because by definition both the minimax or minisum efficiencies require d0 = 0. However, if DMU
0 is DEA efficient it can be, or not, minimax or minisum efficient as d0 = 0 does not necessarily imply that M and/or
be minima). 0 0 n j j 1 j m i ij i 1 s m
r rj i ij j
r 1 i 1
r i
Min d Min d Min Max d sujeito a:
v x 1
u y v x d 0, j=1,...,n u , v 0, r,i,j
= = = = = − + = ≥ ∀
∑
∑
∑
∑
n j j 1=dNonetheless, in some particular cases, the minimax objective can restrain but little the multipliers combination that optimises the classical objective function. This tends to occur whenever the worst evaluated DMU has similar strong and weak points to the DMU being evaluated, i.e., they have a similar distribution of multipliers.
In their original work, the authors have used only the weighted sum as a solution method and have made comments on the behaviour of one of the functions when the other is optimised. They have used the ADBASE software and have alleged there are no adequate computational tools, whether in content or ease of use, to study the model.
As this model operates with three objective functions, there is indeed an adequate analysis tool, TRIMAP, which will be summarised herebelow.
TRIMAP
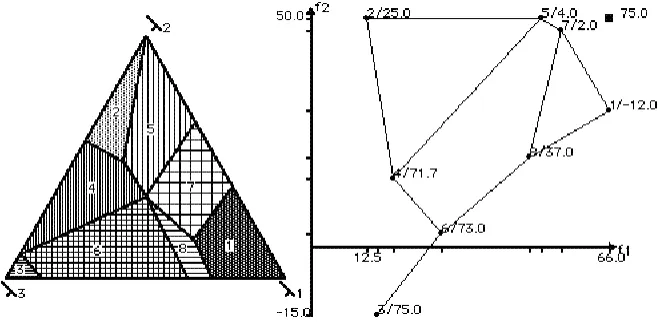
TRIMAP, developed by Clímaco and Antunes (1987; Clímaco and Antunes, 1989), is a free search interactive environment that purports to offer to the decision maker a progressive and selective learning of the non-dominated solutions set in tri-criteria linear programming problems. TRIMAP combines the reduction of the feasible polyhedron with the reduction of the weights space. Decision makers can specify their preferences by means of establishing bounds for the values of the objective functions (that are automatically carried to the weights space) and the direct imposition of constraints in the weights space. Using Roy’s (1987) terminology, in TRIMAP “convergence” (for any utility function) should be replaced by “creation” so the interactive process becomes constructive and not just the discovery of something existing previously. It should be emphasised that, although this is the subjacent philosophy of TRIMAP, in this paper it will be used mostly as a generator of solutions and weights space analysis tool taking advantage of its graphical representation. Although the restriction of working with no more than three objective functions is a limitation, the graphic representations it produces are very useful. The usage of graphics in TRIMAP is exemplified in Fig. 1. For the purposes of this article, the most important is the graphic of the weights space, namely through the representation of indifference regions (those within which the objective functions can change without changing the solution) that correspond to the basic non-dominated solutions so far obtained. As exemplified by the right-hand side picture TRIMAP also offers a bi-dimensional projection of the objective functions space. In it all non-dominated solutions calculated so far are shown and it is even possible to identify all the non-dominated faces and edges fully identified up to the moment.
Beyond graphs, TRIMAP supplies a text condensing all the numeric results obtained so far. Among other, the following values can be obtained: basic variables, objective functions and percentage of the area occupied by the indifference region within the weights space for each of the non-dominated basic solution so far calculated.
are well contrasted in relation to the values of the objective functions. This aims at having a first evaluation of the range of variation of their values within the non-dominated region of convex polyhedron. This being done, one starts calculating only the basic non-dominated solutions that optimise each of the objective functions and, eventually, those that minimise a weighted Chebychev distance to the ideal solution. The user can then proceed with the calculation of other non-dominated basic solutions. This is done by optimising a mono-objective problem meaning the optimisation of a weighted sum of the three objective functions of the initial problem.
Figure 1 - Graphs produced by TRIMAP, decomposition of the weights space and projection of the objective function.
Finally, note that by means of an interface similar to the “Pareto Race” method, non-dominated faces can also be searched between two of its points previously calculated. The programme shows a line that goes either forward or back over the face projection at a speed controlled by the user. The values of the objective functions corresponding to the points that have been followed are dynamically presented in bar graph.
The reader who proposes to study the use of TRIMAP in depth should read Climaco and Antunes (1987); Clímaco and Antunes, (1989) and Clímaco et al. (2003).
Li and Reeves’s Model in Trimap
sets of multipliers, and which of them correspond to a given non-dominated basic solution improves on the quality of the analyses that can be produced.
The stability of the efficient DEA solutions can be evaluated by knowing the decomposition of the weights space. Dimension and shape of indifference regions give indeed a clear indication of weights combinations concerning the three objective functions. Note that these lead to the multipliers that correspond to the basic solution represented by the indifference region being studied. On the other hand, large indifference regions correspond to solutions with low sensitivity to small perturbations on coefficients of the objective functions.
By just looking at it, we can identify whether a DMU is minimax or minisum efficient whenever there is an indifference region that simultaneously contains the triangle corner corresponding to the optimisation of the classical objective function and one of the other two.
The decomposition of the weights space allows for combinations of weights to be taken into account. Although these may not lead to a non-dominated solution to which the maximum DMU efficiency corresponds, they may nonetheless be considered good compromise solutions if they do not reduce the DEA efficiency too much. Better values for the other objective functions are also required for this. Having in mind that TRIMAP supplies for each indifference region, the multiplier values, it is also possible to find a solution with a more adequate distribution of multipliers from the point of view of the decision maker.
Case Study
We use the previous concepts to analyse five privatised federal Brazilian highways. We shall introduce it by using a previous work dealing with the same problem (Gomes, et al., 2004). Some other studies on highways efficiency are found in Cook and Zhu (2005).
In this paper it is justified the need for a follow up study on the performance of privatised companies.
There was a large privatisation programme during the nineties in Brazil. The aim was to decrease the public sector deficit, to create new investment opportunities and to strengthen the stock market.
In the road sector the main cause was the lack of capacity of the public sector to invest in the infrastructure maintenance and improvement in the short term. It was hoped that both an increase in road safety and transport cost reductions would ensue.
To get around this difficulty, two measures were taken. The first was to increase the number of DMUs. To do so, we took the years of 1999 and 2000 and the same company was considered in the two years as two different DMUs. A similar approach can be seen in Rios and Maçada (2006) and it is one of practical advices given by Podinovsky and Thanassoulis (2007).
The second measure was to decompose the model in two different models each with a total of three variables. Thus a model with three variables and ten DMUs was obtained and the ratio DMUs/variables was within the acceptable practice. However, the models results had to be aggregated at the end. This aggregation was done in two ways: the first, called “benevolent” by the authors, made use of a third DEA model. In this model, the outputs were the results of the previous models and the input was a unitary one. Models with unitary inputs were studied by Lovell and Pastor (1999) and Caporaletti et al. (1999) and applied by Soares de Mello et al. (2008). The second aggregation, named “aggressive” by the authors, was the geometrical average of partial results a approach similar to that of Soares de Mello et al. (2006).
These measures were required because classical DEA models were used. These models require a large number of DMUs in relation to the number of variables. In this paper the Li and Reeves’s (1999) model, built, among other objectives, to deal with a small number of DMUs has been used.
Therefore, this paper contains only one method and takes into consideration one year only. The advantage of using one year only is that external factors such as macro-economic changes do not interfere with the evaluation.
The year is 1999. The highways are the Niterói Bridge, the Rio-Teresópolis Highway, the Rio-Juiz de Fora Highway, the Presidente Dutra Highway and the Osório-Porto Alegre Highway. Some characteristics of those highways are described below.
PONTE – Rio-Niterói S/A Bridge Company
The Rio-Niterói Bridge started its operations in the early seventies, and the Concession Holder PONTE S/A controls it since June 1995. It was the first large-scale highway structure licensed to the private sector (http://www.ponte.com.br).
About 120 thousand vehicles cross this bridge daily. This number increases greatly during holidays and weekends. In fact, the bridge is the main connection between Rio de Janeiro and the Região dos Lagos (Lake District), where some of the most popular beaches of the Rio de Janeiro State are located. Figure 2 shows the location of the bridge.
CRT – Rio-Teresópolis Highway Company
and the Brazilian North-East (http://www.crt.com.br). This is shown in Figure 3. This highway is 142.5 kilometres long. The average daily traffic is about 20 thousand vehicles.
Figure 2 - Geographical representation of the ‘Ponte” connecting Nitéroi to Rio de Janeiro.
Figure 3 - Geographical representation of the CRT connecting Rio de Janeiro to Teresopolis and Além Paraíba.
CONCER – Juiz de Fora-Rio Highway Company
Figure 4 - Geographical representation of the CONCER connecting Rio de Janeiro to Petrópolis and Juiz de Fora.
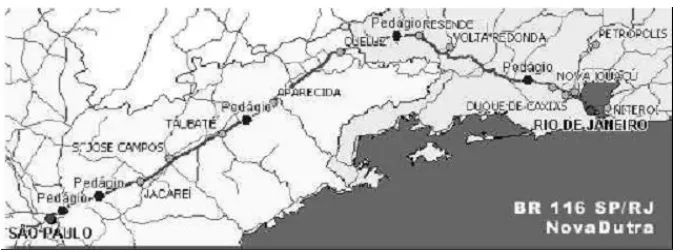
NOVADUTRA – Concession Holder of the Presidente Dutra S/A highway
This highway is an important connection between the two largest cities in Brazil, Rio de Janeiro and Sao Paulo. Its operation began on 1951 and the highway was named “Presidente Dutra Highway”. Due to major cash flow problems, the Brazilian Federal Government was forced to gradually reduce the resources to the infrastructure of this highway. A private company operates the Dutra Highway since the very beginning of the Brazilian privatisation programme. (http://www.novadutra. com.br/ingles/index.html).
This highway crosses the industrial region of Vale do Paraíba, and it is shown in Figure 5.
CONCEPA – Osório-Porto Alegre S/A Highway Company
Figure 5 - Geographical representation of Nova Dutra connecting Rio de Janeiro to São Paulo.
Figure 6 - Geographical representation of CONCEPA connecting Porto Alegre to Osório.
In Gomes et al. (2004), the following models have been used: the first one has as variables accidents/km (input), investment/km (output) and traffic/km (output). For the second model inputs were accidents /km and daily income /km whereas the output was investment/km.
As the MCDEA model is rather appropriate for problems with only a few number of DMUs its used makes possible to aggregate the two hereabove mentioned models in a single one. The variables used in this model are accidents/km and daily income/km as inputs. The outputs are investment/km and traffic/km.
In this model, any DMU with at least one of the following characteristics is efficient: to be safe, to take measures to improve safety, to offer a cheap toll or allocate toll income to improvements for the traveller. Efficiency can also be achieved through linear combinations of the values of these characteristics.
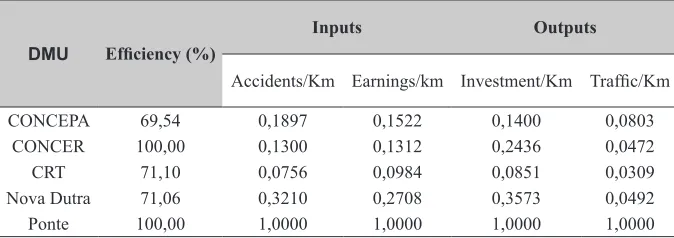
Table 1: Road data and efficiency
DMU Efficiency (%)
Inputs Outputs
Accidents/Km Earnings/km Investment/Km Traffic/Km
CONCEPA 69,54 0,1897 0,1522 0,1400 0,0803
CONCER 100,00 0,1300 0,1312 0,2436 0,0472
CRT 71,10 0,0756 0,0984 0,0851 0,0309
Nova Dutra 71,06 0,3210 0,2708 0,3573 0,0492
Ponte 100,00 1,0000 1,0000 1,0000 1,0000
As it could be expected, almost half of the DMUs are tied owing to their low number. Li and Reeves’s (1999) model is particularly useful for these conditions. The model for DMU CONCEPA is shown in (4) from the data above.
(4)
The original second objective function was divided by the number of DMUs. This division is not envisaged in Li and Reeves’s model and was used to render the weights space scales uniform.
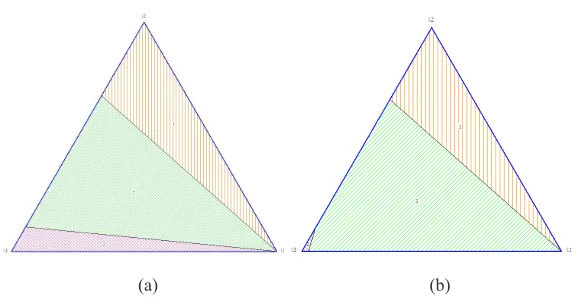
Figures 7a and 7b, obtained by the TRIMAP software, show the decomposition of the weights space for the efficient DMUs CONCER and Ponte.
As expected, the two DMUs have alternative optima for the efficiency objective function. CONCER is both minisum and minimax efficient and DMU 4 (Ponte) is minisum efficient. This means that CONCER is efficient throughout all the weights space, which is not the case for DMU Ponte. According to Li and Reeves’s (1999) original paper, all solutions must be taken into account. So, as DMU Ponte is not efficient throughout all the weights space it ought to have a lower evaluation than DMU CONCER.
(
)
(
)
1
1 2 3 4 5
i
1 2
1 2 1 2 1
1 2 1 2 2
1 2 1 2 3
1 Min d
Min d +d +d +d d 5
Min Max d
Subject to:
0,1897v +0,1522v =1
-0,1897v -0,1522v +0,1400u +0,0803u +d =0 -0,1300v -0,1312v +0,2436u +0,0472u +d =0 -0,0756v -0,0984v +0,0851u +0,0309u +d =0
-0,3210v -0,
+
2 1 2 4
1 2 1 2 5
1 2 3, 4 5 1 2 1 2
2708v +0,3573u +0,0492u +d =0 -v -v u +u +d =0
d ,d ,d d ,d ,v ,v ,u ,u 0
+
(a) (b)
Figure 7 - Decomposition of the weights space for CONCER (a) and Ponte (b)
Conclusions
This paper shows that the potentialities of the MCDEA model can be better used with TRIMAP. The quantitative analysis of the weights space decomposition allows separate evaluations of efficient DMUs. We can, indeed, at a glance check whether the solution that optimises the classic DEA objective function fills in the whole of the weights space, a large or a small share of it. It should be emphasised despite this approach being a simplified one it was sufficient to solve the case studied on this paper. In more complex cases, to calculate the value of the first objective function throughout the whole weights space may be required.
In so far as efficient DMUs are concerned, Ponte and CONCER, the tie was solved taking into account that for the former the solution maximised the Classical DEA objective function and did not fill completely the whole weights space. For CONCER, on the other hand the first objective function in classical DEA was maximal in the whole analysed space.
The results obtained for these DMUs are in agreement with perception of users who think the Ponte toll is very expensive.
As it was possible to untie efficient DMUs, it can be said the use of Li and Reeves’s model with TRIMAP is adequate to increase discrimination among DMUs. This method should be added to the list of those presented by Adler et al. (2002) and Angulo-Meza and Lins (2002).
Furthermore, the MCDEA model does not need the partial results aggregation methods originally used in Gomes et al. (2004) because it builds a single evaluation model for highways .
The MCDEA model has indirectly solved the nil weights problem in DEA. Future research in this field may eventually lead to the direct solution of this problem by replacing one or two of the objective functions in the Li and Reeves’s model.
Bibliography
Adler, N.; Friedman, L. and Sinuany-Stern, Z. (2002), “Review of ranking methods in the data envelopment analysis context”, European Journal of Operational Research, Vol. 140, No. 2, pp. 249-265.
Angulo-Meza, L.; Biondi Neto, L.; Soares de Mello, J. C. C. B. and Gomes, E. G. (2005), “ISYDS - Integrated System for Decision Support (SIAD Sistema Integrado de Apoio a Decisão): A Software Package for Data Envelopment Analysis Model”, Pesquisa Operacional, Vol. 25, No. 3, pp. 493-503.
Angulo-Meza, L. and Lins, M. P. E. (2002), “Review of methods for increasing discrimination in data envelopment analysis”, Annals of Operations Research, Vol. 116, No. 1-4, pp. 225-242.
Caporaletti, L. E.; Dulá, J. H. and Womer, N. K. (1999); “Performance evaluation based on multiple attributes with nonparametric frontiers”, Omega, Vol. 27, No. 6, pp. 637-645.
Charnes, A.; Cooper, W. W. and Rhodes, E. (1978), “Measuring the efficiency of decision-making units”, European Journal of Operational Research, Vol. 2, pp. 429-444.
Clímaco, J. C. N. and Antunes, C. H. (1987), “TRIMAP - an interactive tricriteria linear programming package”, Foundations of Control Engineering, Vol. 12, No. 3, pp. 101-119.
Clímaco, J. C. N. and Antunes, C. H. (1989), “Implementation of an user friendly software package - a guided tour of TRIMAP”, Mathematical and Computer Modelling, Vol. 12, pp. 1299-1309.
Clímaco, J. C. N.; Antunes, C. H. and Alves, M. J. G. (2003), Programação Linear Multiobjectivo. Coimbra: Universidade de Coimbra. (in Portuguese)
Clímaco, J. C. N.; Soares de Mello, J. C. C. B. and Angulo-Meza, L. (2008), Performance Measurement – From DEA to MOLP. In: Adam, F. lland Humphreys, P. (eds). Encyclopedia of Decision Making and Decision Support Technologies. Hershey: IGI Global.
Doyle, J. and Green, R. H. (1994), “Efficiency and cross-efficiency in DEA derivations, meanings and uses”, Journal of the Operational Research Society, Vol. 45, No. 5, 567-578.
Gomes, E. G.; Soares de Mello, J. C. C. B.; Biondi Neto, L. and Angulo-Meza, L. (2004), “Gestão de Auto-Estradas: Análise de Eficiência das Auto-Estradas Federais Brasileiras com Portagens”, Revista Portuguesa e Brasileira de Gestão, Vol. 3, No. 2, pp. 68-75. (in Portuguese)
Joro, T.; Korhonen, P. and Wallenius, J. (1998), “Structural comparison of data envelopment analysis and multiple objective linear programming”, Management Science, Vol. 44, No. 7, pp. 962-970.
Li, X.-B. and Reeves, G. R. (1999), “A multiple criteria approach to data envelopment analysis”, European Journal of Operational Research, Vol. 115, No. 3, pp. 507-517.
Lins, M. P. E.; Angulo-Meza, L. and Moreira da Silva, A. C. (2004), “A multi-objective approach to determine alternative targets in data envelopment analysis”, Journal of the Operational Research Society, Vol. 55, pp. 1090–1101.
Lovell, C. A. K. and Pastor, J. T. (1999), “Radial DEA models without inputs or without outputs”, European Journal of Operational Research, Vol. 118, No. 1, pp. 46-51.
Podinovsky, V. V. and Thanassoulis, E. (2007), “Improving discrimination in Data Envelopment Analysis: some practical suggestions”, Journal of Productivity Analysis, Vol. 28, No. 1-2, pp. 117-126.
Quariguasi Frota Neto, J. and Angulo-Meza, L. (2007), “Alternative targets for data envelopment analysis through multi-objective linear programming: Rio de Janeiro Odontological Public Health System Case Study”, Journal of the Operational Research Society, Vol. 58, pp. 865–873.
Rios, L. R. and Maçada, A. C. G. (2006), “Analysing the relative efficiency of container terminals of Mercosur using DEA”, Maritime Economics and Logistics, Vol. 8, No. 4, pp. 331-346.
Roy, B. (1987), ‘Meaning and validity of interactive procedures as tools for decision making”, European Journal of Operational Research, Vol. 31, No. 3, pp. 297-303.
Sexton, T. R.; Silkman, R. H. and Logan, A. J. (1986), “Data Envelopment Analysis: Critique and extensions”. In: Silkman, H. (ed). Measuring efficiency: An assessment of data envelopment analysis. San Francisco: Jossey-Bass Editor.
Soares de Mello, J. C. C. B.; Gomes, E. G.; Angulo-Meza, L.; Soares de Mello, M. H. C. and Soares de Mello, A. J. R. (2006), “Engineering Post-Graduate Programmes: A Quality and Productivity Analysis”, Studies in Educational Evaluation, 32, No. 2, pp. 136-152.
Bioghaphy
João Carlos Namorado Clímaco is Full Professor at the Faculty of Economics of the University of Coimbra, President of the Scientific Committee of the INESC – Coimbra and Member of Conselho Geral of INESC-Coimbra (the research unit in which he is integrated). He obtained a Master of Science Degree in “Control Systems” at the Imperial College of Science and Technology “, University of London (1978); the “Diploma of Membership of the Imperial College of Science and Technology” (1978); the Ph.D. in Optimization and Systems Theory, Electrical Engineering Department, University of Coimbra (1982); and the title of “Agregação”at the University of Coimbra (1989). He was awarded with: “Conference Chairman Award”, International Society on Multiple Criteria Decision Making-1995” and Grande Oficial da Ordem do Rio Branco, Brazil -1996. He was past Vice-President of ALIO- Latin Ibero American OR Association, past Vice-President of the Portuguese OR Society, and past Member of the International Executive Committee of the International Society on Multiple Criteria Decision Making. He is member of the IFIP-WG 8.3-Decision Support Systems. He belongs to the Editorial Board of the following Scientific Journals: “Investigação Operacional” (Journal of the Portuguese OR Society), the “Journal of Group Decision and Negotiation” and “International Transactions in Operational Research. He is also member of the Editorial Board of the University of Coimbra Press and of the Engevista Journal.
Contact: [email protected]
João Carlos C. B. Soares de Mello graduated in Mechanical Engineering with a Master’s degree in mathematics and a Ph.D degree in Operational Research. He has been head of the Applied Mathematics Department at Fluminense Federal University (UFF) and has been responsible for the operational matters in the entrance exam at the same university for 5 years. He is currently professor at the Production Engineering Departament of the Fluminense Federal University (UFF), researcher of CNPq and “Jovem Cientista do Nosso Estado” of FAPERj.
Contact: [email protected]
and Post Graduation in Computational Modeling from the same university. Dra. Angulo Meza has published articles in the areas of Data Envelopment Analysis and Linear Programming and Multiobjective and she has a Research Productivity Scholarship from the National Council for Scientific and Technological Development (Conselho Nacional de Desenvolvimento Científico e Tecnologico – CNPq).
Contact: [email protected]