http://www.sciencepublishinggroup.com/j/sr doi: 10.11648/j.sr.20170506.11
ISSN: 2329-0935 (Print); ISSN: 2329-0927 (Online)
Osteoporosis Risk Predictive Model Using Supervised
Machine Learning Algorithms
Egejuru Ngozi Chidozie
1, Mhambe Priscilla Dooshima
1, Balogun Jeremiah Ademola
1,
Femi Komolafe
2, Idowu Peter Adebayo
11Department of Computer Science and Engineering, Obafemi Awolowo University, Ile-Ife, Nigeria 2
Engineering Materials Development Institute, Federal Ministry of Science & Technology, Akure, Nigeria
Email address:
*
Corresponding author
To cite this article:
Egejuru Ngozi Chidozie, Mhambe Priscilla Dooshima, Balogun Jeremiah Ademola, Femi Komolafe, Idowu Peter Adebayo. Osteoporosis Risk Predictive Model Using Supervised Machine Learning Algorithms. Science Research. Vol. 5, No. 6, 2017, pp. 78-87.
doi: 10.11648/j.sr.20170506.11
Received: October 24, 2017; Accepted: November 9, 2017; Published: January 20, 2018
Abstract:
In this paper, we developed a model to forecast the risk of osteoporosis using supervised machine learning algorithm. The study identified the variables that were monitored by experts in determining osteoporosis risk, formulated and simulated the predictive model. The performance of the model validation was also performed. This was with a view of developing a predictive model for the classification of osteoporosis risk among patients in Nigeria. A review of extensive literature surrounding the body of knowledge of osteoporosis risk revealed the associated risk factors used were identified and validated by experts, while historical data explaining the relationship between the risk factors and osteoporosis risk was collected. The predictive model for osteoporosis risk was formulated using two (2) supervised machine learning algorithms, namely Naïve Bayes’ (NB) classifier and the Multi-layer Perceptron (MLP) based on the identified risk factors. The results of the identification and data collection showed that there were 20 risk factors identified including the CD4 count level stratified as low, moderate and high risk based on information collected from 45 patients in Nigerian hospitals. The results of the model validation using the 10-fold cross validation revealed that the MLP had the best performance with a value of 100% over the accuracy of NB with a value of 71.4%. The result further showed that the performance of the MLP over the NB was influenced by the ability of the complex nature of the perceptron network to model the problem of identifying the risk of osteoporosis from the values of the risk factors presented in the training dataset. The study concluded that a better understanding of the relationship between the variables will improve the ability of the experts to determine the risk of osteoporosis during the examination of patients.Keywords:
Osteoporosis Risk Classification, Predictive Modeling, Machine Learning1. Introduction
Osteoporosis, a skeletal disease characterized by low bone mass (BMD), micro-architectural deterioration of bone tissue and an increasing risk of fracture, represents an enormous public health burden in both economic costs and human suffering [1]. Osteoporosis literally leads to abnormally porous bone that is compressible, like a sponge. This disorder of the skeleton weakens the bone and results in frequent fractures (breaks) in the bones. Osteoporosis is a real public health problem because of its increasing frequency over the
countries. It becomes an essential index of health and economics in every country [2].
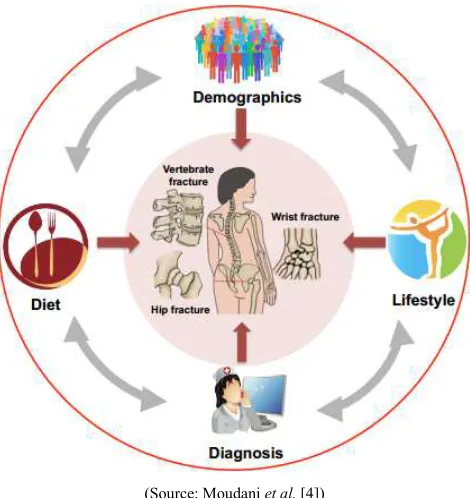
of disease control or prevention. As shown in Figure 1, osteoporosis is a complicated disease which is associated with potential related fractures that include but are not limited to the information of demographic attributes, patients’ clinical records regarding disease diagnoses and treatments, family history, diet, and lifestyle.
(Source: Moudani et al. [4])
Figure 1. Risk factors for Osteoporosis.
More importantly, some common diseases may be clinically silent but can cause significant mortality and morbidity after onset. Unless early prevented or treated, these diseases will affect the quality of life, and increase the burden of healthcare costs. With the success of risk factor analysis and disease prediction based on an intelligent computational model, unnecessary tests can be avoided. The information can assist in evaluating the risk of the occurrence of disease, monitor the disease progression, and facilitate early prevention measures.
Predictive research aims at predicting future events or an outcome based on patterns within a set of variables and has become increasingly popular in medical research [6]. Accurate predictive models can inform patients and physicians about the future cause of an illness or the risk of developing illness and thereby guiding decisions on screening and/or treatment [7]. Data Mining or the efficient discovery of valuable, and obvious information from a large collection of data has a goal to discover knowledge out of data and present it in a form that is easily comprehensible to humans [8]. Data mining has a great potential to enable healthcare systems to use data more efficiently and effectively thereby reducing the likely costs associated with making decisions using machine learning algorithms [9].
Machine learning algorithms provide means of obtaining objective unseen patterns from evidence-based information especially in the public health care sector. These techniques
have allowed for not only substantial improvements to existing clinical decision support systems, but also a platform for improved patient-centered outcomes through the development of personalized prediction models tailored to a patient’s medical history and current condition [4]. Since the advent of advanced computing, doctors have always made use of technology to help them in various possible ways, from surgical imagery to X-ray photography [10]. But whenever it came to the diagnosis and prediction of a disease’s risk, this process depends majorly on the doctor’s knowledge and experience to process the sheer number of variables involved, ranging from medical history to climatic conditions, blood pressure, environment, and various other factors. The number of variables counts up to the total variables that are required to understand the complete working of nature itself, which no model has successfully analyzed yet.
To overcome this problem, medical decision support systems, using such like data mining and machine learning have become more and more essential assisting the doctors to take correct decisions. There is a need for the development of a predictive model for the classification of the risk of osteoporosis using machine learning techniques for the early detection of the disease for providing clinical decision support and improving the living standard of the aged in Nigeria.
2. Related Works
Ordonez et al. [11] applied machine learning techniques to the determination of the incidence of osteoporosis in post-menopausal women. In the study, the relationship between BMD, diet and lifestyle habits for a sample of 305 post-menopausal women constructing a non-linear model using the regression support vector machines technique was identified. Also, an initial preliminary estimate of BMD in the studied women (on the basis of a questionnaire with questions mostly on dietary habits) determined whether they needed densitometry testing was identified. SVMs were used to construct a mathematical model that determined the relationship, whereas regression trees applied to the SVM results identified the parameters with the greatest weight in the relationship. The results concluded that extra calcium intake, a suitable level of exposure to the sun, weight control, regular physical activity and adequate calorie intake were the main factors in minimizing bone mass loss in post-menopausal women.
risk of osteoporosis. The model was formulated using decision trees algorithms such as ID3, C4.5 and Random Forest and simulated. The results showed that random forest decision trees algorithm performed better than other decision trees algorithm with an accuracy of 99.9%.
Hsueh-Wei et al. [12] performed a comparison of classification algorithms using wrapper-based feature selection for predicting osteoporosis. Three classification algorithms were applied: multilayer feed-forward neural network (MFNN), Naïve Bayes and logistic regression. A wrapper-based feature selection method was also used to identify a subset of major SNPs. Experimental result showed that the MFNN model with the wrapper-based approach was the best predictive model for inferring disease susceptibility based on the complex relationship between osteoporosis and SNPs in Taiwanese women. The findings suggest that patients and doctors can use the proposed tool to enhance decision making based on clinical factors such as SNP genotyping data.
Saranya and Sarojimi [13] developed an improved and optimal prediction model for bone disease based on identified risk factors. Initial risk factors for determining the onset of bone diseases were determined following which included using Pre-training and fine tuning. In the pre-training phase, most important risk factors with model parameters are used to calculate contrastive divergence and it minimizes the record size. In the fine tuning phase, a comparison was made with the results achieved in the previous phase with the ground truth value g1 and again the same comparison done with ground truth value g2, where g1 was referred to as osteoporosis and g2 referred to as a bone loss rate. The model was formulated using the Deep Belief Network (DBN) for which comparison was made between the models developed before and after relevant feature identification. The result of the study showed that by using relevant features, the
performance of the predictive model was improved.
3. Methods
The methodological approach of this study composes of a number of methods such as the identification of the required variables for the risk of osteoporosis, the collection of historical datasets about osteoporosis risk cases of patients, formulation of the predictive models using the supervised machine learning algorithms proposed, the simulation of the predictive models using the WEKA simulation environment and the performance evaluation metrics applied during model validation for the evaluation of the performance of the predictive models. The supervised machine learning algorithms chosen for this study are Naïve Bayes and multi-layer perceptron.
3.1. Data Collection
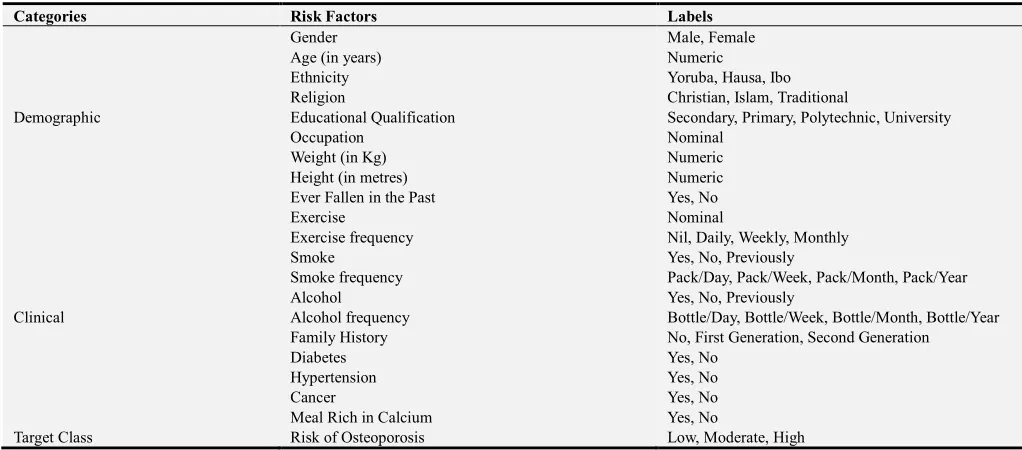
For the purpose of this study, data was collected from 49 patients located in the south-western part of Nigeria using structured questionnaires that consisted of two (2) main sections, namely: demographic information which included: gender, age, ethnicity, occupation, religion and academic qualification, height (meters), weight (Kg), Body mass index (BMI) and if ever fallen ill, and the clinical factors were evaluated based on exercising, frequency of exercise, smoking, smoking frequency, alcohol, alcohol frequency, presence of diabetes, hypertension, cancer, meal rich in calcium all necessary for identifying the risk of Osteoporosis. The information collected consisted of the risk factors associated with the osteoporosis for each patient as proposed by the medical expert. A description of the attributes contained in the dataset is presented in Table 1.
Table 1. Identified Variables for the Risk of Osteoporosis.
Categories Risk Factors Labels
Demographic
Gender Male, Female
Age (in years) Numeric
Ethnicity Yoruba, Hausa, Ibo
Religion Christian, Islam, Traditional
Educational Qualification Secondary, Primary, Polytechnic, University
Occupation Nominal
Weight (in Kg) Numeric
Height (in metres) Numeric
Ever Fallen in the Past Yes, No
Clinical
Exercise Nominal
Exercise frequency Nil, Daily, Weekly, Monthly
Smoke Yes, No, Previously
Smoke frequency Pack/Day, Pack/Week, Pack/Month, Pack/Year
Alcohol Yes, No, Previously
Alcohol frequency Bottle/Day, Bottle/Week, Bottle/Month, Bottle/Year
Family History No, First Generation, Second Generation
Diabetes Yes, No
Hypertension Yes, No
Cancer Yes, No
Meal Rich in Calcium Yes, No
3.2. Data-Preprocessing
Following the collection of data from the 49 patients alongside the attributes (20 risk factors) alongside the risk of osteoporosis, the data collected was checked for the presence of error in data entry including misspellings and missing data. Following this process, there was no error in misspellings but there were missing data in the cells describing some of the records. The data was stored in spreadsheet format using the Microsoft Excel available in the Microsoft Office 2013 suite of desktop publishing tools. The format for which the data was stored was in comma separated variable (.csv) as osteoporosis-training-data.csv. The dataset collected for the purpose of the development of the predictive model for the risk of osteoporosis which was stored in.csv file format with the name osteoporosis-training-data.csv
while the number of attributes listed in the attribute section were 21 including the target attribute. Following this, the values of the risk factors for the record of the 49 patients considered for this study was provided.
3.3. Model Formulation
Systems that construct classifiers are one of the commonly used tools in data mining. Such systems take as input a collection of cases, each belonging to one of a small number of classes and described by its values for a fixed set of attributes, and output a classifier that can accurately predict the class to which a new case belongs. Supervised machine learning algorithms make it possible to assign a set of records (osteoporosis risk indicators) to a target classes – the risk of osteoporosis. Equation 1 shows the mapping function that describes the relationship between the risk factors and the target class – risk of osteoporosis.
: → (1)
: =
The equation shows the relationship between the set of risk factors represented by a vector, X consisting of the values of i risk factors and the label Y which defines the risk of osteoporosis – low, moderate and high risk of osteoporosis as expressed in equation 3.2. Assuming the values of the set of risk factors for an individual is represented as = { , , , . . . , } where is the value of each risk factor, i = 1 to i; then the mapping used to represent the predictive model for osteoporosis risk maps the risk factors of each individual to their respective risk of osteoporosis according to equation 2.
= !
" #ℎ (2) Supervised machine learning algorithms are Black-boxed models, thus it is not possible to give an exact description of the mathematical relationship existing among the independent variables (input variables) with respect to the
target variable (output variable – risk of osteoporosis). Cost functions are used by supervised machine learning algorithms to estimate the error in prediction during the training of data for model development. Although, the decision trees algorithm is a white-boxed model owing to its ability of been interpreted as a tree-structure.
3.3.1. Naïve Bayes’ Classifier
Naive Bayes’ Classifier is a probabilistic model based on Bayes’ theorem. It is defined as a statistical classifier. It is one of the frequently used methods for supervised learning. It provides an efficient way of handling any number of attributes or classes which is purely based on probabilistic theory. Bayesian classification provides practical learning algorithms and prior knowledge on observed data. Let % be a dataset sample containing records (or instances) of i
number of risks factors (attributes/features) alongside their respective risk of osteoporosis, C (target class) collected for j
number of records/patients and "& = {" = , " = ! , " = " #ℎ} be a hypothesis that % belongs to class C. For the classification of the risk of infertility given the values of the risk factor of the jth record, Naïve Bayes’ classification required the determination of the following:
a. ' "&| % – Posteriori probability: is the probability that the hypothesis, "& holds given the observed data sample % for 1 ≤ ≤ 3.
b. ' "& - Prior probability: is the initial probability of the target class 1 ≤ ≤ 3;
c. ' % is the probability that the sample data is observed for each risk factor (or attribute), i; and d. ' | %|"& is the probability of observing the sample’s
attribute, given that the hypothesis holds in the training data %.
Therefore, the posteriori probability of an hypothesis "& is defined according to Bayes’ theorem as follows:
',"
&-
%.
= ∏=1',' "0|".' = 1, 2, 3 (3)Hence, the risk of osteoporosis for a record is thus:
= 2 3' | & , ' 4 ! | & , ' ℎ #ℎ| & 5 (4)
3.3.2. Multi-Layer Perceptron
layers of the MLP architecture shown in equation (7).
∑&8 &7&= 7 + 7 + ⋯ + 7 =< . 7 > (5) Using the back-propagation algorithm, the MLP compares the output calculated with the actual in order to compute an error-function. Gradient descent was then used to feed the error back to the system from output nodes through the nodes in the hidden layers to the nodes at the input layer while adjusting the weights as a function of the error determined at each node. The process was repeated for a number of training cycles for which the MLP network converged to a state where the error determined was small enough, then the MLP network was able to learn the target function.
The back-propagation learning algorithm can be divided
into two phases: propagation and weight update.
a. Phase 1 – Propagation: each propagation involves the following steps:
i. Forward propagation of training pattern’s input through each node j in the neural network in order to generate the propagation’s output activations;
=!>=! ?%= ∑&8 &%7&+ @& = A = BCDE (6)
ii. Backward propagation of the propagation’s output activations through the neural network using the training pattern target in order to generate deltas F% of all output and hidden neurons.
F%= GIGHJ GKCLGIJJ= M
,?%− >%. , !%. O1 − , !%.P 0 =!>=! = ,
∑ FQRS % %Q , !%. O1 − , !%.P 0 =
(7)
b. Phase 2 – Weight update: for each weight-synapse, hence the following:
i. Multiply its output delta and input activation to get the gradient of the weight
GH
GTUJ= F%7 (8)
ii. Subtract a ratio (percentage V) of the gradient from the weight.
∆ %= −VGTGHUJ (9)
3.4. Performance Evaluation
In order to evaluate the performance of the supervised machine learning algorithms used for the classification of the risk of osteoporosis, there was the need to plot the results of the classification on a confusion matrix (Figure 2). A confusion matrix is a square which shows the actual classification along the vertical and the predicted along the horizontal. Correct classifications were plotted along the diagonal from the north-west position for the low cases predicted as Low (A), Moderate (E) and High (I) on the south-east corner (also called true positives and negatives). The incorrect classifications were plotted in the remaining cells of the confusion matrix (also called false positives). These results are presented on confusion matrix – for this study the confusion matrix is a 3 x 3 matrix table owing to the three (3) labels of the output class.
Figure 2. Diagram of a Confusion Matrix.
Also, the actual Low cases are A+B+C, actual Moderate cases are D+E+F and the actual High cases are G+H+I while the predicted Low are A+D+G, predicted Moderate are B+E+H and predicted High are C+F+I. The developed model was validated using a number of performance metrics based on the values of A – I in the confusion matrix for each predictive model. They are presented as follows.
a. Accuracy: the total number of correct classification
2XX= XY = L\L]Q__]`C`ZBHB[ (10)
b. True positive rate (recall/sensitivity): the proportion of actual cases correctly classified
a'Q\T =ZBbBcZ (11)
a'd\eCf]LC =gBHBhH (12)
a'i ji=kBlB[[ (13)
c. False positive (false alarm/1-specificity): the proportion of negative cases incorrectly classified as positive
m'Q\T =]_Ln]QoUpoB]_Ln]QgBk qrstuvwt (14)
m'd\eCf]LC=]_Ln]QxrybBlB]_Ln]QoUpo (15)
m'i ji=]_Ln]QqrstuvwtcBhB]_Ln]Qxry (16)
d. Precision: the proportion of predictions that are correct
' X Q\T=ZBgBkZ (17)
' X d\eCf]LC=bBHBlh (18)
4. Results
This section presents the results of the methods that were applied for the development of the predictive model for the risk of osteoporosis. The results presented were that of the data collection, model formulation and simulation results using the WEKA software following the results of the model validation of the predictive model for osteoporosis.
4.1. Data Description
For this study, data was collected from 49 patients using the questionnaires constructed for this study among which; the risk of osteoporosis was identified. Table 2 gives a description of the number of patients with their respective risk of osteoporosis from the 49 patient records selected for model formulation and validation which were stored in the osteoporosis-training-csv data file. The table shows that out of the 49 patients considered; 36.7% of the respondents had low risk of osteoporosis, 42.9% of the respondents had moderate risk of osteoporosis while 10.4% of respondents had high risk of osteoporosis. It was observed that the highest case presented was for respondents with moderate risk of osteoporosis while the least case was presented for respondents with high risk of osteoporosis.
Table 2. Distribution of osteoporosis risk among historical dataset.
Osteoporosis risk Frequency Percentage (%)
Low 18 36.7
Moderate 21 42.9
Total 10 10.4
Table 3 gives a description of the demographic data collected from all 49 respondents selected for the study; it shows the distribution of the values of each demographic and clinical variables considered. From the data presented, a number of results were observed such as presented in the following paragraphs. The results of the variable description showed that there were more females than male patients with a proportion of 69.4% and 30.6% of female and male patients respectively. The results further showed that the patients in the study had a lowest age of 20 years while the highest age was 84 years with a mean age of 56 years with majority of the patients were above 50 years of age.
Table 3. Description of Demographic Data of respondents.
Variable Name Labels Frequency Percentage (%)
Gender Male 15 30.6
Female 34 69.4
Ethnicity
Yoruba 23 46.9
Ibo 12 24.5
Hausa 13 26.5
Missing 1 2.1
Religion
Christianity 27 55.1
Islam 19 38.8
Traditional 2 4.1
Missing 1 2.0
Education
Primary 8 16.3
Secondary 22 44.9
Polytechnic 14 28.6
University 5 10.2
Variable Name Labels Frequency Percentage (%)
Occupation
Trader 29 59.2
Farmer 7 14.3
Clerical 7 14.3
Artisan 2 4.1
Teacher 3 6.1
Others 1 2.0
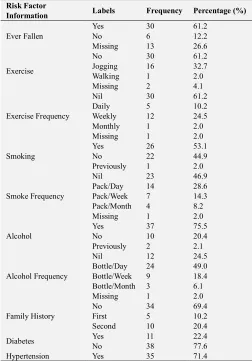
Table 4 shows the results of the clinical risk factor description of the patients for the data collected showed that: 61.2% had ever fallen in the past while 12.2% had never fallen in the past. The results showed that 60% of the patients did not take part in exercises while 32% partook in jogging with 10% doing exercise daily and 24% weekly. The results of the study showed that 53% of the patients were smokers while 2% were previous smokers out of which 28% smoke a pack daily and 14% smoking a pack weekly. The results of the study showed that 76% of the patients consume alcohol with 49% of respondents consuming a bottle of alcohol per day and 18% consuming a bottle per week. The results of the study also showed that 69% of the respondents had no family history of osteoporosis with 10% and 20% having first and second generation family history respectively. The results of the study showed that 71% of the respondents had hypertension, 80% had cancer while 90% took means that were rich in calcium.
Table 4. Description of Risk Factor Data of respondents
Risk Factor
Information Labels Frequency Percentage (%)
Ever Fallen
Yes 30 61.2
No 6 12.2
Missing 13 26.6
Exercise
No 30 61.2
Jogging 16 32.7
Walking 1 2.0
Missing 2 4.1
Exercise Frequency
Nil 30 61.2
Daily 5 10.2
Weekly 12 24.5
Monthly 1 2.0
Missing 1 2.0
Smoking
Yes 26 53.1
No 22 44.9
Previously 1 2.0
Smoke Frequency
Nil 23 46.9
Pack/Day 14 28.6
Pack/Week 7 14.3
Pack/Month 4 8.2
Missing 1 2.0
Alcohol
Yes 37 75.5
No 10 20.4
Previously 2 2.1
Alcohol Frequency
Nil 12 24.5
Bottle/Day 24 49.0 Bottle/Week 9 18.4 Bottle/Month 3 6.1
Missing 1 2.0
Family History
No 34 69.4
First 5 10.2
Second 10 20.4
Diabetes Yes 11 22.4
No 38 77.6
Risk Factor
Information Labels Frequency Percentage (%)
No 14 28.6
Cancer Yes 39 79.6
No 10 20.4
Meal Rich in Calcium Yes 44 89.8
No 5 10.2
Osteoporosis Risk
Low 18 36.7
Moderate 21 42.9
High 10 10.4
Ever Fallen
Yes 30 61.2
No 6 12.2
Missing 13 26.6
Exercise
No 30 61.2
Jogging 16 32.7
Walking 1 2.0
Missing 2 4.1
4.2. Simulation Results
Two different supervised machine learning algorithms were used to formulate the predictive model for the risk of osteoporosis namely: naïve Bayes’ and the multi-layer perceptron classifiers. They were used to train the development of the prediction model using the dataset containing 49 patients’ risk factor records. The simulation of the prediction models
was done using the Waikato Environment for Knowledge Analysis (WEKA). The C4.5 decision trees algorithm was implemented using the J48 decision trees algorithm available in the trees class and the multi-layer perceptron was implemented using the multilayer perceptron class all available on the WEKA environment of classification tools. The models were trained using the 10-fold cross validation method which splits the dataset into 10 subsets of data – while 9 parts are used for training the remaining one is used for testing; this process is repeated until the remaining 9 parts take their turn for testing the model.
4.2.1. Results of the Naïve Bayes’ Classifier
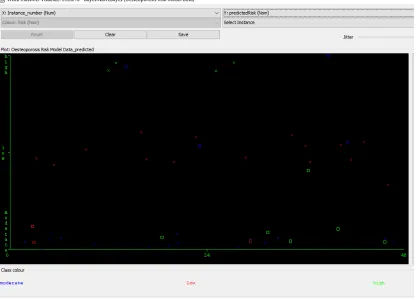
Using the Naïve Bayes’ Classifier, the predictive model developed using the training data via the 10-fold cross validation method. Figure 3 shows the graphical plot of the predictions made by the Naive Bayes’ Classifier algorithm on the dataset, each class of osteoporosis is represented using a specific colour and each correct classification is represented with a star while each misclassification is represented as a square. The result was used to evaluate the performance of the Naive Bayes classifier algorithm and thus, the confusion matrix determined as shown in figure 4.
Figure 3. Screenshot of Naïve Bayes’ Classification Results.
From the confusion matrix shown in figure 4, the following sections present the results of the model’s performance. Based on the results presented in the confusion matrix with the naïve Bayes’ classifier used to train the predictive model developed using the training data via the 10-fold cross validation method, it was discovered that there
Figure 4. Confusion matrix of performance evaluation using naïve Bayes.
Hence, the predictive model for the risk of osteoporosis using the naïve Bayes’ classifier showed an accuracy of 73.5%. From the information provided by the confusion matrix, it was discovered that 17 out of the 19 low cases were correctly classified; out of the 18 moderate cases, 15 were
correctly classified while 3 were misclassified as low and out of the 10 high cases, 4 were correctly classified while 1 and 4 were misclassified as low and moderate respectively.
4.2.2. Results of the Multi-Layer Perceptron Classifier
Using the Multi-layer perceptron classifier to train the predictive model developed using the training data via the 10-fold cross validation method. Figure 5 shows the graphical plot of the predictions made by the Multi-layer perceptron classifier algorithm on the dataset, each class of osteoporosis is represented using a specific colour and each correct classification is represented with a star while each misclassification is represented as a square. The result presented in figure 5 was used to evaluate the performance of the Multi-layer perceptron classifier algorithm and thus, the confusion matrix determined as shown in figure 6.
Figure 5. Screenshot of Multi-layer perceptron Classification Results.
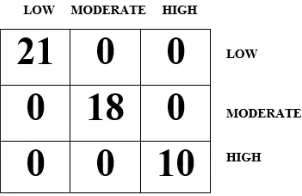
From the confusion matrix shown in figure 6, the following sections present the results of the model’s performance. Based on the results presented in the confusion matrix with the Multi-layer Perceptron used to train the predictive model developed using the training data via the 10-fold cross validation method, it was discovered that there were 49 (100%) correct classifications (21 for low, 18 for moderate and 10 for high cases – along the diagonal) and no (0%) incorrect classifications as shown in figure 5. Hence, the predictive model for the risk of osteoporosis using the multi-layer perceptron showed an accuracy of 100%.
4.3. Discussions
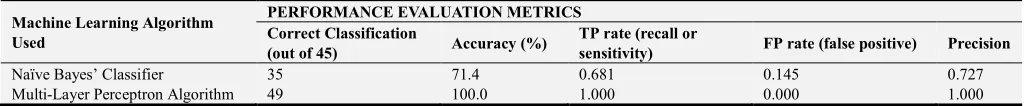
The results of the performance evaluation of the machine learning algorithms are presented in Table 5 which shows the average values of each performance evaluation metrics considered for this study. For the Naïve Bayes’ Classifier algorithm based on the results presented in the confusion matrix presented in figure 5. The result showed that the TP rate which gave a description of the proportion of actual
cases that was correctly predicted was 0.681 and this implied that 68.1% of the actual cases were correctly predicted; the FP rate which gave a description of the proportion of actual cases misclassified was 0.145 which implied that 14.5% of actual cases were misclassified while the precision which gave a description of the proportion of predictions that were correctly classified was 0.727 which implied that 72.7% of the predictions made by the classifier were correct.
Table 5. Summary of Validation Results for C4.5, naïve Bayes’ and MLP classifiers.
Machine Learning Algorithm Used
PERFORMANCE EVALUATION METRICS Correct Classification
(out of 45) Accuracy (%)
TP rate (recall or
sensitivity) FP rate (false positive) Precision
Naïve Bayes’ Classifier 35 71.4 0.681 0.145 0.727
Multi-Layer Perceptron Algorithm 49 100.0 1.000 0.000 1.000
For the naive Bayes classifier algorithm based on the results presented in the confusion matrix presented in figure 4. The results showed that the TP rate which gave a description of the proportion of actual cases that were correctly predicted was 0.812 and this implied that 81% of the actual cases were correctly predicted; the FP rate which gave a description of the proportion of actual cases misclassified was 0.105 which implied that 11% of actual cases were misclassified while the precision which gave a description of the proportion of predictions that were correctly classified was 0.852 which implied that 85% of the predictions made by the classifier were correct.
For the multi-layer perceptron algorithm based on the results presented in the confusion matrix presented in figure 6. The result showed that the TP rate which gave a description of the proportion of actual cases that was correctly predicted was 1 which implied that all of the actual cases were correctly predicted; the FP rate which gave a description of the proportion of actual cases misclassified was 0 which implied that none of actual cases were misclassified while the precision which gave a description of the proportion of predictions that were correctly classified was 1 and this implied that all of the predictions made by the classifier were correct.
In general, Multi-layer Perceptron algorithms were able to classify the risk of osteoporosis better than the Naïve Bayes’ classifier algorithm. The Multi-layer Perceptron algorithm was able to accurately classify all cases of osteoporosis with a value of 100%.
5. Conclusions
This study focused on the development of a prediction model using identified risk factors in order to classify the risk of osteoporosis in selected respondents for this study. Historical dataset on the distribution of the risk of osteoporosis among respondents was collected using questionnaires following the identification of associated risk factors of osteoporosis from expert ophthalmologists. The dataset containing information about the risk factors identified and collected from the respondents was used to
formulate predictive models for the risk of osteoporosis using Naïve Bayes’ and Multi-layer Perceptron Classifier algorithms. The predictive model development using the algorithms was formulated and simulated using the WEKA software.
Following the comparison of the performance of the machine learning algorithms used in this study, it was observed that the multi-layer perceptron had the best capability to identify the unseen patterns existing within the variables used to formulate the predictive model for the risk of osteoporosis. Following the development of the prediction model for osteoporosis risk classification, a better understanding of the relationship between the attributes relevant to osteoporosis risk was proposed. The model can also be integrated into existing Health Information System (HIS) which captures and manages clinical information which can be fed to the osteoporosis risk classification prediction model, and hence improving the clinical decisions affecting osteoporosis risk and the real-time assessment of clinical information affecting osteoporosis risk from remote locations.
References
[1] Moudani, W., Shahin, A., Chakik, F. and Rajab, D. (2011). Intelligent Predictive Osteoporosis System. International Journal of Computer Applications 32 (5): 28–37.
[2] Taylor, B. C., Schreiner, P. J. and Stone, K. L. (2004). Long-term prediction of incident hip fracture risk in elderly white women: study of osteoporotic fractures. American Journal of Geriatr Soc 52: 1479–1486.
[3] Kanis, J. A. and Johnell, O. (2005). Requirements for DXA for the management of osteoporosis in Europe. Osteoporosis International 16: 229–238.
[4] Moudani, W., Shahin, A., Chakik, F. and Mora-Camino, F. (2011a). Dynamic Rough Sets Features Reduction.
International Journal of Computer Science and Information Security 9 (4): 1–12.
[6] Idowu, P. A., Aladekomo, T. A., Williams, K. O. and Balogun, J. A. (2015). Predictive model for likelihood of Sickle cell aneamia (SCA) among pediatric patients using fuzzy logic.
Transactions in networks and communications 31 (1): 31–44. [7] Waijee, A., Mukherjee, A. and Singal, A. (2013). Comparison
of modern imputation methods for missing laboratory data in medicine. BMJ Open 3 (8): 1–7.
[8] Megala, S. and Hemalatha, M. (2011). A Novel Data Mining Approach to Determine the Vanished Agricultural Land in Tamilnadu. International Journal of Computer Applications 23 (3): 23–28.
[9] Agbelusi, O. (2014). Development of a predictive model for survival of HIV/AIDS patients in South-western Nigeria, Unpublished MPhil Thesis, Obafemi Awolowo University, Ile-Ife, Nigeria.
[10] Kälvesten, J., Lui, L.-Y., Brismar, T. and Cummings, S. (2016). Digital X-Ray Radio-grammetry in the Study of
Osteoporotic Fractures: Comparison to dual energy X-ray absorptiometry and FRAX. Bone 86: 30–35.
[11] Ordonez, C., Matias, J. M., de Cos Juez, J. F. and Garcia, P. J. (2009). Machine Learning Techniques applied to the Determination of Osteoporosis Incidence in Post-Menopausal Women. Journal of Mathematical and Computational Modeling 50: 673–679.
[12] Hseuh-Wei, C., Yu-Hsien, C., Hao-Yun, K., Cheng-Hing, Y. and Wen-Hsien, H. (2013). Comparison of Classification Algorithms with Wrapper-Based Feature Selection for Predicting Osteoporosis Outcome Based on Genetic Factors in a Taiwanese Women Population. International Journal of Endocrinology 2013: 1–8.
[13] Saranya, M. and Sarojimi, K. (2016). An Improved and Optimal Prediction of Bone Disease Based in Risk Factors.