INTERNATIONAL JOURNAL OF PHARMACEUTICAL, CHEMICAL AND BIOLOGICAL SCIENCES
Available online at
www.ijpcbs.com
DEVELOPMENT AND VALIDATION OF HPLC METHOD FOR THE
ESTIMATION OF VILDAGLIPTIN IN PHARMACEUTICAL DOSAGE FORM
K. Hanumantha Rao
1, A. Lakshmana Rao
2*and KB. Chandra Sekhar
31
Department of Pharmacy, Krishna University, Machilipatnam- 521 001, Andhra Pradesh, India.
2V. V. Institute of Pharmaceutical Sciences, Gudlavalleru- 521 356, Andhra Pradesh, India.
3
Departement of Chemistry, JNTUA, Anantapuramu- 515 002, Andhra Pradesh, India.
INTRODUCTION
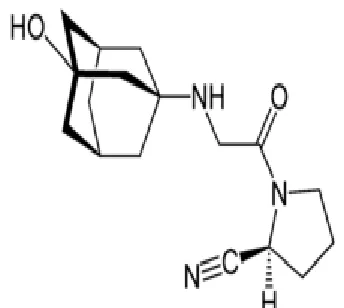
Vildagliptin (Fig. 1) is an oral anti-diabetic drug, potent dipeptidyl peptidase IV (DPP-IV) inhibitor for the treatment of diabetes1,2. Chemically, it is (S)-1-[N-(3-hydroxy-1-adamantyl)glycyl]
pyrrolidine-2-carbonitrile. DPP-IV inhibitors represent a new class of oral antihyperglycemic agents to treat patients with type-2 diabetes3. DPP-IV inhibitors improve fasting and postprandial glycemic control without hypoglycemia or weight gain. Vildagliptin inhibits the inactivation of GLP-1 and GIP by DPP-IV, allowing GLP-1 and GIP to potentiate the secretion of insulin in the beta cells and suppress glucagon release by the alpha cells of the islets of Langerhans in the pancreas4,5.
Literature survey revealed that few analytical methods such as spectrophotometric6-8, HPLC9-17 and LC-MS18,19 methods have been reported for the estimation of Vildagliptin in alone or in combination with other drugs. Hence a new
sensitive and accurate HPLC method was developed and validated as per ICH guidelines20 for the estimation of Vildagliptin in bulk sample and in pharmaceutical dosage form.
MATERIALS AND METHODS Instrumentation
The liquid chromatographic system consisted of Waters HPLC system equipped with a reverse phase Altima C18 column (150 mm x 4.6mm; 5 μm), a 2695 binary pump, a 10 μL injection loop and a 2487 dual absorbance detector and running on Waters Empower 2 software. Shimadzu electronic balance (AX-200) was used for weighing purpose.
Reagents and materials
The working standard of Vildagliptin was provided as gift sample from Spectrum Labs, Hyderabad, India. The market formulation GALVUS tablets (Vildagliptin 50 mg) were
Research Article
ABSTRACT
A simple, specific, accurate and precise reverse phase high performance liquid chromatographic method was developed and validated for the estimation of Vildagliptin in tablet dosage form. An Altima C18 column having 150 mm x 4.6 mm internal diameter, 5 µm particle size in isocratic mode with mobile phase containing dilute orthophosphoric acid solution pH 2.6±0.5 as buffer and acetonitrile (72:28 v/v) was used. The flow rate was 1.0 ml/min and effluents were monitored at 266 nm. The retention time for Vildagliptin was 3.25 min. The method was validated for linearity, accuracy, precision, specificity, limit of detection, limit of quantification and robustness. Limit of detection and limit of quantification were found 0.06 µg/ml and 0.21 µg/ml respectively and recovery of Vildagliptin from tablet formulation was found 99.73%. The proposed method was successfully applied for the quantitative determination of Vildagliptin in tablet formulation.
procured from local market. Acetonitrile of HPLC grade was purchased from E.Merck, Mumbai, India. HPLC grade water was obtained by double distillation and purification through milli-Q water purification system. Orthophosphoric acid of analytical grade was procured from Qualigens, Mumbai, India.
Preparation of standard stock solution
10 mg of Vildagliptin was accurately weighed, transferred to 10 ml volumetric flask and is dissolved in 7 ml of the diluent. Sonicated the solution for few minutes to dissolve the drug completely. Then it is filtered through 0.45 μ filter and the volume is made up to 10 ml with diluent to get a concentration of 1 mg/ml stock solution. Further pipetted 0.4 ml of the above stock solution into a 10 ml volumetric flask and diluted up to the mark with diluent to obtain required concentrations.
Preparation of sample Solution
Twenty tablets were weighed and finely powdered. An accurately weighed portion of powder sample equivalent to 10 mg of Vildagliptin was transferred to 10 ml volumetric flask and is dissolved in 7 ml of the diluent. Sonicated the solution for few minutes to dissolve the drug completely. Then it is filtered through 0.45 μ filter and the volume is made up to 10 ml with diluent. Further pipetted 0.4 ml of the above stock solution into a 10 ml volumetric flask and diluted up to the mark with diluent to obtain required concentration.
Chromatographic conditions
HPLC was connected with Altima C18 column (150 mm x 4.6 mm, 5 µm) as stationary phase. A mixture of dilute orthophosphoric acid solution pH 2.6±0.5 as buffer and acetonitrile in the ratio of 72:28 v/v was prepared and used as mobile phase. The orthophosphoric acid buffer solution was prepared by transferring about 1 ml of concentrated orthophosphoric acid into 1000 ml standard flask, add 400 ml of milli-Q water, mix and dilute to volume with illi-Q water, sonicate for five minutes and cool to room temperature, measure the pH of above solution and finally adjusted the pH to 2.6 with orthophosphoric acid solution and filtered through 0.45 µ nylon filter. The 100% water was used as diluent. Injection volume was 10 µL and flow rate was 1.0 mL/min and run time was 7.0 min. The column was maintained at ambient temperature and the eluent was monitored at 266 nm.
Calibration curve
Appropriate aliquots of standard Vildagliptin stock solution were taken in different volumetric flasks and resultant solution was diluted up to the mark with mobile phase to obtain final concentration of 25, 50, 75, 100, 125 and 150 μg/ml of Vildagliptin. These solutions were injected into chromatographic system, chromatograms were obtained and peak area ratio was determined for each concentration of drug solution. Calibration curve of Vildagliptin was constructed by plotting peak area ratio versus applied concentration of Vildagliptin and regression equation was computed. Similarly the sample solution was chromatographed and concentration of Vildagliptin in tablet sample was found out using regression equation.
Method validation
The method was validated for linearity, specificity, limit of detection, limit of quantification, accuracy, precision, stability and robustness by following procedures.
Linearity and range
The linearity of the method was determined at six concentration levels ranging from 25-150 μg/ml for Vildagliptin. Evaluation of the drug was performed with UV detector at 266 nm, peak area was recorded for all the peaks. The correlation coefficient value of Vildagliptin was 0.999. The results show that an excellent correlation exists between peak area and concentration of drug within the concentration range indicated.
Specificity
Commonly used excipients (colloidal silicon dioxide, lactose, magnesium stearate, starch and talc) were spiked into a pre-weighed quantity of drug. The chromatogram was taken by appropriate dilutions and the quantity of drug was determined.
Limit of detection and limit of quantification The limit of detection (LOD) and limit of quantification (LOQ) of the developed method were determined by injecting progressively low concentrations of the standard solution using the developed HPLC method. The LOD for Vildagliptin was found to be 0.06 µg/ml and the LOQ for Vildagliptin was found to be 0.21 µg/ml.
Accuracy
of standard addition. Known amount of Vildagliptin was added to a pre-quantified sample solution and the amount of Vildagliptin was estimated by measuring the peak area ratios and by fitting these values to the straight line equation of calibration curve. The recovery studies were carried out three times over the specified concentration range of 50%, 100% and 150% levels. The amount of Vildagliptin was estimated by measuring the peak area ratios by fitting these values to the straight line equation of calibration curve. From the above determination, percentage recovery and standard deviation of percentage recovery were calculated.
Precision
The intra-day precision study of Vildagliptin was carried out by estimating the correspondence responses six times on the same day with 100 μg/ml concentration and inter-day precision study of Vildagliptin was carried out by estimating the correspondence responses six times next day with 100 μg/ml concentration.
Stability
In order to demonstrate the stability of both standard and sample solutions during analysis, both the solutions were analyzed over a period of 8 hours at room temperature.
Robustness
Robustness of the method was studied by changing the composition of organic phase by ±4% and the pH by ± 0.1, and also by observing the stability of the drugs for 24 hours at ambient temperature in the mobile phase.
RESULTS AND DISCUSSION
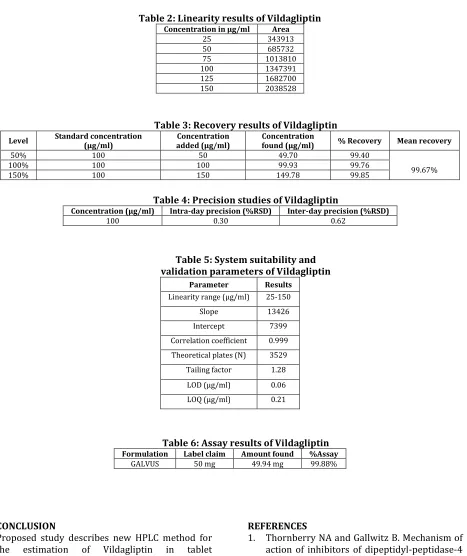
The procedure was optimized with a view to develop an accurate and precise HPLC method in tablet dosage form using Altima C18 column (150 mm x 4.6 mm, 5 µm) in isocratic mode with mobile phase composition of dilute orthophosphoric acid solution pH 2.6±0.5 as buffer and acetonitrile (72:28 v/v) and pH adjusted to 2.6 with orthophosphoric acid. The use of dilute orthophosphoric acid and acetonitrile in the ratio of 72:28 v/v resulted in peak with good shape and resolution. The flow rate was 1.0 ml/min and the drug component was measured with UV detector at 266 nm. The results of optimized HPLC conditions were shown in Table 1. The method was linear in the range of 25 to 150 µg/mL for Vildagliptin with correlation coefficient of 0.999. The regression equation of Vildagliptin
concentration over its peak area ratio was found to be Y=13426X+7399, where X is the concentration of Vildagliptin and Y is the respective peak area. The linearity results were shown in Table 2 and the linearity curve was shown in Fig. 2.The % recovery was found to be 99.73% for Vildagliptin, which indicate the method is accurate. The results of recovery studies were shown in Table 3. The %RSD for intra-day precision and inter-day precision for Vildagliptin were found to be 0.30 and 0.62, the values were less than 2% which indicate the method is precise. The results of precision studies were shown in Table 4.
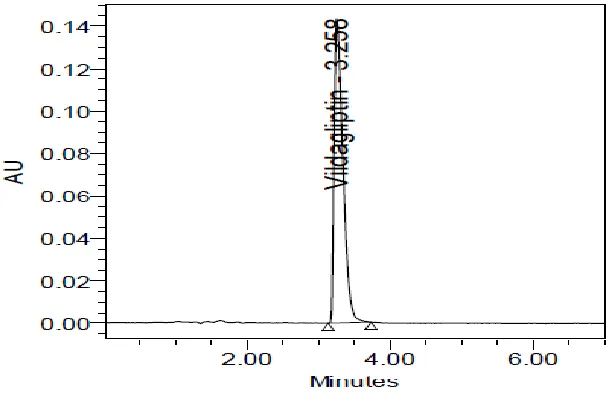
The retention time of Vildagliptin was 3.258 min. The number of theoretical plates was 3529 and tailing factor was 1.28 for Vildagliptin, which indicates efficient performance of the column.The limit of detection and limit of quantification for Vildagliptin were found to be 0.06 µg/ml and 0.21 µg/ml, which indicate the sensitivity of the method. The summary of system suitability parameters and validation parameters were shown in Table 5. Validated method was applied for the determination of Vildagliptin in commercial formulations. The %assay was found to be 99.88% for Vildagliptin and the assay results were shown in Table 6.Typical chromatogram of drug Vildagliptin was shown in Fig. 3. No interfering peaks were found in the chromatogram of the formulation within the run time indicating that excipients used in the formulation did not interfere with the estimation of the drug by the proposed HPLC method.
Fig. 2: Linearity curve of Vildagliptin
Fig. 3: Typical HPLC Chromatogram of Vildagliptin
Table 1: Optimized chromatographic conditions of Vildagliptin
Parameter Condition
Mobile phase acid:acetonitrile (72:28 v/v) Dilute orthophosphoric
pH 2.6
Diluent Water
Column Altima C18 column (150 mm x 4.6 mm, 5 µm)
Column temperature Ambient
Wave length 266 nm
Injection volume 10 µl
Flow rate 1.0 ml/min
Run time 7 min
Table 2: Linearity results of Vildagliptin Concentration in μg/ml Area
25 343913
50 685732
75 1013810
100 1347391
125 1682700
150 2038528
Table 3: Recovery results of Vildagliptin
Level Standard concentration (μg/ml) added (μg/ml)Concentration found (μg/ml)Concentration % Recovery Mean recovery
50% 100 50 49.70 99.40
99.67%
100% 100 100 99.93 99.76
150% 100 150 149.78 99.85
Table 4: Precision studies of Vildagliptin
Concentration (µg/ml) Intra-day precision (%RSD) Inter-day precision (%RSD)
100 0.30 0.62
Table 5: System suitability and validation parameters of Vildagliptin
Parameter Results
Linearity range (μg/ml) 25-150
Slope 13426
Intercept 7399
Correlation coefficient 0.999 Theoretical plates (N) 3529
Tailing factor 1.28
LOD (μg/ml) 0.06
LOQ (μg/ml) 0.21
Table 6: Assay results of Vildagliptin Formulation Label claim Amount found %Assay
GALVUS 50 mg 49.94 mg 99.88%
CONCLUSION
Proposed study describes new HPLC method for the estimation of Vildagliptin in tablet formulation. The method was validated and found to be simple, sensitive, accurate and precise. Percentage of recovery shows that the method is free from interference of the excipients used in the formulation. Therefore the proposed method can be used for routine analysis of estimation of Vildagliptin in its tablet formulation.
REFERENCES
1. Thornberry NA and Gallwitz B. Mechanism of action of inhibitors of dipeptidyl-peptidase-4 (DPP-4). Best Practice and Research Clinical Endocrinology and Metabolism. 2009;23(4):479-486.
3. Lankas GR, Leiting B, Sinha Roy R and Eiermann GJ. Dipeptidyl peptidase IV inhibition for the treatment of type 2 diabetes potential importance of selectivity over dipeptidyl peptidases 8 and 9. Diabetes. 2005;54(10):2988-2994.
4. Weber AE. Dipeptidyl peptidase IV inhibitors for the treatment of diabetes. Journal of Medicinal Chemistry. 2004;47:4135-4141. 5. Mentlein R. Dipeptidyl-peptidase IV
(CD26)-role in the inactivation of regulatory peptides. Regulatory Peptides. 1999;85(1):9-24.
6. Moneeb MS. Spectrophotometric and spectrofluorimetric methods for the determination of Saxagliptin and Vildagliptin in bulk and pharmaceutical preparations. Bulletin of Faculty of Pharmacy. Cairo University. 2013;51(2):139-150.
7. Shrikrishna B, Mulgund SV and Ranpise NS. Simultaneous spectrophotometric estimation of Vildagliptin and Metformin in bulk and tablet dosage form. Der Pharma Chemica. 2013;5(1):24-27.
8. El-Bagary RI, Elkady EF and Ayoub BM. Spectrophotometric methods for the determination of Sitagliptin and Vildagliptin in bulk and dosage forms. International Journal of Biomedical Science. 2011;7(1):55-61.
9. Sultana R, Bachar SC and Rahman F. Development and validation of stability indicating assay method of Vildagliptin in bulk and dosage form by RP-HPLC. International Journal of Pharmacy and Life Sciences. 2013;4(4):2530-2534.
10. Aparajita M, Bishwajit B and Dilruba N. Development and validation of RP-HPLC method for estimation of Vildagliptin from tablet dosage form. International Journal of Pharmaceutical and Life Sciences. 2012;1(1):1-6.
11. Pharne AB, Santhakumari B, Ghemud AS, Jain HK and Kulkarni MJ. Bioanalytical method development and validation of Vildagliptin a novel dipeptidyl peptidase IV inhibitor by RP-HPLC method. International Journal of Pharmacy and Pharmaceutical Sciences. 2012;4(3):119-123.
12. Mohammad MAA, Elkadyb EF and Fouadb MA. Development and validation of a reversed‐phase column liquid chromatographic method for simultaneous determination of two novel gliptins in their
binary mixtures with Metformin. European Journal of Chemistry. 2012;3(2):152-155. 13. Varma PSRChNP, Lakshmana Rao A and Dinda
SC. Simultaneous determination of Metformin and Vildagliptin in solid dosage form by stability indicating RP-HPLC method. International Research Journal of Pharmacy. 2013;4(1):122-128.
14. Pushpalatha K and Ramachandran D. Method development and validation for the simultaneous estimation of Vildagliptin and Metformin in tablet dosage form by RP-HPLC. International Journal of Pharmacy and Pharmaceutical Sciences. 2013;5(1):459-463. 15. Santhosha B, Ravindranath A and Sundari CH.
Validated method for the simultaneous estimation of Metformin hydrochloride and Vildagliptin by RP-HPLC in bulk and the pharmaceutical dosage form. International Research Journal of Pharmaceutical and Applied Sciences. 2012;2(3):22-28.
16. Subhakar N, Krishna Reddy V and Ravindranadh Reddy T. Development and validation of RP-HPLC method for simultaneous determination of Vildagliptin and Metformin in bulk and formulation dosage. International Research Journal of Pharmaceutical and Applied Sciences. 2012;2(3):44-50.
17. Ishaq BM, Prakash KV and Mohan GK. RP-HPLC method for simultaneous estimation of Metformin and Vildagliptin in Bulk and its Tablet Formulation. Journal of Global Trends in Pharmaceutical Sciences. 2012;3(3):747-754.
18. Amanda TB, Barbara S, Schapoval EES and Steppe M. Stability-indicating RP-LC method for the determination of Vildagliptin and mass spectrometry detection for a main degradation product. Journal of Chromatographic Science. 2012;50(5):426-432.
19. Martín J, Buchberger W, Santos JL, Alonso E and Aparicio I. High-performance liquid chromatography quadrupole time-of-flight mass spectrometry method for the analysis of antidiabetic drugs in aqueous environmental samples. Journal of Chromatography B. 2012;895-896:94-101.