and Shinichi MORIYAMA
Japan Atomic Energy Agency, Naka, Ibaraki 311-0193, Japan
(Received 5 December 2008/Accepted 27 April 2009)
Electron cyclotron range of frequency system of the JT-60U finished operation at the end of August 2008, and improvements toward JT-60SA have been started. In the last two years stable gyrotron oscillation at an output power of 1.5 MW for 1 s was demonstrated, for the first time, using the 110 GHz gyrotron. It was verified that the heat load on the cavity was at an acceptable level with continuous oscillations at 1.5 MW. The absorption power of the collector was also at an acceptable level for the longer pulse oscillation of 5 s. A power modulation tech-nique based on anode voltage modulation was also developed in order to study the effects of modulated Electron Cyclotron Current Drive (ECCD) on Neoclassical Tearing Mode (NTM) stabilization. Modulation frequencies of up to 7 kHz were achieved at output power of 0.8 MW exceeding the previous limit of 3 kHz. Modulated ECCD experiments in synchronization with the NTM were successfully performed with a modulation frequency of around 5 kHz. Development of an accurate synchronization system played an essential role in the experiments that needed a maintained phase between the magnetic probe signal and modulated ECCD in real time. The re-sults provide significant information for further developments that will enhance the overall performance of ECRF systems in the near future.
c
2009 The Japan Society of Plasma Science and Nuclear Fusion Research
Keywords: electron cyclotron heating/current drive, high-power gyrotron, power modulation, neoclassical tear-ing mode, JT-60U
DOI: 10.1585/pfr.4.037
1. Introduction
Electron Cyclotron (EC) Heating and Current Drive (H/CD) using millimeter-waves would be capable of being a highly efficient and highly localized H/CD. At present plasma confining devices, such as JT-60U, DIII-D and ASDEX-U, EC Range of Frequency (ECRF) systems with mega-watt level of injection power have been installed [1–3]. The International Thermonuclear Experimental Re-actor (ITER) requires injection power of at least 20 MW for ECH/ECCD. The JT-60U ECRF system (3 MW for 5 s) commenced operating in 1999, enabling a number of experiments that include profile control, Neoclassical Tear-ing Mode (NTM) stabilization, plasma start up assistance, heat and momentum transport, and wall cleaning to take place. At the end of August 2008, the system completed operation as JT-60U [4]. Improving the JT-60U ECRF sys-tem has already been commenced in order to satisfy the requirements of JT-60SA (1 MW for 100 s per unit).
Over the last ten years R&D has been done on the sys-tem in order to enhance the ability of ECH/ECCD with
author’s e-mail: [email protected]
∗)This article is based on the invited talk at the 25th JSPF Annual Meeting
(2008, Utsunomiya).
in particular the developments of a high power gyrotron and power modulation technique having been successfully carried out over the past two years. Increasing the out-put power per gyrotron includes the advantages that higher power could be injected through the same injection port (at the torus) and that the cost and time needed for fabrica-tion, installation and maintenance could be reduced. How-ever, the output power of a gyrotron has been limited to around 1 MW, except for oscillations with a pulse length of 100 ms or less at 1.5 MW or more. The present experi-ments require pulse duration of at least 1 s. Therefore the development of a high power gyrotron incorporating long pulse capability is an essential issue in order to expand the ability of ECH/ECCD.
Suppression of the NTM is also an important role of ECH/ECCD. Theoretical and simulated results reveal that modulated ECCD in only the magnetic island has the ad-vantage of NTM suppression efficiency compared with that by unmodulated ECCD. However, the effect had not been well confirmed experimentally. In order to study the effect of modulated ECCD in high performance plasmas, such as that in JT-60U, a power modulation technique with a gyrotron of mega-watt power level and a technique of
syn-c
2009 The Japan Society of Plasma
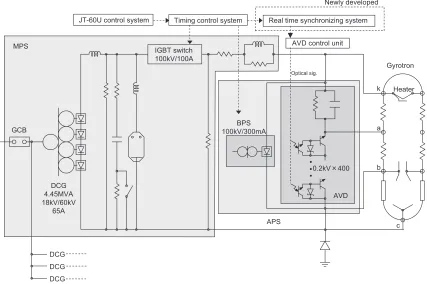
Fig. 1 Schematic view of the power supply and gyrotron. A DC generator (DCG) and an Insulated Gate Bipolar Transistor (IGBT) switch is used for each gyrotron as a Main Power Supply (MPS). The DCG converts AC voltage of 18 kV from the motor generator to DC voltage of∼60 kV at up to 65 A. The IGBT switch turns the DC voltage between the cathode and the collector,Vk, on and offin accordance to a timing signal from the timing control system. The Body Power Supply (BPS) is connected to the cathode in order to maintain an acceleration voltage (Vacc) of∼80 kV independent ofVk. The Anode Voltage Divider (AVD) controls the voltage between the anode and the body (Vab).Vabof up to 20 kV can be maintained during an oscillation with resolution of 0.2 kV using the AVD controller with an optical signal.
chronizing it with NTM have needed to be developed. This paper provides the recent results of the develop-ment of a high power gyrotron and a technique of power modulation that have been carried out using the JT-60U ECRF system to enhance the ability of the ECRF system. The following section describes the system configuration of the JT-60U ECRF system. The high power gyrotron developments using one of the JT-60U gyrotrons is then described in Sec. 3. The results of developments of modu-lated ECCD and remodu-lated issues are described in Sec. 4. Sec-tion 5 gives a summary and prospects with further devel-opments.
2. The JT-60U ECRF System
The JT-60U ECRF system consists of four units of power supplies, 1 MW gyrotrons at 110 GHz, evacuated transmission lines with a φ31.75 mm circular corrugated waveguide, and two antennas that can control the beam injection angle into the plasma [1]. Its transmission effi -ciency, including a matching optics unit, is around 75%. The specified maximum injection power into plasma is 3 MW at a pulse length of 5 s.
Figure 1 gives a schematic view of the power supply,
and includes the gyrotron. In this paper k, a, b and c will be used to represent the cathode, anode, body and collec-tor in the gyrotron, respectively. The Main Power Sup-ply (MPS) provides a beam current of up to 65 A with a cathode voltage (Vk) of 55 to 60 kV. The electron beam is
turned on or offusing an Insulated Gate Bipolar Transis-tor (IGBT) switch within 10µs. The MPS was originally designed for a lower-hybrid CD system and hence the volt-age ripple of theVk is relatively large for stable gyrotron
oscillation. A highly stabilized Body Power Supply (BPS) therefore provides acceleration voltage (Vacc) between the
cathode and the body as the Collector Potential Depres-sion (CPD) operation. The design specifications of the BPS voltage, voltage ripple and current are a maximum of 100 kV, 0.5 kV and 300 mA, respectively. With normal gyrotron operations the Vacc is around 80 kV. Here, the
CPD voltage (VCPD) is given byVCPD =Vacc−Vk, which
is 20 to 30 kV. JT-60U gyrotrons have a triode type Mag-netron Injection Gun (MIG), and therefore has an Anode Voltage Divider (AVD) between the body electrode and the anode electrode in order to maintain a suitable pitch factor for the electron beam. The AVD consists of four hundred Zener diodes in series, with up to 80 kV ofVabbeing
lowed the time averaged output power to be calorimetri-cally measured while also taking into account transmission efficiency.
3. High Power Gyrotron
3.1
Demonstration of 1.5 MW oscillation
Essential issues with high power gyrotron develop-ments include stability of oscillation and the capability of the cavity, collector and other components to withstand the heat load. The time scale with NTM suppression and other plasma behavior in the present experiments ranged from several hundreds of milliseconds to several seconds, thus requiring a gyrotron oscillation with pulse length of at least 1 s. In the frequency range between 28 GHz and 170 GHz gyrotron output power of around 1.5 MW has only been demonstrated in the short pulse region, of 100 ms or less, in showing that high power oscillation was possible. However, space charge neutralization due to ion trapping changes theVaccduring the pulse until 100 ms, orsometimes until 1 s, resulting in the oscillation conditions changing. In addition, the cavity radius expands until the heat flux removed by the cooling water reaches the same level as the heat flux due to ohmic loss in the cavity. This expansion also leads to the oscillation conditions changing. Typically, a frequency shift is observed in the initial several hundred milliseconds, which results from the change in os-cillation conditions due to the cavity expansion, therefore making the demonstration of stable oscillation with pulse length over 1 s important in verifying the stability of the gyrotron oscillation.
In 2007 a 1.5 MW oscillation for 1 s was demon-strated, for the first time, using the JT-60U ECRF system with an improved 110 GHz gyrotron [5]. Usually the leak current at the anode,Ia, is kept low atIa<10 mA, in
ob-taining stable oscillation. However, the highest efficiency is obtained at relatively high Ia as described in Ref. [6].
When operating with a high beam current,Ic, there is a
pos-sibility of theIaovercurrent failing due to increase in the
low quality electron beam component. The above demon-stration clarified that Ia to be stable between 10 mA and
20 mA, even whenIc > 60 A. It was also shown
exper-imentally that the effect of the change in the oscillation condition due to space charge neutralization is sufficiently small to allow a 1.5 MW oscillation. And although the JT-60U ECRF system power supply was used, resulting in
at 1.5 MW.
3.2.1 Cavity
Figure 2 gives the cavity temperature with two individual oscillations at 1.5 MW over time, with each of the gyrotron oscillations having been carried out on different days. The sampling time with the thermocouple, which was installed behind the cavity, was 100 ms, resulting in the uncertainty of the measuring time. However apart from that uncer-tainty the behavior of the temperature increasing with the oscillations was basically the same with good reproducibil-ity being confirmed. A maximum temperature of∼140◦C was observed ∼0.5 s of the beginning of the oscillation. If the cooling water boils an inter-lock takes place due to water-flow decreasing. However, the pressure of the cool-ing water of the cavity was estimated to around 0.48 MPa resulting in the boiling temperature of∼150◦C, and there-fore no boiling was observed. Figure 3 gives the depen-dence of the temperature rise of the cavity (ΔT) on the power where almost linear dependence of theΔT on the output power can be observed. Since the boiling of the cooling water causes the heat transfer coefficient between the cooling water and the cavity to change this also sup-ports that no boiling takes place.
The results thus show that continuous operation with output power of 1.5 MW is possible using the present
cav-Fig. 2 The cavity temperature measured by a thermocouple with a 1.5 MW oscillation and pulse duration of 1 s on different two days (closed and open circles) over time. The sam-pling time of the cavity temperature was slow at 100 ms. The saturation temperature of ∼140◦C was observed at
Fig. 3 Power dependence of the cavity saturation temperature. Almost linear dependence is observed. It is thought that the cooling water did not reach boiling point because if the cooling water had of boiled the heat removable prop-erties would have changed.
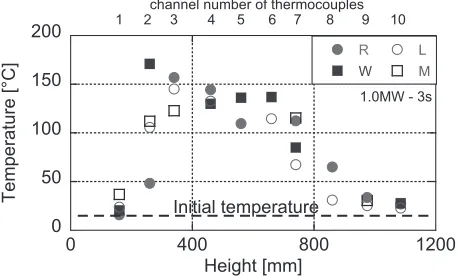
Fig. 4 Collector temperature distribution measured by thermo-couples at 1.0 MW for 3 s oscillation. The thermothermo-couples are set in position of the right hand side (R), left hand side (L), output window side (W) and the opposite side (M). The number of thermocouples differs on each side.
ity with a TE22,6 oscillation mode from the viewpoint of
the cavity heat load. However, because the cavity tem-perature was close to boiling temtem-perature at 1.5 MW, with higher order oscillation modes such as TE22,8 or higher,
will be required to achieve the higher power of∼2 MW. The heat load of the gyrotron cavity is roughly proportional to 1/(χ2
mn−m2) whereχmnisn-th root of the derivative of
am-th order Bessel function. The TE22,6 (χ22,6 = 45.6)
factor is about 1.4 times higher than that of the TE22,8
(χ22,8=52.7).
3.2.2 Collector
In the previous experiment the collector temperature was only measured at one place (the middle part of the collec-tor, labeled R5) given in Fig. 4 in Ref. [5]. The measured collector temperature did not saturate within 1 s.
In order to investigate long pulse capability from the viewpoint of the collector heat load, detailed mea-surements of the collector temperature distribution at
Fig. 5 Measured collector temperatures with a 0.4 MW oscilla-tion for 15 s over time.
∼1.5 MW,∼1.0 MW and∼0.5 MW were carried out. The sweeping frequency of the collector sweeping coil was 1.7 Hz with a triangular waveform. The low sweeping fre-quency causes slightly different temperature distributions every time until the temperature saturated. However, the tendency with the temperature distribution was almost the same in every oscillation and had no power dependence. Figure 4 gives an example of an oscillation at 1.0 MW for 3 s, where, R, L, W and M refer to the right hand side, left hand side, output window side and opposite side of the output window, respectively, and the degree of tilt of the magnetic axis in the gyrotron can be seen to be sufficiently small. The highest temperature was observed ∼300 mm from the bottom of the collector, or more specifically chan-nel 2 or 3 of the thermocouples, and representing the turn-ing point of the swept electron beam. The distribution is consistent with what was expected.
A long pulse experiment was also carried out in or-der to investigate the saturation time of the collector tem-perature with the relatively low power of 0.4 MW for the sake of safety. It should be mentioned that an oscillation of 0.5 MW for 30 s had already been successfully achieved with no problems with the collector [4]. Figure 5 gives the measured temperatures at R3, L3, M3 and W2, respec-tively, over time, where it can be observed that the collector temperature saturated∼10 s from the start of the oscilla-tion. The measured saturation temperatures were 160 to 190◦C. In this case, the power injected into the gyrotron,
Vk×Ic, was ∼1.9 MW at the end of the pulse. A rough
estimate was made that∼1.5 MW of power had been ab-sorbed on the collector, assuming the oscillation power to be constant and the power of the stray RF relatively low: less than 100 kW and due to low oscillation power. The absorbed amount of power was also confirmed by evaluat-ing the increasevaluat-ing of the coolevaluat-ing water temperature of the collector when it had saturated.
This then reveals that the pulse length of a 1.5 MW oscillation to be capable of being increased to 5 s or more from the viewpoint of the collector heat load as well as the cavity heat load.
4. Power Modulation Technique
One of the important roles of ECH/ECCD is NTM suppression [8, 9]. Theoretical and simulated studies re-vealed that power modulated ECCD increases the effi-ciency of NTM suppression when compared to unmod-ulated ECCD. Discussions were being made on whether to use modulated ECCD with a frequency up to 5 kHz in ITER. Previous modulated ECCD experiments had been performed in tokamaks such as JFT-2M [10] and ASDEX-U [11, 12]. However, the effects of modulation and phas-ing on NTM suppression have not been fully understood experimentally, especially for m/n = 2/1 NTM. Here mand n denote the poloidal mode number and toroidal mode number, respectively. A power modulation tech-nique with the gyrotron oscillation and a techtech-nique of syn-chronizing the NTM needed developing for that reason. The JT-60U experiment requires a modulation frequency of around 5 kHz at the mega-watt power level.
4.1
Anode voltage modulation
Several power modulation methods have been devel-oped and can be classified into three cases according to the power supply used for modulation, and (i) a MPS, (ii) BPS, or (iii) AVD (or anode power supply) has been used as a modulator in each case. Gyrotrons with a diode type MIG and without CPD do not have a BPS and AVD, and therefore only the MPS can be modulated using such gy-rotrons. When using a CPD gyrotron there are two ways of configuring the BPS. One is used on the JT-60U ECRF system given in Fig. 1, where the BPS provides the volt-age between the cathode and the body at a voltvolt-age of 70 to 90 kV, while the other is given in Ref. [13], and wherein the BPS provides the voltage between the body and the collec-tor at the voltage of 20 to 40 kV. In both cases the BPS can be used as a modulator by whichVacc is modulated with
decreasingVCPD. In the former case the MPS is
unavail-able for modulation because the acceleration voltage is not changed with modulating the MPS. While with the latter configuration, the MPS can be used as a modulator and it has the advantage of reducing collector heat load. The
an-eral mega-watt ECCD power and gyrotrons incorporating CPD technology will need to be used. However, the power modulation of a CPD gyrotron at a frequency of more than 5 kHz had not been adequately achieved. Reference [13] refers to a modulation frequency of 50 kHz being achieved by modulating the MPS with an output power of 0.8 MW that was decreased to 0.1 MW through modulation. This modulation technique, however, has the disadvantage of requiring expensive regulated power supplies for both the MPS and the BPS, as described in Ref. [13]. In addition, if the MPS is shared by a number of gyrotrons, they all then get modulated simultaneously. A modulation using the BPS was also demonstrated in Ref. [13] at the same output power and modulation depth. However, the mod-ulation frequency was limited to up to 1.5 kHz due to the slow response time of the power supply. An anode voltage modulation technique has been developed with the JT-60U ECRF system. Power modulated ECH at low frequency, less than 1 kHz, was carried out in investigating heat trans-port [14]. However, the modulation frequency was limited to 3 kHz.
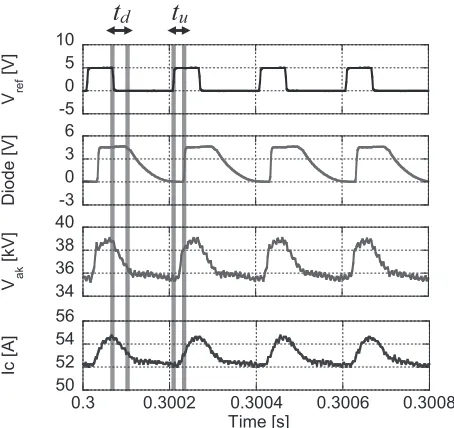
In order to achieve the higher modulation frequency of 5 kHz using the anode voltage modulation technique some improvements were made to one of the ECRF units (#3). Since the photo-couplers used in the AVD limited the response time of the anode voltage, they were replaced by Field Effect Transistors (FETs). Confirmed was made that the FET could be used at a modulation frequency of over 10 kHz. In addition, the resistance and capaci-tance of the BPS and AVD circuit were modified in obtain-ing a shorter response time and to reduce the peak charg-ing/discharging current at the electrodes. By adjusting the operating parameters of the gyrotron, a modulation fre-quency of 7 kHz with an output power of 0.8 MW was suc-cessfully achieved, exceeding the previous limit of 3 kHz. Figure 6 gives an example waveform at 5 kHz modulation with the dummy load system. In this case the phase and duty cycle were not controlled in real-time, as described in the following subsection. Typically, modulated voltage be-tween the anode and the body isΔVab=3 to 4 kV.
Fig. 6 An example of a 5 kHz modulation test.Vref, Diode,Vak
andIcrefer to the signals produced by the function gener-ator, the diode signal corresponding to the output power, the voltage between anode and cathode and the beam cur-rent, respectively. Severalµs of delay time in the oscilla-tion stop phase,td, and the oscillation start phase,tu, were observed.
4.2
Synchronizing system
From the technical side there were difficulties with achieving accurately phased modulation synchronized with the NTM as well as obtaining a higher modulation fre-quency. For instance, a delay time of 20 to 50µs can be ne-glected when the modulation frequency is less than 1 kHz, which corresponds to 1 ms per cycle. However, it cannot be neglected in studying the effect of phasing in NTM sup-pression experiments at a frequency of 5 kHz, which corre-sponds to 200µs per cycle, therefore making it worthwhile providing details of those difficulties and an example of the real-time synchronizing system newly developed using the JT-60U ECRF system. Some of the following techni-cal difficulties are common to other modulation techniques too.
Modulation frequency fmod can be controlled using
measured frequencyfmeas, obtained in a real-time
measure-ment. However, even with slight measurement errors of Δf = fmeas− f ∼0.1 kHz, the errors that accumulate
dur-ing lots of pulses result in a significant phase error. Here,f
is the exact value of the NTM frequency. The phase error per cycle can be simply described using:
ΔΦ=360◦×
1
f + Δf −
1
f
f
=360◦×
1 1+ Δf/f −1
. (1)
The phase error duringN-th pulses is therefore: ΔΦN =
N×ΔΦ. (2)
Fig. 7 Duty cycle of modulated oscillation evaluated using the diode signal. The duty cycle varied from 0.5 to 0.35 without the real-time synchronizing system (without RS). Conversely the duty cycle was maintained to 0.5 with the system (with RS).
For instance, f = 5 kHz, fmeas = 5.1 kHz results in
ΔΦN ∼ −
7◦ × N, where the minus sign means that the phase of the modulation is faster than that of the NTM signal. And even if real-time control is achieved within 1 msNreaches five and thusΔΦN∼ −35◦, therefore mak-ing it necessary that the modulation frequency is not con-trolled by the measured frequency. By producing each of the modulation signals with respect to each cycle of the NTM the aforementioned accumulation can then be elim-inated. However, as f varies with the rotation velocity of the target plasma the frequency has to be measured in maintaining the duty cycle and phase.
In addition, other difficulties exist with maintaining the duty cycle and phase, even iff is constant, and the fre-quency measurement dose provide the correct value. In the modulation test described in Fig. 6 a modulation signal of a rectangular waveform at a constant frequency (5 kHz) and constant duty cycle (on: off =0.3: 0.7),Vref, was provided
by the Function Generator (FG) as a reference for the mod-ulation timing. In Fig. 6, the delay time of the diode signal, which corresponds to the oscillated power, is revealed re-spect to the modulation signal. It was found that the delay time in the oscillation start phase (tu) and the delay time
in the oscillation termination phase (td) have different time
constants, withtdbeing typically larger thantu. Moreover,
the delay times were seen to vary during an oscillation. An example of the duty cycle of the diode signal with a mod-ulated oscillation at 5 kHz is provided in Fig. 7 (without RS). In this case, although the duty cycle ofVrefwas
ad-justed in order to obtain the duty cycle of the diode signal of 0.5 at the start of the modulation, the duty cycle of the diode signal decreased from 0.5 to 0.35 during the oscilla-tion. Those effects cause variations in the phase and duty cycle during an oscillation, thus reducing the effective in-jection power into the magnetic island, which then causes difficulty with studying the effect of modulated ECCD in NTM stabilization.
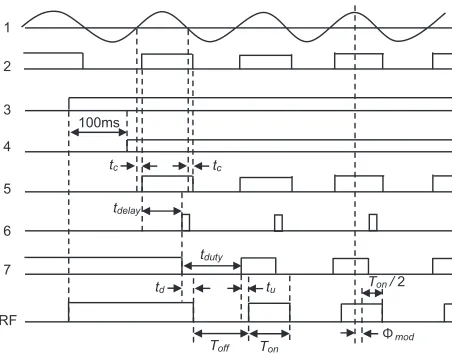
Fig. 8 Schematic view of the newly developed synchronization system. Set values for FG-B are controlled every 50 ms using a PC according to the measured frequency obtained by a digital frequency counter every 20 ms. The phase and duty are preset using the control software on a PC.
Fig. 9 Timing chart of the modulation signals. The numbers on the left hand side correspond to the numbers given in Fig. 8 while RF corresponds to the expected oscillation timing of the gyrotron.
Figure 8 gives a schematic diagram of the system while Fig. 9 gives a timing chart of the control signals. To refer-ence the NTM rotation a magnetic probe signal is used. A TTL level signal is produced if the probe signal is beyond the threshold (0 V). The TTL signal is used in two ways: measuring the NTM frequency for maintaining the phase and duty cycle, and providing the accurate modulation cy-cle. With the former the signal is enumerated using digital frequency counter at 10 ms of bandwidth, thus providing
±0.1 kHz of frequency resolution every 20 ms. With the latter the signal is used to trigger one of the FG channels (FG-B1). The response time of the threshold circuit causes a little delay time (tc). The FG-B1 then produces the other
TTL level signal that includes the delay time oftdelay. The
pulse duration of the signal is sufficiently short (<10µs) for the FG-B1 to ready the next trigger signal. In principle the number of generated modulation pulses is exactly the same as that of the NTM enables the accumulated phase
error to be eliminated. The TTL pulse produced by the FG-B1 is used to trigger the other FG-B channel (FG-B2). A single modulation pulse for the AVD control unit is then produced by the FG-B2 at a duty cycle oftduty. In order
to obtain the target values of the phase (Φs) and duty cycle (Rs: 0∼1),tdelayandtduty, used in setting the FGs values,
are determined using the following procedure with control software on a PC. The RF power decreases/increases at
Td/Tu, which can be described as follows:
Td=tc+tdelay+td+(Δtc+ Δtd), (3)
Tu=tc+tdelay+tduty+tu+(Δtc+ Δtu). (4)
Wheret=0 denotes when the magnetic probe signal passes beyond the threshold,tc,tdandtuare assumed to have been
experimentally evaluated beforehand,Δtc,ΔtdandΔtuare
the calibration errors fortc,tdandtu, respectively. IfΔtc=
Δtd= Δtu=0 is assumedtdutyandtdelaycan be obtained as
follows:
tduty=
1
fmeas
(1−Rs)+td−tu, (5)
tdelay=
Φs+180◦ 360◦ +
1 2Rs
1
fmeas −
(tc+td). (6)
However, it does include some experimental errors, and therefore the practical duration of the oscillation interrup-tion obtained in experiments,Toff, is expressed as:
Toff =Tu−Td
= 1
fmeas
(1−Rs)+(Δtu−Δtd). (7)
The practical oscillating duration,Ton, is expressed as:
Ton =
1
f −Toff
= 1
f −
1
fmeas
(1−Rs)−(Δtu−Δtd). (8)
Φsdue to the experimental errors.
Rmod=
Ton
Ton+Toff
=Rs+Δ
f
f (Rs−1)−f(Δtu−Δtd). (9)
Φmod=Φs− Δf
fmeas
(Φs+270◦) +f
Δtc+
1
2(Δtd+ Δtu)
×360◦. (10)
Because of the slow change in rotation velocity of plasmas up to±2 kHz/s, real-time control every 50 ms by the PC results in a maximum error of±0.1 kHz/s. Hence the system can provide fmeas with a maximum error of ±0.2 kHz just before the frequency is adjusted taking the frequency resolution of the measurement into account. But because the typical time scale with the change in NTM fre-quency experimentally was much longer than the renewal interval of the system the frequency can be measured more accurately, at typically less than 0.1 kHz.
In Fig. 7 also provides an example of duty cycle con-trol using this system, which is labeled RS. The delay times oftc,tu andtd were calibrated before the experiment. In
this case the sinusoidal signal was produced using the FG rather than the NTM signal. The duty cycle given in Fig. 7 was obtained by evaluating the time at which the practical diode signal exceeded the threshold and when the signal fell below the threshold. The sampling time of the diode signal was 1µs, which corresponds to a resolution of the duty cycle of 0.005 at 5 kHz modulation. Figure 10 pro-vides histograms of the duty cycle with oscillations both
Fig. 10 Histogram of the duty cycles given in Fig. 7. The mean value and standard deviation with each histogram were 0.43 and 0.032 for without RS, and 0.51 and 0.013 for with RS, respectively.
with RS and without RS. The mean value and standard de-viation of each histogram are 0.43 and 0.032 for without RS, and 0.51 and 0.013 for with RS, respectively. The dis-tribution of the duty cycle is not a normal disdis-tribution, and hence the standard deviation does not simply express the duty control error and is just a measure of dispersion. The real-time synchronizing system did at least work well with the sinusoidal signal produced by the FG.
4.3
Modulated ECCD experiments with
NTM stabilization
Using the newly developed modulated ECCD system experiments that aiming to clarify the effect of modulation and phasing onm/n=2/1 NTM suppression were carried
out in JT-60U in 2008. In order to demonstrate the effec-tiveness of the system a modulated EC-wave was injected into a plasma where the rotation velocity of the plasma var-ied due to change in combination of the neutral beams.Φs andRswere set to be 0◦and 0.5, respectively. In this case
f increased from 4.3 kHz to 6.1 kHz during the modulated ECCD. Figure 11 gives the NTM frequency obtained us-ing the fast Fourier transformation of the magnetic probe signal, the diode signal corresponding to the output power, the phase difference between the probe signal and the diode
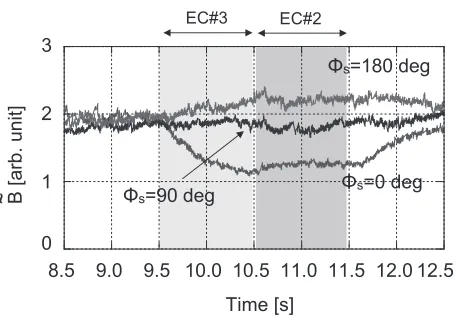
Fig. 12 Effect of phase controlled modulated ECCD. Stabiliza-tion and destabilizaStabiliza-tion of the mode amplitude can be clearly observed.
signal, and the duty cycle evaluated using the diode sig-nal, all over time. As expected the phase and duty cycle could be correctly controlled atΦmod∼0◦andRmod∼0.5.
Since the real-time synchronization system could not pro-duce a modulation signal when the mode was too small, the system terminated the gyrotron oscillation att ∼ 10.3 s.
However, once the NTM decay falls below the threshold corresponding to a marginal island width (Wmarg) the NTM
starts spontaneously decaying. As described in Ref. [15],
Wsat/Wmarghas a value of around 2 with a typical target
plasma with m/n = 2/1 NTM in JT-60U, where Wsat is
the island width when the NTM is saturated before ECCD. Therefore, and in this case,m/n = 2/1 NTM was
com-pletely stabilized att ∼ 10.4 s.
Experiments were then performed with different phases for each plasma discharge. Figure 12 gives one of the clear effects of phasing. In those plasma discharges the discharge scenarios were fixed and the plasma parameters basically the same. The difference, therefore, in the fluc-tuation amplitude results from the phasing. Stabilization and destabilization atΦs=0◦andΦs =180◦were clearly observed.
The details of other experiments and discussions can be found in Ref. [16]. Use of the power modulation tech-nique described in this paper clarified the following. The effect of the phase difference on NTM stabilization was found experimentally consistent with a theoretical model of ECCD efficiency. In addition, comparing the decay time of the mode amplitude during modulated ECCD with that during unmodulated ECCD at the same power, it was found that modulated ECCD is at least twice as effective as unmodulated ECCD.
5. Summary and Further
Develop-ments
The developments of a high power gyrotron and a power modulation technique took place using the
JT-the temperature of JT-the cavity and JT-the collector revealed that it would be possible to operate the gyrotron with an output power of 1.5 MW for 5 s or more from the viewpoint of heat load on the cavity and the collector.
In addition, a power modulation technique utilizing anode voltage control was developed. The high frequency of 7 kHz exceeding the requirements of JT-60U and also ITER, was successfully achieved at an output power of 0.8 MW. In order to allow synchronization with the NTM a real-time synchronizing system was newly developed, which worked well. It was shown that modulated ECCD more effectively suppressesm/n = 2/1 NTM when
com-pared with unmodulated ECCD, and clarified that phase control is important.
A further development will be minimizing stray RFs in the gyrotrons. The JT-60U gyrotrons used at present have a mode converter that consists of a launcher and phase collection mirrors. However, the mode converter is of low efficiency, therefore making the heating of the in-ternal components by stray RFs a critical issue with long pulse operation. In R&D on 170 GHz gyrotrons for use in ITER at Japan Atomic Energy Agency a newly designed mode converter played a significant role in long pulse oper-ation [6, 17]. Improving the mode converter of the JT-60U gyrotron has already started with the aim of 1 MW with a 100 s oscillation that is needed by JT-60SA. The expecta-tion is that the improvement will also prove effective with a long pulse oscillation of 1.5 MW because of reduced heat load on the collector and less stray RFs. The waveform of the current of the collector sweeping coil should also be optimized more.
At present the pulse length of modulated ECCD per gyrotron is limited to 1 s due to abnormal heating of the launcher in the gyrotron. It is thought that undesired os-cillation occurs at the launcher when the osos-cillation of the primary mode at the cavity is terminated. However, an-other expectation is that the improved launcher will reduce this kind of undesired oscillation, therefore enabling the pulse duration of modulated ECCD to be expanded to a pulse duration limited by the heat load of the collector.
For synchronizing with the NTM, pre-processing of the reference signal of the NTM which is a magnetic probe signal in our case will be required. Ifm/n = 3/2 NTM
occurs the magnetic probe provides fluctuations from the NTM of both m/n = 2/1 and 3/2. The signal from
decreased by modulated ECCD. Edge Localized Mode (ELM) also provides an irregular signal for use with the magnetic probe. In those cases, accurate control of the phase is difficult. And therefore ideas on filtering or us-ing ECE diagnostics as a reference signal will be required for NTM suppression using modulated ECCD in ITER and other devices.
Acknowledgements
The authors would like to express their appreciations to Dr. T. Fujii for his continuous contribution to developing the RF-Heating system used in JT-60U. They also would like to thank the members of the JT-60U team for their help and the wonderful experiments that took place in JT-60U.
[1] Y. Ikedaet al., Fusion Sci. Technol.42, 436 (2002). [2] D. Ponceet al., Fusion Eng. Des.66-68, 521 (2003).
[3] F. Leutereret al., Nucl. Fusion43, 1329 (2003).
[4] S. Moriyama et al., Proc. 22nd IAEA FEC, IAEA-CN-165/FT/P2-26 (2008).
[5] T. Kobayashiet al., Plasma. Fusion Res.3, 014 (2008). [6] K. Sakamotoet al., Nature Phys.3, 411 (2007). [7] K. Sakamotoet al., Nucl. Fusion43, 729 (2003). [8] A. Isayamaet al., Nucl. Fusion43, 1272 (2003). [9] H. Zohmet al., Nucl. Fusion47, 228 (2007).
[10] K. Hoshino et al., Proc. of IAEA-CN-60/A3/A5-P1, Seville, 26 Sep. - 1 Oct. (1994).
[11] H. Zohmet al., Nucl. Fusion39, 577 (1999).
[12] M. Marascheket al., Phys. Rev. Lett.98, 025005 (2007). [13] G. Dammertzet al., Fusion Eng. Des.66-68, 497 (2003). [14] T. Fujiiet al., Journal of Phys. Conference Series25, 45
(2005).
[15] A. Isayama et al., Proc. 22nd IAEA FEC, IAEA-CN-165/EX/5-4 (2008).