An Unsupervised Approach of Knowledge Discovery
from Big Data in Social Network
Mohiuddin Ahmed
∗1Canberra Institute of Technology, Australia
Abstract
Social network is a common source of big data. It is becoming increasingly difficult to understand what is
happening in the network due to the volume. To gain meaningful information or identifying the underlying patterns from social networks, summarization is an useful approach to enhance understanding of the pattern from big data. However, existing clustering and frequent item-set based summarization techniques lack the ability to produce meaningful summary and fails to represent the underlying data pattern. In this paper, the effectiveness co-clustering is explored to create meaningful summary of social network data such as Twitter.
Experimental results show that, using co-clustering for creating summary provides significant benefit over the existing techniques.
Receivedon 13 March 2017;acceptedon 25 July 2017;publishedon 25 September 2017
Keywords: Social Networks, Data Summarization, Co-clustering
Copyright© 2017 Mohiuddin Ahmed,licensedto EAI.This isanopen accessarticledistributedunderthe termsofthe Creative Commons Attribution license (http://creativecommons.org/licenses/by/3.0/),which permits unlimited use,distributionandreproductioninanymediumsolongastheoriginalworkisproperlycited.
doi:10.4108/eai.25-9-2017.153148
1.
Introduction
In today’s high speed internetworking environment, social networks have become a part of our daily life. Apart from email, social networks are also used heavily for communication. As a result, social networks produce a huge amount of network traffic every single moment. For example, netflow data describes network traffic with a set of records, where each record has different attributes (such as IP, port, bytes transferred etc.). The network analyst has to monitor a huge volume of netflow data. Social media sites i.e.Twitteris ranked as one of the ten-most-visited websites worldwide by Alexa’s web traffic analysis[1]. Additionally, internet security is an important concern now-a-days since Twitter was compromised for several hours in 2009 due to cyber attack[2]. Thus it is becoming increasingly challenging for the network managers to understand the nature of traffic that is carried in their network [3– 8].
A major problem for traffic analysis is to find out a way to extract a concise yet accurate summary of the relevant traffic flows that are present in network
∗Corresponding author. Email:[email protected]
traces. There is a significant interest in the data mining and network management communities about the data summarization. Summarization is a common and powerful though often time-consuming approach to analyse large datasets [9–11]. In the scope of this paper, we will consider social network traffic data
1.1.
Contributions of the Paper
In this paper, being encouraged by a set of emerging data mining techniques the data summarization problem is solved. Co-clustering is a class of data mining techniques which can find subsets of rows and columns simultaneously [12, 13]. We utilize this advantage of co-clustering for data summarization and representing the original data in a meaningful way. We used the Twitter network traffic instances from UCI machine learning repository[14] and show that our proposed approach is capable of creating a better summary than the existing techniques, such as clustering, frequent itemset.
Research Article
1.2.
Roadmap
The roadmap of this paper is as follows. In Section 2, we discuss the existing techniques of data summarization with example and highlight the drawbacks. Section 3 includes the basics of co-clustering algorithms used in this paper followed by our proposed approach in Section 4. Experimental results are included in Section 5 and we conclude the paper in Section 6.
2.
Background and Related Works
Summarization can be viewed as reducing a given set of transactions into a smaller set of patterns while retaining the maximum possible information. A summary is considered good when it is small but retains enough information about the assigned data. Definition of a summary can be given as follows:
A summary S of a set of transaction T is a set of individual summaries (S1, S2, Sl) such that (i) each Sj
represents a subset of T and (ii) every transaction Ti∈ T is represented by at least oneSj ∈S. Each individual
summarySj essentially covers a set of transactions. In
the summary S, these transactions are replaced by the individual summary that covers them.
Most frequently used metrics for evaluating summary are compaction gain and information loss. Compaction gain signifies the amount of reduction done in the transformation from actual data to a summary. Information loss is defined as the total amount of information missing over all original data. In this paper, we will also investigate whether summarization can represent the underlying pattern or not. Clustering, which groups together similar data instances is used to create summary by considering the centroids of each cluster as the representatives. However, the underlying data pattern can be hardly represented using this method. Frequent itemset based summarization fails to portray all the attributes of the data and hence incurs information loss.
For data summarization, clustering algorithms such as k-means have been used the following basic definition.
Definition 1: ‘Once the dataset is clustered, the cluster
centroids are used to form the summary of the original dataset’.
The basick-means algorithm has been widely used for this type of semantic summarization [15–18]. However, we give an example here to demonstrate howk-means
algorithm fails to provide an appropriate summary.
We took a sample Twitter data[14] and when the centroid is calculated it is seen that the summary produced rarely represent the original data. Table
Table 1. Sample network traffic from Twitter data*
NCD-0 NCD-1 NCD-2 NCD-3 NCD-4 NCD-5 NCD-6
889 939 960 805 805 1143 1121
542 473 504 626 647 795 832
92 99 196 100 184 79 162
90 87 92 344 184 848 184
169 98 101 90 96 95 185
775 765 935 806 912 1095 1198
469 1092 332 354 357 676 1189
818 693 756 1099 877 871 1409
832 628 898 944 993 983 1037
920 1071 833 662 851 1096 1067
*For simplicity and space, we include only one class of attributes out of 11 different types. This table contains
the data from number of created discussions(NCD)
Table 2. Summary of the dataset in Table 1 according to
Definition 1
NCD-0 NCD-1 NCD-2 NCD-3 NCD-4 NCD-5 NCD-6
559.6 594.5 560.7 583 590.6 768.1 838.4
2 displays the summary of the dataset of Table 1 according to the Definition 1 stated above. Here the summary is the mean or the average of the data instances which is not an actual member of the cluster and the summary hardly represents the original dataset. Additionally, the categorical data cannot be handled using the Definition 1. Also the number of clusters needs to be provided as an input of the algorithm and without having previous knowledge on the dataset, finding the optimal number of cluster is hardly possible.
Next, we discuss about the feature-wise intersection used to define a summary [19, 20]. The most recent paper on network traffic monitoring [20], which is a modified version of [19], characterized a summary as a compressed version of a set of given transactions. According to Chandola et al [19], the definition of a summary as
follows-Definition 2: ‘A summary S of a set of transactions
T, is a set of individual summaries S1, S2, ...Sl such
that (i) each Sj represents a subset of T and (ii)every
transactionTi ∈ T is represented by at least oneSj ∈ S.
An individual summary will be treated as a feature-wise intersection of all transactions covered by it, i.e., if Sj
coversT1, T2, ..., Tk, thenSj =Tki=1Ti.’
co-clustering and a new algorithm to address the problems of the existing definitions (next section).
Table 3. Summary of the dataset in Table I according to
Definition 2
NCD-0 NCD-1 NCD-2 NCD-3 NCD-4 NCD-5 NCD-6
* * * * * * *
3.
Co-clustering
Co-clustering can be simply considered as a simultane-ous clustering of both rows and columns. Co-clustering can produce a set of column clusters of the original columns and a set of row clusters of original row instances [23–26]. Like other clustering algorithms, co-clustering also defines a co-clustering criterion and then optimizes it. In other words, co-clustering finds out the subsets of rows and columns of a dataset simultane-ously using a specified criterion. A conceptual view of co-clustering is shown in Figure 1 and it can be clearly seen that co-clustering is able to create a cluster for the snake and insect in two different clusters. Next, two different types of co-clustering is briefly discussed.
• Block Co-clustering: Govaert and Nadif et
al[26] proposed a probabilistic framework for model based co-clustering. The backbone of their proposed block co-clustering is latent block model. This model is based on the conditional independence and independent latent variables.
• Information Theoretic Co-clustering: Banerjee
et al[25] proposed information theoretic co-clustering based on Bregman Divergence. It tries to minimize the information loss in the approximation of a data matrix, in terms of a predefined bregman divergence function. For a given co-clustering and a matrix approximation scheme, a class of random variables which store the characteristics of data matrix is defined. The objective function tries to minimize the information loss on the approximation for a co-clustering.
4.
Proposed Summarization Algorithm
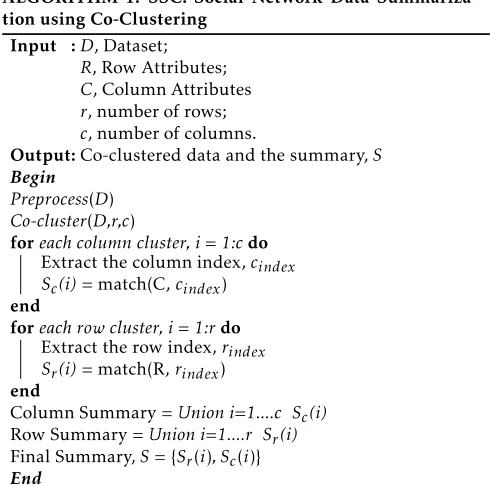
In this section, we discuss our proposed algorithm for summarizing social network data. Our proposed algorithm is based on the co-clustering techniques discussed in the previous section. Algorithm 1 presents the step by step and we discuss individual steps as follows.
The SSC algorithm takes the dataset, row,column attributes and the number of rows,column for the
ALGORITHM 1: SSC: Social Network Data Summariza-tion using Co-Clustering
Input :D, Dataset; R, Row Attributes; C, Column Attributes r, number of rows; c, number of columns.
Output:Co-clustered data and the summary,S Begin
Preprocess(D) Co-cluster(D,r,c)
foreach column cluster, i = 1:cdo
Extract the column index,cindex Sc(i)= match(C,cindex)
end
foreach row cluster, i = 1:rdo
Extract the row index,rindex Sr(i)= match(R,rindex)
end
Column Summary =Union i=1....c Sc(i) Row Summary =Union i=1....r Sr(i) Final Summary,S={Sr(i), Sc(i)}
End
desired co-clustering. For the pre-processing step, a general practise is to normalize the data or linearly scale the data in a specified range. Then the co-clustering is applied on the dataset as per the number of rows and columns as other input parameter. Here in this paper, we have used two types of co-clustering algorithms discussed in previous section. Both of these algorithms require the number of rows and columns as compulsory input. The number of rows and columns reflect the underlying data pattern and provided by the domain experts. For example, in social network datasets, the columns are composed of different features but there are group of features which are similar and can be considered as a representative of that group.
The same assumption complies with the row instances, for simple understanding, we can think of a dataset with normal and abnormal data instances. Once the co-clustering technique produces the clusters, the index of column and row clusters are extracted. In the next step, the extracted index are matched with the original row and column attribute information provided as input to this algorithm.
(a. Original data) (b. Co-clustered data)
Figure 1. Conceptual view of co-clustering, adapted from [21]
summary contains information about the entire dataset and provides a clear understanding of the data.
5.
Analysis of the Results
Our experimental data is based on the Twitter and
Tom’s Hardware data from UCI Machine Learning
Repository[14]. Twitter data contains 140707 data instances and 77 attributes. Tom’s Hardware data has 7905 instances and 96 attributes. The underlying data pattern is depicted in Table 4 and 5 respectively1.
We have used the block co-clustering R package[21] and information theoretic co-clustering from this source[22]. For the row and column input, it is clear from the data pattern that, Twitter dataset requires (row=2,column=11) and Tom’s Hardware
dataset requires (row=2, column=12) as input. The following tables display the summaries produced by two particular co-clustering applied on two different datasets discussed above.
Here it is visible that, co-clustering techniques can be able to provide a clear idea about the dataset. Although
the k-means algorithm seems to be identical but it
cannot reduce the column size. The summary dataset size according to k-means is (row=2×column=77) 154, whereas the co-clustering methods produce summary of size (row=2×column=11) 22. In this regard, frequent itemset[19,20] based summarization techniques are not comparable with the proposed techniques because they follow a different set input parameters. Interestingly, our proposed method is better than other techniques due to the fact that, it can cover the whole dataset instead of providing a partial information about the dataset.
1For space scarcity, the attribute group names are abridged and each of the attributes has 7 similar features.
0 20 40 60 80 100 120 140 160 180 200
Concise
n
e
ss
Twitter;Tom's Hardware data
Proposed Technique
K-means Clustering
Figure 2. Conciseness Comparison
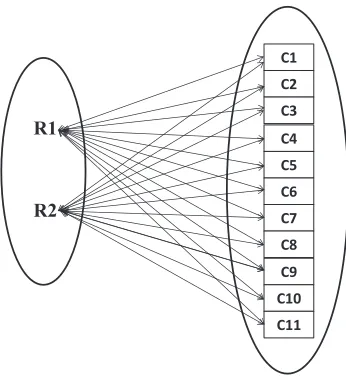
Table 6,7 also displays the summaries using both co-clustering and regular clustering. Figure 2 displays the conciseness of the summaries produced by co-clustering and regular co-clustering[9] and it is clear that, co-clustering can produce concise summary without losing information rather the summaries are more meaningful than the existing techniques. The summaries produced by existing techniques are shown in section 2, are representing a part of the dataset and less meaningful than our proposed technique. Our proposed technique takes the benefit of co-clustering to create meaningful summary which represent the whole dataset and identifies the underlying pattern.
5.1.
Bipartite Graph to Represent Summary
Table 4. Data pattern of Twitter data[14]
NCD AI AS(NA) BL NAC AS(NAC) CS AT NA ADL NAD
Buzz- 27775 √ √ √ √ √ √ √ √ √ √ √
No Buzz- 112932 √ √ √ √ √ √ √ √ √ √ √
Table 5. Data pattern of Tom’s Hardware data[14]
NCD BL NAD AI NAC ND CS AT NA ADL AS(NA) AS(NAC)
Buzz- 4860 √ √ √ √ √ √ √ √ √ √ √ √
No Buzz- 3045 √ √ √ √ √ √ √ √ √ √ √ √
Table 6. Summary of Twitter data[14] using Different Methods
Block Information Theoretic K-means
Buzz No Buzz Buzz No Buzz Buzz No Buzz
Cluster-1 3318 79593 21943 112923 5070 112929
Cluster-2 24457 33339 5832 9 22705 3
Table 7. Summary of Tom’s Hardware data[14] using Different Methods
Block Information Theoretic K-means
Buzz No Buzz Buzz No Buzz Buzz No Buzz
Cluster-1 4680 3045 644 771 4687 3045
Cluster-2 180 0 4216 2268 173 0
for theTwitterdata. The produced two row clusters are all connected with the eleven column clusters. Which indicates, the whole dataset is taken into consideration for the summarization process and identifying the patterns.
R1
R2
C1 C2 C3 C4 C5 C6 C7 C8 C9 C10 C11
Figure 3. Summary representation using bipartite graph
6.
Conclusion
In this paper, we have utilized the power of co-clustering to simultaneously cluster rows and columns of a dataset to create meaningful summary. We have explained in our results that, our proposed technique cover the whole dataset for creating summary and can detect the underlying data pattern. Existing summarization techniques are not able to cover the whole dataset and cannot provide the underlying data pattern.
We have experimented with the social network data and have shown that, our proposed technique is able to create concise summary yet identify the underlying data pattern encompassing the whole dataset. We also discussed the drawbacks of the existing techniques and our future work will include the application of co-clustering in other domain as well as network traffic analysis to efficiently detect the anomalies from the summary.
References
[2] “Twitter restores service after attack.” [Online]. Available: http://bits.blogs.nytimes.com/2009/ 08/06/twitter-overwhelmed-by-web-attack
[3] M. Ahmed, A. Mahmood, and J. Hu, “A survey of network anomaly detection techniques,” Journal of Network and Computer Applications, vol. 60, pp. 19–31, 2015.
[4] M. Ahmed, A. N. Mahmood, J. Hu, Outlier Detection, CRC Press, New York, USA, 2014, Ch. 1, pp. 3–21, (in book: The State of the Art in Intrusion Prevention and Detection). [5] M. Ahmed, A. Mahmood, Network traffic analysis based
on collective anomaly detection, in: Industrial Electronics and Applications (ICIEA), 2014 IEEE 9th Conference on, 2014, pp. 1141–1146.
[6] M. Ahmed, A. Mahmood, Novel approach for network traffic pattern analysis using clustering-based collective anomaly detection, Annals of Data Science 2 (1) (2015) 111–130.
[7] M. Ahmed, A. N. Mahmood, M. R. Islam, A survey of anomaly detection techniques in financial domain, Future Generation Computer Systems 55 (2016) 278 – 288. [8] M. Ahmed, A. Anwar, A. N. Mahmood, Z. Shah, and
M. J. Maher, “An investigation of performance analysis of anomaly detection techniques for big data in scada systems,”EAI Endorsed Transactions on Industrial Networks and Intelligent Systems, vol. 15, no. 3, pp. 1–16, 5 2015. [9] M. Ahmed, A. Mahmood, Clustering based semantic data
summarization technique: A new approach, in: Industrial Electronics and Applications (ICIEA), 2014 IEEE 9th Conference on, 2014, pp. 1780–1785.
[10] M. Ahmed, A. Mahmood, M. Maher, A novel approach for network traffic summarization, in: J. J. Jung, C. Badica, A. Kiss (Eds.), Scalable Information Systems, Vol. 139 of Lecture Notes of the Institute for Computer Sciences, Social Informatics and Telecommunications Engineering, Springer International Publishing, 2015, pp. 51–60. [11] M. Ahmed, A. N. Mahmood, M. J. Maher, An
efficient technique for network traffic summarization using multiview clustering and statistical sampling, EAI Endorsed Transactions on Scalable Information Systems 15 (5) (2015) 1–9.
[12] M. Ahmed, A. N. Mahmood, Network traffic pat-tern analysis using improved information-theoretic co-clustering based collective anomaly detection, in: Secu-rity and Privacy in Communication Networks, Vol. 153 of Lecture Notes of the Institute for Computer Sciences, Social Informatics and Telecommunications Engineering, Springer International Publishing, 2014, pp. 1–16.
[13] M. Ahmed, A. Mahmood, M. Maher, Heart disease diagnosis using co-clustering, in: J. J. Jung, C. Badica, A. Kiss (Eds.), Scalable Information Systems, Vol. 139 of Lecture Notes of the Institute for Computer Sciences, Social Informatics and Telecommunications Engineering, Springer International Publishing, 2015, pp. 61–70. [14] K. Bache and M. Lichman, “UCI machine learning
repository,” 2013. [Online]. Available: http://archive. ics.uci.edu/ml
[15] L. Wagstaff, P. Shu, D. Mazzoni, and R. Castano, “Semi-supervised data summarization: using spectral libraries to improve hyperspectral clustering,” in The Interplanetary Network Progress Report, vol. 42, 2005.
[16] V. Ha-Thuc, D.-C. Nguyen, and P. Srinivasan, “A quality-threshold data summarization algorithm.” inRIVF. IEEE, 2008, pp. 240–246.
[17] P. Wendel, M. Ghanem, and Y. Guo, “Scalable clustering on the data grid,” in 5th IEEE International Symposium Cluster Computing and the Grid (CCGrid), 2005.
[18] P. More and L. Hall, “Scalable clustering: a distributed approach,” inFuzzy Systems, 2004. Proceedings. 2004 IEEE International Conference on, vol. 1, 2004, pp. 143–148 vol.1. [19] V. Chandola and V. Kumar, “Summarization- Compress-ing Data into an Informative Representation,”Knowl. Inf. Syst., vol. 12, no. 3, pp. 355–378, Aug. 2007.
[20] D. Hoplaros, Z. Tari, and I. Khalil, “Data summarization for network traffic monitoring,” Journal of Network and Computer Applications, vol. 37, no. 0, pp. 194 – 205, 2014. [21] P. Bhatia, S. Iovleff, and G. Govaert, “Blockcluster:
An r package for model based co-clustering,” Dec 2014. [Online]. Available: https://cran.r-project.org/web/ packages/blockcluster/index.html
[22] “Information theoretic co-clustering.” [Online]. Avail-able:http://www.lans.ece.utexas.edu/facility.html [23] G. Govaert and M. Nadif, “Latent block model for
contingency table,” inCommunication in Statistics: Theory and Methods, p. 2010.
[24] ——, “Clustering with block mixture models,” Pattern Recognition, vol. 36, no. 2, pp. 463 – 473, 2003, biometrics. [25] A. Banerjee, I. Dhillon, J. Ghosh, S. Merugu, and D. S. Modha, “A generalized maximum entropy approach to bregman co-clustering and matrix approximation,” J. Mach. Learn. Res., vol. 8, pp. 1919–1986, Dec. 2007. [26] ——, “Block clustering with bernoulli mixture models:

![Figure 1. Conceptual view of co-clustering, adapted from [21]](https://thumb-us.123doks.com/thumbv2/123dok_us/8427601.1696560/4.595.320.536.280.434/figure-conceptual-view-clustering-adapted.webp)