© Universiti Tun Hussein Onn Malaysia Publisher’s Office
IJIE
Journal homepage: http://penerbit.uthm.edu.my/ojs/index.php/ijie
The International
Journal of
Integrated
Engineering
The Proposed Dashboard Model for Measuring Performance
of Small-Medium Enterprises (SME)
Taufiq Immawan
1*, Annisa Indah Pratiwi
1, Winda Nur Cahyo
11Department of Industrial Engineering,
Faculty of Industrial Technology, Universitas Islam Indonesia, Yogyakarta, 55584, INDONESIA
*Corresponding author
DOI: https://doi.org/10.30880/ijie.2019.11.05.021
Received 25 April 2019; Accepted 08 September 2019; Available online 10 September 2019
1. Introduction
To compete in regional and global markets, the SMEs should be competitive. They have at least competitive and comparative products. Consequently, the development of SMEs should head for two directions, i.e. improving the quality of SME as well as its quantity. If the development can be done, SME can serve as a mainstay in the enhancement and the development of Indonesia’s economy. SME as economic pioneer in the development of the national economy in the future is a very appropriate and wise choice. Nevertheless, it must be equipped with an appropriate development strategy to avoid disharmony or discontinuity.
Inaccurate and negligent provisioning toward SMEs to compete in regional, national and international markets will cause the helplessness of SMEs facing the global competition. In addition, the cause of the decreasing production is caused by the shellacking of the SME product with the flood of Chinese products in Indonesian market. These products are competitor’s commodities of Indonesian SMEs such as ceramic, apparel, footwear (shoes/slippers), furniture, and craft products [1].
Abstract: The era of free market and the more dynamic environment condition forces many companies to establish the proper strategy. Implementation of a correct strategy can increase the effectiveness and efficiency of the use of the company resources. The system of measuring performance is one of models used to monitor the success of implementing objective strategy which has been determined by the leader of the company, including SME (small- medium enterprise). However, a lot of SME do not have clear vision and strategy. It is because the SME orientation only focuses on more dominant operational performance. Therefore, smart system can be used to arrange a parameter of performance measurement. AHP (Analytic Hierarchy Process) is used to determine the priority from each criterion from KPI (Key Performance Indicator). Knowing the proper need, the company can determine the priority to select if the company has limited fund and resources. Moreover, the assessment system used in this research uses OMAX (Objective Matrix) method for each KPI. To assess, the measurement uses the concept of traffic light system using 3 colors: green (achieving a target), yellow (close with the target), and red (far from target). Nevertheless, this KPI needs to get attention in the next period. The research observes 3 SMEs located in Krebet tourism village. They are SME Ragil Handicraft, SME Sanggar Punokawan and SME Yuan art. The result shows that there are 31 keys performance indicators (KPI) used to measure the performance of SME. The assessment result of OMAX shows that there are still a lot of KPIs with red color. Thus, they need to be repaired. Knowing the performance of SME still far from target (red), the sources of the problem can be identified, so that the reparation target done by SME is more appropriate.
168
The global competition has already been unavoidable because of the enactment of CAFTA and MEA. Local entrepreneurs must be ready to compete with foreign entrepreneurs in Indonesian market. The era of free market and the more dynamic environment condition force many companies to establish the proper strategy. Furthermore, its implementation with a good strategy can increase the affectivity and efficiency of the usage of company resources. The system of measuring performance is one of models used to monitor the success of implementing objective strategy which has been determined by the leader of the company, including SME.
Until now, the performance measurement of companies tends to focus more on financial aspect only. It should be noted that such trend may insignificantly affect the company's business sustainability because the results of measuring performance partially are likely to obscure or even hide the company's reliability to achieve economic value in the future. For instance, many companies’ leaders could be judged as a successful leader if he can achieve a certain financial level. Therefore, many companies are trying to increase profits in several ways. This method can trap the company in the short- term orientation and ignores the continuity of long-term business of the company.
The Methods of measurement performance has thrived in this era. Academics and practitioners have much implemented new models of performance measurement system, such as the Balanced Scorecard [2], Integrated Performance Measurement System (IPMS) [3], and SMART (Strategic Management Analysis and Reporting Techniques) System [4]. The implementation of the many performance measurement systems in the context of companies in Indonesia has been done in this era. However, performance measurement application in small and medium sized industrial companies is still in the low level, whereas small and medium industrial enterprises in Indonesia are abundant and have a significant contribution to the Indonesian economics. The durability of the small and medium industry when the monetary crises shock is also better than that of big industry. In general, there are still plenty of companies of Indonesia both small and medium-scale enterprise (SME) who runs their business without having the vision, mission, and management strategy. Moreover, a lot of the SMEs never access to the performance of their business. This gives bad impacts i.e., although the durability against the economy shocks seems to be strong, but the business competitiveness in domestic and international market appears to be low. These conditions are not favorable for the development efforts of SMEs and embodying the SMEs as the pillars of a strong economy to support economic growth. Based on that condition, it is needed to study about the business strategy of SMEs within the framework of the development of the SME which focused on competitive improvement of performance in the future. Thus, it is needed the improved performance of SME model based on performance assessment system which is appropriate to the nature and characteristics of SMEs.
Researches on performance measurement have been done by some earlier researchers. A research by J. Sinisammal [5] promoted the Balanced Scorecard as a performance measurement. According M.Hudson et. al., [6], performance measurement strategy from the perspective of quality, flexibility, time, finance, customer satisfaction and human resource is suggested. In [7], some related performance measurement method related to complexity, diversity and the development of a dynamic business surroundings is analyzed. L. Lesakova et. al., [8] conducted a research on public administration in the Republic of Slovakia by using methods of the BSC. N. Wahyuni et. al., [9] performed a research with the Engineering Faculty as an object as a performance evaluation by using the Smart System. L. Arkea [10] proposed the "Smart Measures” as approaches in creating performance measurement priorities for business consultant based on organizational culture and style of leadership.
A lot of small and medium organizations do not have a clear vision and strategy. Their orientation is more focused on the operational performance. Besides, the method of SMART system is able to identify the feedback context to monitor organizational performance and to improve performance measurement over the traditional action [11]. This model is often used by small and medium sized organizations to measure the performance of the organization. Therefore, this study will use the Smart system in developing SME performance measurement model.
However, this method still lack of mechanism to identify key performance indicators, to determine the form act of measurement and also to integrate implicitly the concept of continuous improvement [11]. Thus, it needs the integration of other methods to cover the shortcomings of the SMART method to identify the key indicators. KPI identification begins from gathering as many variables as possible to be key indicators at each perspective in the unit of SMART paradigm level by using the interview method. The use of KPI, Monitoring system and performance measurement can be found in [12 – 14]
The key indicators that have been identified will then be measured using SMART method which begins with the Analytical Hierarchy Process. Measuring each KPI, the performance measurement is done to find out if, during the execution of the performance, there was a deviation from the plan that has been specified. The required data in the measurement is secondary data of the SMEs. The obtained data was converted in the form of numbers or score. Furthermore, the scoring system used in this research is the method of OMAX (Objective Matrix) for each KPI. When measuring, the concept of Traffic Light System is used with three colors, i.e. green with threshold 7-10 meaning that performance of KPI has reached the targets even beyond the target, the yellow with a threshold of 3 to 6 meaning that performance of KPI has not yet reached the target but close to achieve the target and the red color with a threshold of 0 - 2 meaning that the performance of KPI is truly under target. This KPI needs to get special attention in the next period.
departments. The basic concept of this process is developing a matrix based on the working groups of the performance criterion. The result is a single value of a working group. The application of this method can be found in [16, 17].
2.
Research Method
2.1
Object and Subject of the research
Object of the research is the achievement of performance gained by SMEs in Krebet Tourism Village. The number of subjects for distributing questionnaire consists of all employees and owners of those three SMEs, i.e., 57 respondents.
2.2
Research Procedure
i. Data Collection
The required data consists of primary and secondary data. Primary data are obtained by spreading questionnaire and doing interview to find out attributes of the KPI and stakeholder assessment against those obtained KPI. While secondary data are obtained by library research, direct observation and interviews with the owners of SMEs.
ii. The concept of the program
Some possible variables that can be served as key indicators are formulated from the results of interviews and brainstorming with the SMEs and relevant parties. After obtaining some variables, the validity and reliability test is, then, carried out to evaluate and get the reliable variables as key indicators. By using the framework of SMART system, the objective strategy of the company is observed from the level of the company business and perspectives of each level. Furthermore, the company's objectives strategy can be determined through the company's data and interviews with the managers. The validation of the results of the KPIs by management party is concluded by categorizing them according to the types of perspective in the framework of the SMART system.
The next step is to measure the KPI with Analytical Hierarchy Process (AHP). After the measurement of each expected KPI performance is established, the performance measurement process is carried out to find out if, during the execution of the performance, there was a deviation from the plan that has been specified. The required data in the measurement form is secondary data from Krebet village. The obtained data was converted into numbers or score. Furthermore, the scoring system used in this research is the method of OMAX (Objective Matrix) for each KPI.
OMAX score lies in the range of 0 to 10 where a score of 0 indicates that KPI performance is very far from target or is the worst performance. A score of 3 indicates KPI average performance. A score of 10 shows KPI has reached the target or, even, far beyond the target. The score of 1.2 is the interpolation value in range 0 up to 3, while the score of 4, 5, 6, 7, 8 and 9 is the interpolation value between 3 and 10.
When measuring, the concept of Traffic Light System is used with three colors, i.e. green with threshold 7-10 meaning that performance of KPI has reached the targets even beyond the target, the yellow with a threshold of 3 to 6 meaning that performance of KPI has not yet reached the target but close to achieve the target and the red color with a threshold of 0 - 2 meaning that the performance of KPI is truly below target. This KPI needs to get special attention in the next period. In the performance measurement using OMAX and Traffic Light, a dashboard will be designed to ease SMEs in conducting the measurement of its performance.
The key attribute with the problematic performance is marked with red (extremely low) and yellow (quite low), while the key attributes that are already well marked with green color. After obtaining the troubled key attributes, the next step is to find a solution to those problematic attributes. That case is done for increasing performance of SME in the future.
3.
Results and Discussion
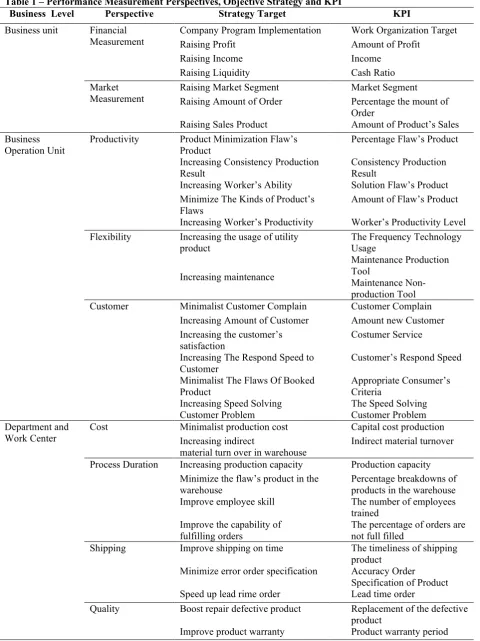
Referring to the framework of SMART system, the analysis of the objective strategy is carried out from each perspective on SMEs by conducting a direct observation and interviews with owners of SMEs as object of the research. Because objective strategy has not been able to demonstrate how successful companies achieve their targets, therefore, metrics is needed to measure and present the success of the objective strategy. The referred metrics are the Key Performance Indicators (KPI) as shown in Table 1.
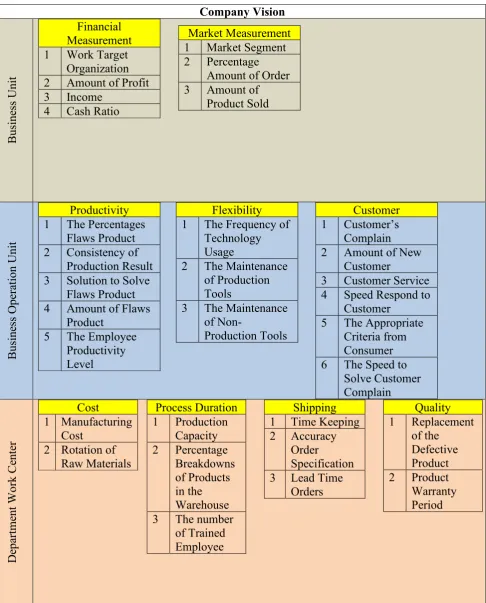
To provide a better understanding of all the KPI in the organization and its units, a mind map of key indicators for each perspective on each level based on the SMART framework is developed and presented in Fig. 1. Then, the next step is to determine the weighting of each KPI based on hierarchical structure of performance measurement. This step is required as a preference of management party toward the importance of the criteria. The characteristic of the questionnaire that serves as a data capture instrument is covered as well as given to the party which is competent and understanding of each criterion which will be asked. In this study, the respondent consists of owners of the SME Ragil, SME Yuan art and SME Punokawan. Weighting method is obtained from the Analytical Hierarchy Process (AHP) based on a hierarchical structure of performance measurement.
170
development of SMART performance measurement that has flaws; SMART not clearly defined key indicators and the measurement performance. This dashboard will later be used for other performance measurement that has business processes and the same production process with SMEs wooden Batik Krebet.
Table 1 – Performance Measurement Perspectives, Objective Strategy and KPI
Business Level Perspective Strategy Target KPI
Business unit Financial
Measurement Company Program Implementation Raising Profit Work Organization Target Amount of Profit
Raising Income Income
Raising Liquidity Cash Ratio
Market
Measurement Raising Market Segment Raising Amount of Order Market Segment Percentage the mount of Order
Raising Sales Product Amount of Product’s Sales
Business
Operation Unit Productivity Product Minimization Flaw’s Product Percentage Flaw’s Product
Increasing Consistency Production
Result Consistency Production Result
Increasing Worker’s Ability Solution Flaw’s Product
Minimize The Kinds of Product’s
Flaws Amount of Flaw’s Product
Increasing Worker’s Productivity Worker’s Productivity Level
Flexibility Increasing the usage of utility
product The Frequency Technology Usage
Increasing maintenance
Maintenance Production Tool
Maintenance Non- production Tool
Customer Minimalist Customer Complain Customer Complain
Increasing Amount of Customer Amount new Customer
Increasing the customer’s
satisfaction Costumer Service
Increasing The Respond Speed to
Customer Customer’s Respond Speed
Minimalist The Flaws Of Booked
Product Appropriate Consumer’s Criteria
Increasing Speed Solving
Customer Problem The Speed Solving Customer Problem
Department and
Work Center Cost Minimalist production cost Increasing indirect Capital cost production
material turn over in warehouse Indirect material turnover
Process Duration Increasing production capacity Production capacity
Minimize the flaw’s product in the
warehouse Percentage breakdowns of products in the warehouse
Improve employee skill The number of employees
trained Improve the capability of
fulfilling orders The percentage of orders are not full filled
Shipping Improve shipping on time The timeliness of shipping
product
Minimize error order specification Accuracy Order
Specification of Product
Speed up lead rime order Lead time order
Quality Boost repair defective product Replacement of the defective
product
After obtaining Mind Map of key indicators for each perspective on each level based on the SMART framework, the dashboard obtained from the results of KPI collection which has been validated with validity and reliability test and weight of each KPI obtained from the result of AHP will henceforth be made. These perspective and weights can be used for the performance measurement of other UKM that have the business process and the same production process in the tourist village of Krebet.
Based on the results of the determination of KPI scores using the OMAX method, it is found that the strategic objectives which have not been achieved (still red) until the end of the KPI calculation period are the income change ratio (SME Punokawan), the number of defective products (SME Ragil and Punokawan), employee performane data (SME Punokawan) Disabled product data and type of last 3 months (SME ragil), percentage of production equipment maintenance (Punokawan and Yuan art), percentage of customer complaint (SME ragil), Percentage of new customer (SME Punokawan), Data average service duration (All SME), speed of completion of claim, product HPP, percentage of stock, Percentage of warehouse products, timeliness of delivery, data on order delivery time (SME ragil and Punokawan), and product change list.
Based on the data of strategic targets which have not been reached the targets above, it can be analyzed that the problems must be addressed and be determined so that the improvements can be done. Here are proposed improvements to the strategic goals of the problem:
i. Percentage of disabled products
Apply a quality control system, undertaking preventive actions, controlling quality over raw materials and processes.
ii. Income change ratio
Expanding market share, adding partners, expanding into other cities and exporting abroad.
iii. Percentage of production equipment maintenance and non-production
Performing maintenance of production equipment and non-production equipment on a regular basis.
iv. Percentage of product damage in the warehouse
Evaluation of existing stock in the warehouse, warehouse maintenance, ensuring the product is safe in the warehouse.
v. Average service duration
Standard time of customer service, list type of customer service, creating SOP for customer service.
vi. Manufacturing Cost per product
Maximizing the use of materials, looking for an cheaper raw material but should also pay attention of its quality.
vii. Addition of Market share
Performing Sales through online store, attending an international exhibition
viii. Claims settlement speed
Adding experts in public relations.
ix. Product defects and types last 3 months
Improving the workers expertise, maintain the machine - Material quality checking. Timeline for making orders, apply Lean Manufacturing, and Material Inventory Management.
x. List of product replacements
Adding experts in the field of design, job supervision, penalties for employees was not applied consistently.
xi. Percentage of new customers
Marketing Strategy (Selling through online, social media), Promotion Strategy (Pricing Strategy, Discount Strategy), Designing products that match with Trend.
xii. Percentage of stock
Providing employees who specifically ‘make to stock’ products, Employees who serve orders help to make stock products when there is no order.
4.
Conclusion
172
Company Vision
Bus
ine
ss
U
ni
t
Financial
Measurement
1 Work Target
Organization
2 Amount of Profit
3 Income
4 Cash Ratio
Market Measurement
1 Market Segment
2 Percentage
Amount of Order
3 Amount of
Product Sold
Bus
ine
ss
O
pe
ra
tion U
ni
t
Productivity
1 The Percentages
Flaws Product
2 Consistency of
Production Result
3 Solution to Solve
Flaws Product
4 Amount of Flaws
Product
5 The Employee
Productivity
Level
Flexibility
1 The Frequency of
Technology
Usage
2 The Maintenance
of Production
Tools
3 The Maintenance
of
Non-Production Tools
Customer
1 Customer’s
Complain
2 Amount of New
Customer
3 Customer Service
4 Speed Respond to
Customer
5 The Appropriate
Criteria from
Consumer
6 The Speed to
Solve Customer
Complain
D
ep
ar
tm
en
t Wo
rk
C
en
ter
Cost
1 Manufacturing
Cost
2 Rotation of
Raw Materials
Process Duration
1 Production
Capacity
2 Percentage
Breakdowns
of Products
in the
Warehouse
3 The number
of Trained
Employee
Shipping
1 Time Keeping
2 Accuracy
Order
Specification
3 Lead Time
Orders
Quality
1 Replacement
of the
Defective
Product
2 Product
Warranty
Period
References
[1] Susilo, S. (2010). "Strategi Meningkatkan Daya Saing Umkm Dalam Menghadapi Implementasi Cafta Dan Mea".
Buletin Ekonomi, 8(2), 70-78.
[2] Kaplan, R. S., and Norton, D. P. (1996). The Balanced Scorecard: Translating Strategy into Action. Boston,
Massachusetts: Harvard Business Scholl Press.
[3] Bititci, U. S., Carrie, A. S., and Turner, T. (1997). Integrated Performance Measurement Systems: A Reference
Model. Organizing the Extended Enterprise, 191-202.
[4] Richard L. Lynch and Cross, K. F. (1992). Measure Up!: Essential Guide to Measuring Business Potential.
Business logistics, Mandarin.
[5] Sinisammal, J. (2012). Successful Performance Measurement in SMEs through Personnel Participation. American
Journal of Industrial and Business Management, 2, 30-38.
[6] Hudson, M., Smart, A., and Bourne, M. (2001). Theory and practice in SME performance measurement systems.
International Journal of Operations & Production Management, 21(8), 1096-1115.
[7] Susilawati, A. (2013). Develop a Framework of Performance Measurement and Improvement System for Lean
Manufacturing Activity. International Journal of Lean Thinking, 4.
[8] Lesakova, L., and Katarina, D. (2016). Knowledge and Use of the Balanced Scorecard Method in the Businesses
in the Slovak Republic. Procedia - Social and Behavioral Sciences, 230, 39-48.
[9] Wahyuni, N., Katili, P. B., and Pranata, I. C. (2015). "Pengukuran Kinerja Fakultas Teknik Untirta Melalui
Strategic Management Analysis and Reporting TechniqueSeminar Nasional IENACO, 606-612.
[10] Striteska, M., and Spickova, M. (2012). Review and comparison of performance measurement systems. Journal of
Organizational Management Studies, 2012, 1-13.
[11] Adetunji, O. R., Owolabi, S. M., Adesusi, O. M., Dairo, O. U., Ipadeola, S. O., and Taiwo, S. O. (2018). Effect of Computerized Maintenance Management System on a Cement Production Plant. International Journal of Integrated Engineering, 10(4), 12-16.
[12] Abdul Wahid, A.S. (2018). Contract Management Control and Monitoring System for the Royal Malaysian Navy
– Post Survey Validation via Top Management Experts. International Journal of Integrated Engineering, 10(5).
[13] Hatefi, S. M. (2017). A Multi objective model for supplier evaluation and selection in the presence of both
cardinal and imprecise data. International Journal of Integrated Engineering, 9(2), 9-17.
[14] Yosan, B., Kholil, M., and Soraya, W. (2016). Increasing Productivity with Objective Matrix Method: Case Study
on Building Maintenance Management PIO PT. XXX. Proceeding of 9th International Seminar on Industrial
Engineering and Management,ISSN : 1978-774X .
[15] Dervitsiotis, K. N. (2010). The objectives matrix as a facilitating framework for quality assessment and
improvement in education. Journal Total Quality Management, 6(5), 563-570.
[16] Sukendar, I., Nurwidiana, and Hidayati, D. N. (2017). Implementation of supply chain management in supplier