BY COMBINING SPEECH AND OBJECT DETECTION
IN INDOOR ENVIRONMENTS
by Kiran Thapa
A thesis
submitted in partial fulfillment of the requirements for the degree of Master of Science in Computer Science
Boise State University
DEFENSE COMMITTEE AND FINAL READING APPROVALS
of the thesis submitted by
Kiran Thapa
Thesis Title: Detecting Saliency by Combining Speech and Object Detection in Indoor Environments
Date of Final Oral Examination: 4th June 2018
The following individuals read and discussed the thesis submitted by student Kiran Thapa, and they evaluated the presentation and response to questions during the final oral examination. They found that the student passed the final oral examination.
Dr. James Buffenbarger, Ph.D. Chair, Supervisory Committee
Dr. Casey Kennington, Ph.D. Member, Supervisory Committee
Dr. Jerry Alan Fails, Ph.D. Member, Supervisory Committee
After having been away from academia for almost four years, I restarted my education at Boise State University as a Graduate Student/Assistant. I can still remember the immense joy and excitement I experienced when I was admitted and fully funded by Boise State University for my education here. It would have been very difficult for me to leave my (safe) job and be a student once again. Hence, I would like to express special thanks to the Graduate College and the Computer Science Department for giving me the opportunity.
I am grateful to Dr. James Buffenbarger for taking me as his graduate assistant. I highly admire the freedom he granted me to pick a thesis topic.
I am grateful to Dr. Casey Kennington for working with me to find a suitable thesis project and for being my co-advisor. His ideas and suggestions were crucial for me to achieve my goals. He will be a continuous source of inspiration in my life.
I am grateful to Dr. Jerry Alan Fails for willing to be in my thesis committee, and for providing me extra support and critical guidance. I would also like to thank him for helping me secure funding in the final half of my graduate degree.
I would also like to thank the Computer Science Administrative Department for helping me whenever needed and for providing a welcoming environment for international students.
Finally, I am grateful to my parents for always supporting me and helping me realize the importance of education. I wouldn’t have come this far without their never-ending encouragement and love.
Describing scenes such as rooms, city streets, or routes, is a very common human task that requires the ability to identify and describe the scene sufficiently for a hearer to develop a mental model of the scene. When people talk about such scenes, they mention some objects of the scene at the exclusion of others. We call the mentioned objects salient objects as people consider them noticeable or important in comparison to other non-mentioned objects. In this thesis, we look at saliency of visual scenes and how visual saliency informs what can and should be said about a scene when describing it.
Previous work on saliency focuses on the scenes themselves, whereas we are interested in what people actually say about those scenes. For this, we take the scenes and human dialogue into account. To collect the dialogue data, we developed a web application and used a crowd sourcing platform to get access to an on-demand workforce which allowed us to get more realistic and varied responses from users. To automate the process of detecting salient objects given a novel scene, we used a popular image content analysis tool to extract objects present in the scene. We used the dialogue data to rank the detected objects based on their saliency which gives us candidate objects to mention. We also compare how different features of the gathered data can be used to develop saliency detection models. Our initial investigation shows that human dialogue data significantly improves the detection of salient objects.
ABSTRACT . . . v
LIST OF TABLES . . . ix
LIST OF FIGURES . . . x
LIST OF ABBREVIATIONS . . . xii
1 Introduction . . . 1
1.1 Background . . . 1
1.2 Thesis Statement . . . 5
2 Related Work . . . 7
2.1 Saliency . . . 7
2.2 Object Detection . . . 8
2.3 Image Captioning . . . 9
2.4 GIVE-2 Corpus . . . 10
2.5 Interactive Dialogue and Knowledge Acquisition . . . 10
3 Data Collection . . . 12
3.1 Dialogue Data Collection . . . 13
3.1.1 Web application and Hosting environment . . . 14
3.1.2 Amazon Mechanical Turk . . . 15
3.1.4 The Task . . . 17
3.1.5 Logging and HIT Submission . . . 19
3.2 Object Detection . . . 20
4 Data Analysis . . . 23
4.1 Participant Analysis . . . 23
4.1.1 Task participation . . . 23
4.1.2 Chat turns per participant . . . 23
4.1.3 Number of words per chat turn . . . 24
4.2 Image coverage, token count, vocabulary . . . 24
4.3 Image and Text Summarization . . . 26
4.4 Temporal based Image Similarity . . . 27
4.5 Object detection label and confidence distribution . . . 28
4.6 Dialogue vs Object Detection Data . . . 30
5 Experiment . . . 31
5.1 Methodology . . . 31
5.2 Evaluation Metric . . . 32
5.3 Feature Selection and Model Development . . . 33
5.3.1 Baseline Model (Confidence Only) . . . 34
5.3.2 Ablation Analysis of Models . . . 35
5.4 Results . . . 40
6 Conclusion . . . 43
6.1 Limitations and Future Work . . . 44
5.1 Comparison of different saliency models . . . 40
1.1 An image from UIUC Pascal sentence dataset with 5 descriptions written
by people. . . 2
3.1 Overview of the saliency detection process . . . 13
3.2 Overview of the human dialogue data collection process . . . 14
3.3 Caption for LOF . . . 16
3.4 Pairing of workers and assigning roles . . . 17
3.5 Example Instruction Follower View . . . 18
3.6 Example Instruction Giver View . . . 19
3.7 A sample bathroom image . . . 20
3.8 Comparison of the two cloud image content analysis services . . . 21
4.1 Distribution of image descriptions . . . 25
4.2 Top 10 words for each room type . . . 25
4.3 A sample living room . . . 26
4.4 Description of the living room in Figure 4.3 . . . 26
4.5 Two living rooms . . . 27
4.6 Two living rooms . . . 28
4.7 Top 10 detected object labels for each room type . . . 29
4.8 Confidence plot of detected objects . . . 29
5.1 Ranking of objects based on the confidence model . . . 35
5.3 Evaluation of the confidence and object based model . . . 36
5.4 Evaluation of the confidence and language based model . . . 37
5.5 Evaluation of the object and language based model . . . 38
5.6 Evaluation of the confidence, object, and language based model . . . 39
5.7 Evaluation of language based model . . . 40
5.8 MRR values for different models . . . 41
AMT – Amazon Mechanical Turk
CNN – Convolutional Neural Network
IG – Instruction Giver
IF – Instruction Follower
NLG – Natural Language Generation
UIUC – University of Illinois Urbana-Champaign
CHAPTER 1
INTRODUCTION
1.1
Background
Describing scenes such as rooms, city streets, or routes, is a very common human task that requires the ability to identify and describe the scene sufficiently for the hearer to develop a mental model of the scene. A necessary prerequisite to describing the scene is determining what to perceive and judge as important in the scene, called visual saliency [4]. Visual saliency is the distinct subjective perceptual quality which makes some objects in a scene stand out from their neighbors and immediately grab our attention [20]. Hence, determining what to describe is the goal of this thesis: we will look at saliency of visual scenes and how visual saliency informs what can and should be said about a scene when describing it.
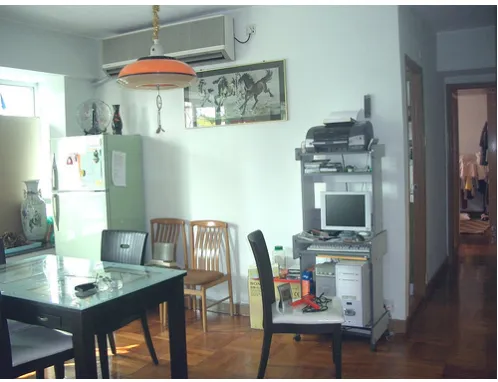
Visual saliency, by which we perceive and assign importance to some objects at the exclusion of others, also depends on the type of the visual scene at hand. Based on the current visual scene, we identify some objects as visually salient and include them in our conversation. For example, a birdcage inside a kitchen might be more visually salient than a birdcage inside a birdcage shop.
“A kitchen dining room with a computer workstation” “A kitchen table with chairs and a computer work station nearby.”
“A kitchen with a computer in it.” “An orange light fixture hangs in a kitchen.”
“The interior of someone’s home including kitchen, hall, and bathroom.”
Figure 1.1: An image from UIUC Pascal sentence dataset with 5 descriptions written by people.
The remaining objects would belong to the attributes category, since tables, chairs, refrigerator, and light fixtures are common in a kitchen.
Recently, computer vision has seen major advancements in object detection, and now, automated systems can recognize and categorize objects very reliably [15, 12, 9, 27], yet we need to look more closely at other questions related to visual saliency, whereby humans communicate and articulate their perception of their immediate surroundings. Current object recognition systems would treat all objects in an image as equally important, despite indications that humans perceive, and apply importance to objects in a different way. Similarly, existing research on generating image descriptions [25, 26, 13] use datasets that have been annotated by humans to train their models. Most often these datasets are gathered by asking humans what they see in an image, and lack the characteristics of an actual dialogue that occurs between two humans when they are talking about a scene. This way of gathering image data lacks the interactive ability of humans to focus on salient aspects of the image. For this reason, we require human descriptions of images in a natural two-way conversation setting.
the purpose of artificial intelligence. An ideal system would scan the surroundings, identify salient objects, and generate speech pertaining to those objects. The first step in this approach is to identify and determine what to describe about a scene; i.e,, a system that perceives and assigns relative importance to objects at the exclusion of its neighbors.
In summary, we identify two major problems with existing approaches for detect-ing saliency in visual scenes. The first problem, as stated above, is the focus on every object detectable in an image. This approach does not detect and categorize objects based on their saliency. The second problem is the lack of human dialogue data, where saliency is the core idea. In our approach, we address the above problems related to saliency detection in visual scenes by combining two datasets. The goal behind this is to understand how humans use saliency in their day-to-day conversation and use that knowledge to automate the process of saliency detection, by using objects detected from image analysis services.
ability to view all possible options (objects) at the same time, and decide which one is the best fit. Next, we gather data related to objects present in indoor images from a deep-learning based image analysis service. Since part of our thesis is automating the process of saliency detection, this data provides us possible objects present in an image, which we later rank based on their saliency. As mentioned above, we combine the data gathered from two different steps, analyze the distribution of the objects in each dataset, and develop and evaluate models to rank objects based on their saliency.
1.2
Thesis Statement
In an interactive co-located dialogue between two humans who are talking about their surroundings, they talk about some objects of the scene at the exclusion of other objects. We call the former objects salient objects, because we consider them important and include them in our conversation. Consequently, we call the latter objects attributes, because such objects prototypically belong to a specific scene type (e.g., a kitchen), and are ignored or not mentioned by us. We hypothesize that the salient objects are not attributes, and that we can predict both salient objects and attributes given an indoor scene and human dialogue data. To address our hypothesis, we use object detection and natural language processing techniques, to detect saliency and common attributes of an indoor image.
the data from the first and second steps, we address the problem of identifying salient objects given a novel indoor image. A main question we address is: what objects of an indoor image do people determine to be important? Hence, the thesis work has several contributions:
• We gather data that goes beyond just describing images, and emphasizes how
humans would naturally emphasize certain aspects of the images.
• We evaluate and analyze how the distribution of objects detected using current
state-of-the-art computer-vision method compares with objects mentioned in a human-to-human interactive dialogue.
• We then answer our central question by which we are able to determine salient
objects of an indoor scene.
CHAPTER 2
RELATED WORK
Detecting saliency and generating salient descriptions of indoor environments com-prises many individual tasks. In this chapter, we present background work on saliency, object detection and knowledge acquisition, image captioning, the virtual environ-ment corpus, and interactive dialogue.
2.1
Saliency
Outdoor environments contain clear decision points, present in street networks, and have less complex spatial layouts when compared to indoor environments [28]. Therefore, little research has been dedicated to generating good salience models for indoor environments. Mast et al. [28] propose a probabilistic framework for generating route instructions for indoor scenarios, that aims to provide context by relating instructions to environmental features. However, the authors do not consider saliency for identifying important indoor objects which are present in conversational dialogue between humans.
In summary, prior saliency work focuses on the scene information only. We connect it with what people mention about a scene, using dialogue data. Hence, our work focuses on detecting important and unique features from indoor scenes that help identify human-like conversational salient features.
2.2
Object Detection
Vision [17] and Amazon Rekognition [1]. We found, through manual comparison of objects detected using both services, that Amazon Rekognition service detects more objects than Google Vision. We show the details of the comparison in Section 3.2. We pick Amazon Rekognition as the preferred and suitable candidate for object detection in our work.
2.3
Image Captioning
Automatically generating image descriptions has been receiving much attention, due to the recent advances in computer vision and natural language processing [11], using deep learning. Karpathy et al. [21] present a model for generating natural language descriptions of images and their regions. Their model uses a combination of Convolutional Neural Networks (CNNs) over image regions, bidirectional Recurrent Neural Networks over sentences, and a structured objective that aligns the two modalities through a multi-modal embedding [33]. You et al. [39] use a novel method for image captioning, that achieves state-of-the-art performance across many popular benchmarks. Their method combines top-down (images to words conversion) and bottom-up (combining word description of various aspects of images) strategies, and couples them with a Recurrent Neural Network to detect rich semantic attributes from the image.
2.4
GIVE-2 Corpus
Byron et al. [6] present a challenge, Giving Instruction in a Virtual Environment (GIVE), where participants solve a task in a virtual 3D environment, guided by a Natural Language Generation (NLG) [35] system. The challenge aims to target various sub-domains of NLG such as referring-expression generation, aggregation, grounding, realization, and user modeling. Gargett et al. [16] present a new corpus of human instruction that aims to support the development of NLG systems for the GIVE challenge. The IG provides typed instructions and the IF uses the virtual environment to navigate through it and complete a task. They analyze the corpus and annotate referring-expressions to gain linguistic insights. For example, they annotate “button” or “square” as a Taxonomic property, “red” or “yellow” as an Absolute Property, “by the chair” or “next to the plant” as a Micro-level landmark intrinsic, etc. A major portion of our work involves gathering data about interactions between humans with the goal of navigating indoor environments, we use the GIVE-2 corpus strategy to manage our data for further usage during the data analysis phase.
2.5
Interactive Dialogue and Knowledge Acquisition
as an autonomous robot. This motivates the use of human interaction dialogue as the major driver for detecting saliency of entities that are being referred to in such interactions.
CHAPTER 3
DATA COLLECTION
Previous work in saliency detection (presented in Chapter 2) has mainly used just the computer vision approach. As discussed in Chapter 2, most of these projects do not consider using human dialogue data to identify saliency, partly due to the absence of such data. To overcome these shortcomings, our approach first involves gathering human dialogue data and combining it with a dataset of objects detected by using an image analysis application.
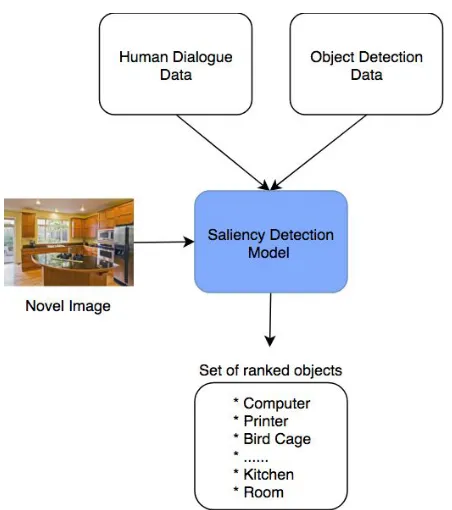
Our approach is depicted in Figure 3.1. The first phase of our work involved developing a web application that allows people to work in pairs and talk about indoor images. We used Amazon Mechanical Turk (AMT) [2] to launch the web application and get access to a diverse and on-demand workforce. The details and setup of this step are explained in Section 3.1. After gathering human dialogue data, we used an image analysis application, Amazon Rekognition [1], to construct another dataset of objects present in the same indoor images as used in the first step. The analysis of the two datasets is presented in Chapter 4.
Figure 3.1: Overview of the saliency detection process
based on a saliency score. We present the details of this step in Chapter 5.
3.1
Dialogue Data Collection
In this section, we present the first phase of our work in which we gathered the human interactive dialogue data based on a task. We used this data to help us identify the aspects of an indoor scene that humans consider as salient to their conversation. We submitted an Institutional Review Board (IRB) application to approve the data collection. The target age group for the gathering data were adults. An overview of the process is shown in Figure 3.2.
The data collection process consists of the following steps:
(a) Develop web application and configure the hosting environment
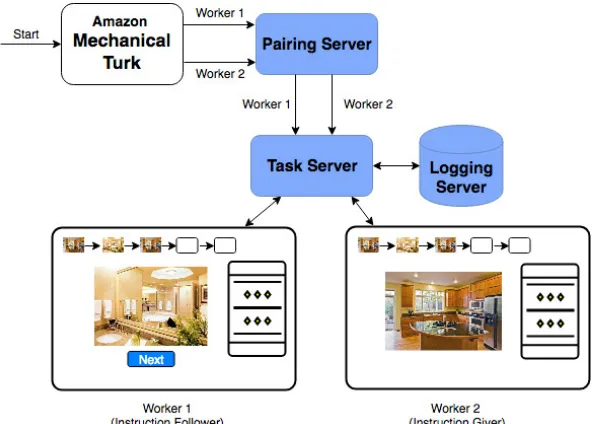
Figure 3.2: Overview of the human dialogue data collection process
(c) Pair workers and assign roles
(d) Present the task
(e) Log data and Human Intelligence Task (HIT) Submission
In the next subsections, we present details of the above steps.
3.1.1 Web application and Hosting environment
reason behind creating three separate servers was based on their individual and unique responsibilities. This approach adds useful abstraction and structure to the entire web application. It also helped us in localizing errors and debugging the application. Another major reason behind this approach was that there are many web application, such as ours, that require data from a pair of users. Creating a separate pairing server allows anyone to swap the actual task, while the pairing logic remains the same.
We used Nodejs, a popular Javascript framework, to develop the pairing and task servers. We used Java and a PostgreSql database to develop the logging server. To host these servers we used Heroku, a web application deployment cloud platform. Heroku provides an excellent alternative to creating our own hosting environment.
3.1.2 Amazon Mechanical Turk
the web address of the custom application. Once the HIT is configured and launched, workers can start accepting the HIT and proceed with the task.
Figure 3.3: Key aspects of Amazon Mechanical Turk1
3.1.3 Pairing Workers and Assigning Roles
Figure 3.4 shows the process of pairing workers and assigning roles. After the workers accept the HIT, they enter into an Unready Queue. Once they agree to our terms and conditions, they enter into the pool of workers (Ready Queue) that are ready to be paired. Pairs are created in First-In, First-Out order. Since there is no guarantee for instant availability of a partner for a pair to be created, we set up a wait time of 20 seconds. If the timer expires, the worker has an option to restart the timer and
wait while another worker becomes available. After a pair is created, each worker in the pair is assigned one of the two roles: Instruction Giver (IG) and Instruction Follower (IF), and are presented with the actual task. As shown in the Figures 3.5 and 3.6, both of them have access to a chat area, a current image area, and a list of images that have been found so far. Only an IF has access to a button that allows them to change the current image.
Figure 3.4: Pairing of workers and assigning roles
3.1.4 The Task
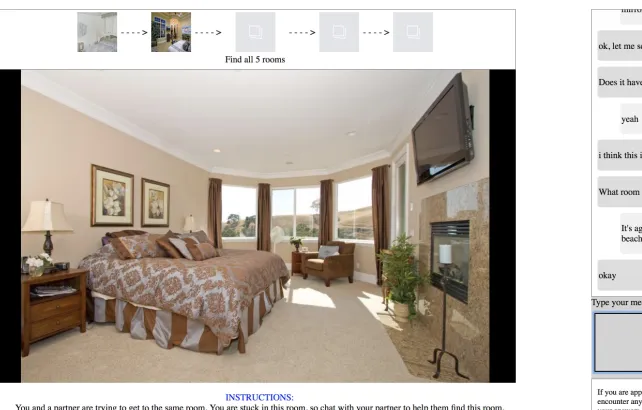
the IF. The IF based on the information received from the IG, navigates through the set of scenes, and tries to find the scene IG is describing.
Figures 3.5 and 3.6, show the actual user interface of the task for data collection. The task involves a pair of workers working together to find a set of images that the IG is currently looking at. We set the number of images to find to 5. The IG can only chat with the IF about the image they are currently looking at. IF, based on the information provided by IG, navigates through the list of images to find the right image (i.e, what IF thinks IG is currently looking at). After they have found a set of 5 images, the task is reset with a new set of images.
For data collection, we limited the indoor images to four room types: Bathroom, Bedroom, Kitchen, and Living room. During one task, each set of images is picked from a pool of images of same type. The reason behind this is that we are interested in objects in the image, and want the participants to spend limited time talking about room types.
Figure 3.6: Example Instruction Giver View
3.1.5 Logging and HIT Submission
As workers proceed through the task, we log key events to the database. We store the following information that is necessary for data analysis and evaluation.
• Room configurations (set of images of a room type) per pair
• Chat messages and the active image at the time of sending a message • Navigation information (Changing an image)
• Unique identifiers associated with Workers and HITs • Task completion status
3.2
Object Detection
This is the second phase of our proposed approach where we extracted objects present in the same set of images used in the first phase. We need this data to automate the process of saliency detection. We had a choice between using a desktop object detection software or an online image analysis application. We chose the latter approach, as it requires less setup time, and speeds up the process of object detection, by using powerful cloud services. Currently, we have two such image content analysis services: Google Cloud Vision and Amazon Rekognition. To pick the right service among the two, we ran tests on them based on some images.
Figure 3.7: A sample bathroom image
(a) Amazon Rekognition Output (b) Google Vision Output
Figure 3.8: Comparison of the two cloud image content analysis services
Amazon Rekognition outperforms Google Cloud Vision, by finding more objects that could not be found by the latter.
As seen in Figure 3.8, Amazon Rekognition is able to detect labels related to the flower and the vase that holds it. Google Vision fails to detect these objects. Based on the manual comparison of output for few images, we chose Amazon Rekognition as the service for detecting objects from the set of images. In addition to detected object labels, we get a Confidence score (in percentage scale), with which the system detected those labels.
CHAPTER 4
DATA ANALYSIS
In this chapter, we provide some analysis for better understanding of the collected dataset. The number of participants in the data collection task was 24.
4.1
Participant Analysis
Based on the collected dataset, we analyze various participant related activities, such as average number of times a participant did tasks, average chat turns per participant, and average number of words per chat turn.
4.1.1 Task participation
To calculate the average number of times a participant did tasks, we filter out completed tasks and ignore the ones that were in progress (i.e, a participant left a task before the time ran out). We group the tasks completed by participants based on theirworker id, and take an average. We find that, on average, a worker completed 1.875 tasks in the 20 minute duration allocated for a session.
4.1.2 Chat turns per participant
We find that, on average, a worker takes 16.05 turns while conversing with their partner.
4.1.3 Number of words per chat turn
Finally, we look at the average number of words used by participants per chat turn. We remove punctuations and split the messages into individuals words. We group these words per participant’s turn, and take an average of the number of words used. We find that, on average, a participant writes 7.11 words per chat turn.
4.2
Image coverage, token count, vocabulary
From the set of 150 images, we were able to collect descriptions of 72 images through the data collection task. After removing stop words and punctuations, the data has a token count of 451. The unique set of words (i.e, the vocabulary) of the data is 344. Figure 4.1 shows the sentence level distribution of the image descriptions. As shown in the figure, indicated by the horizontal blue line, the average number of descriptions per image is 4.46.
Figure 4.1: Distribution of image descriptions
4.3
Image and Text Summarization
We summarized descriptions of an image, to show how people talked about the image. Figure 4.3 shows a living room with a bear statue. Figure 4.4 shows the descriptions for the image. People mentioned things like: “plaid couch”, “bear”, “wicker coffee table”, “bass fish”. For brevity, we only show the top five and bottom five rows of
descriptions supplied by people for this image ordered by their entry in the database.
Figure 4.3: A sample living room
4.4
Temporal based Image Similarity
We analyzed the correlation between image similarity and the amount of time the Instruction Follower spends looking at a potential target image, the image the Instruc-tion Giver is currently looking at. For this, we use the logged navigaInstruc-tion informaInstruc-tion that keeps track of a user clicking the “Next Image” button to get a new image. We calculated the time interval between successive clicks. We ignored the first time interval, due to the fact that as soon the task starts, the Instruction Follower waits for the Instruction Giver to provide some descriptions of the current target image. Hence, we considered the second highest time interval. Figure 4.5 shows two such rooms that have second highest time interval.
(a) Living room 1 (b) Living room 2
Figure 4.5: Two living rooms
(a) Living room 1 (b) Living room 2
Figure 4.6: Two living rooms
4.5
Object detection label and confidence distribution
For object detection, we ran image content analysis on all 150 images and got cor-responding labels. Figure 4.7 shows the line plot of detected object labels for each room type. The words with highest frequency correspond to the type of the room and common objects found in such room type. For example, we have highest frequency of words such as“kitchen,” “oven,” “bedroom,” “bed,” “living room,” “couch”.
As discussed in Section 3.2, the object-detection service Amazon Rekognition provides us detected object labels and the confidence with which it detects those objects. Figure 4.8 shows a line plot of the top-10 object labels with highest con-fidences. Similar to the top 10 label plot in Figure 4.7, the top object labels with highest confidence correspond to the room type and common objects found in that room type.
Figure 4.7: Top 10 detected object labels for each room type
4.6
Dialogue vs Object Detection Data
We hypothesize that, while talking about indoor scenes, people mention unique objects more than commonly occurring objects in those scenes and that we can predict salient objects using just the object detection data by ordering the detected object labels in ascending order of frequency.
We also assumed that to support our hypothesis, if we calculated the probabil-ity distribution of the dialogue data and ordered the objects in ascending order of probability, then we would get unique objects at the top of the list and common objects near the bottom of the list. To support our hypothesis, the two probability distributions should be just the opposite and hence have higher divergence between each other.
CHAPTER 5
EXPERIMENT
In this chapter, we present our approach for developing models that assist in saliency detection. We combine the human dialogue data and object detection data to develop the models. We then use Mean Reciprocal Rank metric to evaluate our approach. At the end of the chapter, we present the results of our approach.
5.1
Methodology
To conduct experiments on the datasets, we first perform some data processing tasks. This process transforms the raw data into a format that is more appropriate and valuable for creating models and evaluating them. We perform basic natural language processing tasks on the human dialogue data, such as: splitting free-form sentences to unigrams (single words), removing punctuation and stop words, and extracting nouns. Since we are interested in just the objects present in an image, this process extracts nouns that corresponds mostly to those objects. We do not need to perform any additional data processing on the object detection data, as the output of the object detector contains only objects recognized from an image.
that affects performance. We present the details of the feature selection process, using ablation analysis in Section 5.3. One of the limitations of the human dialogue dataset is its small size, and the sparsity of objects present in images. Because of the small size of the dataset, we use a cross-validation test [36] to evaluate the models. Cross-validation is a rotation estimate, where a part of the data (subset) is left out for testing, while the rest of the data is used for training the model. This process is repeated until all of the data has been used for generating test subsets. For our dataset, we use a special case of cross-validation technique, called “leave-one-out cross-validation”, where we filter objects related to one particular image, and train
on the rest of the dataset. We repeat this process until all of the images have been used as test data. For the evaluation, we use the human dialogue data as the actual outcome, to compare against the predicted outcomes.
5.2
Evaluation Metric
The saliency detection model produces a ranked list of objects as predictions. We use Mean Reciprocal Rank (MRR) [38] as the most suitable measure for evaluating such a ranked list. In general, MRR is a statistical measure for evaluating any model that produces a list of possible outcomes, ordered by probability of correctness. We calculate MRR as:
M RR= 1 |Q|
|Q|
X
i=1
1 ranki
(5.1)
where ranki refers to the rank of position of the first relevant object
5.3
Feature Selection and Model Development
A dataset can contain many features that can be used to develop machine learning models. A good understanding, and careful selection, of such features can lead to models that perform better while predicting outcomes. The process of feature selection begins with feature engineering, where we transform raw data into features that better represent the underlying problem to the predictive models. Once we have such features, we can start using a combination of them, to build the models and eventually evaluate them.
The human dialogue dataset has features such as“room type”,“active image”, and “sent text”. A“room type” indicates one of the types (e.g kitchen) an image belongs to. An “active image” is an image that the Instruction Follower or Instruction Giver is looking at while they converse. We call each sentence, complete or incomplete, communicated between the two users as “sent text”. We use these features to build a language model, which is a probability distribution over sequences of words. We develop a language model in which the probability of each word only depends on that word’s own probability in the dataset. This model is a unigram language model, because it provides the probability of a word
The object-detection dataset has two features: confidence andobject. Aconfidence is associated with each object and represents the level of confidence that an image contains the object. The confidence of a detected object ranges from 0 to 100%. We average the confidences of an object per room type to get another feature called Average Confidence. Similar to the language model described above, we calculate
To develop the saliency detection model, we use a combination of average con-fidence, object model, and language model. In the next subsections, we describe different ways we carried out the model development process.
5.3.1 Baseline Model (Confidence Only)
In this model, we consider the confidence of an object in the image and the average confidence of the object in the entire object-detection dataset. As shown in Equation 5.2, we multiply these two values to get a new score, and rank the objects based on descending value of the new score. We hypothesize that an object should be ranked based on its average presence in the dataset.
score=conf idence×average conf idence (5.2)
Figure 5.1 shows a ranked list of object labels of an image, based on the confidence model. As shown in the figure, we can observe that even though“monitor” has a low confidence value (79.80), its average confidence (96.17) increases its rank in the list.
Next, we calculate the metric, MRR, for each image in the object-detection dataset. As described in Section 5.2, we perform a cross-validation test on the dataset, in which we leave one image out as the test image, and use rest of the images to build the confidence model. We repeat this process until all images have been used as test images.
Figure 5.1: Ranking of objects based on the confidence model
Figure 5.2: Evaluation of the confidence based model
5.3.2 Ablation Analysis of Models
combination of the baseline, object, and language model parameters.
Confidence and Object Model
First, we combine the baseline and object models. The object model takes into account the probability of objects present in the images. We carry out the cross-validation approach and use the Equation 5.3 to calculate the new ranking scores.
score=conf idence×average conf idence×object probability (5.3)
Figure 5.3 shows the result of this approach. We see an increase in MRR with a value of 0.032.
Figure 5.3: Evaluation of the confidence and object based model
Confidence and Language Model
score=conf idence×average conf idence×language probability (5.4)
As shown in Figure 5.4, the language model significantly improves the Reciprocal Rank. The Reciprocal Rank of 1 indicates that the first relevant prediction is at the top of the ranked list. When we take the average, the MRR increases to 0.136.
Figure 5.4: Evaluation of the confidence and language based model
Object and Language Model
In this approach, we take out the baseline (confidence) model, and use just the probability distribution of both object and language models. We use Equation 5.5 to calculate the new scores for the object labels.
Figure 5.5 shows the result of this approach. The MRR (0.032) is similar to the approach where we excluded the language model and used just confidence and object models. This indicates that inclusion of the object model does not improve the result.
Figure 5.5: Evaluation of the object and language based model
Confidence, Object, and Language Model
In this approach, we use all the models, and find that the results are similar to the approach where we used just the confidence and language model. We use Equation 5.6 to calculate the new scores for the object labels.
Figure 5.6: Evaluation of the confidence, object, and language based model
Language Model
Finally, we look at the effect of using just the language model for saliency detection. The score of an object is determined by the probability of finding that object in the language model. For this model, we use Equation 5.7.
score=language probability (5.7)
Figure 5.7: Evaluation of language based model
5.4
Results
In this section, we compare the results of the ablation analysis approach, where we iteratively picked a subset of features while developing the saliency detection model. Table 5.1 shows the result of various ways we developed the model.
MRR
Baseline (Confidence) Model 0.018 Confidence + Object Model 0.032 Confidence + Language Model 0.136 Object Model + Language Model 0.032 Confidence + Object + Language Model 0.136
Language Model 0.536
Table 5.1: Comparison of different saliency models
our work is to automate the process of saliency detection, we cannot completely rely on the object-detection output. This necessitates human dialogue data. We also used the object model, in combination with confidence and language model for predicting ranks of objects, but it does not improve the accuracy and rank. Use of a language model adds the missing information, and increases both the accuracy and rank of the prediction. We can see from the Figure 5.8 that, by using the language model alone, the MRR increases significantly.
Figure 5.8: MRR values for different models
CHAPTER 6
CONCLUSION
Automated systems are ubiquitous. A special class of such automated systems com-municate with humans using natural language. The generation of natural language involves a lot of effort on such systems part. Thus, an essential aspect of natural language generation involves figuring out what to say. This formed the overarching goal of our thesis: determining what to say about something, in our case, an indoor image.
We introduced the term saliency to refer to things that humans consider important in their daily conversation. We then began laying the ground work for saliency. We discussed that saliency is an integral part of human-to-human communication. We also differentiated between salient objects and attributes. Most of the existing research done on saliency detection focuses on taking the computer-vision (object-detection) approach. They fail to take into account that in order to develop human like intelligence in saliency detection systems we have to analyze, and learn from, how humans communicate. We presented such research efforts in Chapter 2.
to an on-demand workforce that would help us in our data-collection task. We called this dataset the Human Dialogue Dataset. Since our goal was to automate the process of saliency detection, we used the Amazon Rekognition API to detect objects present in images. We called this dataset the Object Detection Dataset. After getting these two datasets, we performed an analysis on the datasets, as presented in Chapter 4.
Based on these two datasets, we developed the saliency detection model. We used ablation analysis to pick features that identify the most salient objects, and we used a cross-validation technique to verify our predictions. We learned from the experiment and evaluation that language models are very informative while building the saliency detection model. This helps us conclude that computer vision techniques for object detection alone cannot achieve better performance. We need to look at, and learn from, how humans communicate, and integrate that knowledge, to train and develop the models.
6.1
Limitations and Future Work
This thesis lays the ground work for a human dialogue based approach for building saliency detection models. We believe that we have carried out an initial investigation for the long-term goal of building intelligent systems that have some, if not all, char-acteristics of how humans communicate, and what they consider important in their communication. However, there any some limitations, and room for improvement, to our approach.
investiga-tion into saliency detecinvestiga-tion, is very sparse. The reason behind this is that we launched the data collection task in multiple iteration. After each iteration, we analyzed the collected data and the issues with our web application. Since our primary focus was to confirm the correctness of the data collection task (i.e, tasks assigned to IG and IF as described in Section 3.1), most of our efforts were dedicated to improving the task correctness. Furthermore, launches of each iterations in AMT are very time consuming. Considering the short time period for the project, we were satisfied with the data collected. We believe that in the future iterations, we can collect large amount of data and utilize the most important benefit of using AMT, which is having access to a large number of participants in a short amount of time.
Second, we were able to get descriptions of only half of the images during the human dialogue data-collection process. This gives us a very sparse dataset, and it affects the knowledge we have about some room types. Furthermore, our approach considers static 2d images, however we imagine that an interactive 3D virtual indoor environment with 360-degree navigation would create a more natural setting for human conversation. This can add diverse information to the dataset, and help us better understand the human communication process. We found in Chapter 4 that, in addition to objects, humans also mention colors of objects. Current object-detection systems detect only objects from images. We find that it limits the output of the saliency detection model. An object-detection system that can detect objects along with the color of those objects would help in creating more realistic saliency detection models.
REFERENCES
[1] Amazon. Amazon rekognition video and image - aws. https://aws.amazon. com/rekognition, 2016. [Online; accessed 1-May-2018 ].
[2] Amazon. Amazon mechanical turk. https://www.mturk.com/mturk/welcome, 2017. [Online; accessed 24-September-2017 ].
[3] J. Bao, Y. Jia, Y. Cheng, and N. Xi. Saliency-guided detection of unknown objects in rgb-d indoor scenes. Sensors, 15(9):21054–21074, 2015.
[4] A. C. Berg, T. L. Berg, H. Daume, J. Dodge, A. Goyal, X. Han, A. Mensch, M. Mitchell, A. Sood, K. Stratos, et al. Understanding and predicting importance in images. In Computer Vision and Pattern Recognition (CVPR), 2012 IEEE Conference on, pages 3562–3569. IEEE, 2012.
[5] A. Borji, M.-M. Cheng, H. Jiang, and J. Li. Salient object detection: A benchmark. IEEE Transactions on Image Processing, 24(12):5706–5722, 2015. [6] D. Byron, A. Koller, J. Oberlander, L. Stoia, and K. Striegnitz. Generating
instructions in virtual environments (give): A challenge and an evaluation testbed for nlg. Position Papers, page 3, 2007.
[7] M.-M. Cheng, N. J. Mitra, X. Huang, P. H. Torr, and S.-M. Hu. Global contrast based salient region detection. IEEE Transactions on Pattern Analysis and Machine Intelligence, 37(3):569–582, 2015.
[8] H. H. Clark. Using language. Cambridge university press, 1996.
[9] J. Deng, A. C. Berg, K. Li, and L. Fei-Fei. What does classifying more than 10,000 image categories tell us? In European conference on computer vision, pages 71–84. Springer, 2010.
[10] L. Duan, C. Wu, J. Miao, L. Qing, and Y. Fu. Visual saliency detection by spatially weighted dissimilarity. In Computer Vision and Pattern Recognition (CVPR), 2011 IEEE Conference on, pages 473–480. IEEE, 2011.
[12] M. Everingham, L. Van Gool, C. K. Williams, J. Winn, and A. Zisserman. The pascal visual object classes (voc) challenge. International journal of computer vision, 88(2):303–338, 2010.
[13] A. Farhadi, M. Hejrati, M. A. Sadeghi, P. Young, C. Rashtchian, J. Hockenmaier, and D. Forsyth. Every picture tells a story: Generating sentences from images. In European conference on computer vision, pages 15–29. Springer, 2010.
[14] C. Fawcett and H. H. Hoos. Analysing differences between algorithm configura-tions through ablation. Journal of Heuristics, 22(4):431–458, Aug 2016.
[15] P. F. Felzenszwalb, R. B. Girshick, D. McAllester, and D. Ramanan. Object detection with discriminatively trained part-based models. IEEE transactions on pattern analysis and machine intelligence, 32(9):1627–1645, 2010.
[16] A. Gargett, K. Garoufi, A. Koller, and K. Striegnitz. The give-2 corpus of giving instructions in virtual environments. In LREC, 2010.
[17] Google. Vision api - image content analysis — google cloud. https://cloud. google.com/vision, 2016. [Online; accessed 1-May-2018 ].
[18] J. G¨otze and J. Boye. Deriving salience models from human route directions. In Workshop on Computational Models of Spatial Language Interpretation and Generation 2013 (CoSLI-3), pages 36–41, 2013.
[19] J. G¨otze and J. Boye. Learning landmark salience models from users route instructions. Journal of Location Based Services, 10(1):47–63, 2016.
[20] L. Itti. Visual salience. Scholarpedia, 2(9):3327, 2007. revision #72776.
[21] A. Karpathy and L. Fei-Fei. Deep visual-semantic alignments for generating image descriptions. In Proceedings of the IEEE Conference on Computer Vision and Pattern Recognition, pages 3128–3137, 2015.
[22] C. Kennington, S. Kousidis, and D. Schlangen. Situated incremental natural language understanding using a multimodal, linguistically-driven update model. In COLING, pages 1803–1812, 2014.
[23] C. Kennington and D. Schlangen. A simple generative model of incremental reference resolution for situated dialogue. Computer Speech & Language, 41:43 – 67, 2017.
[25] G. Kulkarni, V. Premraj, V. Ordonez, S. Dhar, S. Li, Y. Choi, A. C. Berg, and T. L. Berg. Babytalk: Understanding and generating simple image descriptions. IEEE Transactions on Pattern Analysis and Machine Intelligence, 35(12):2891– 2903, 2013.
[26] S. Li, G. Kulkarni, T. L. Berg, A. C. Berg, and Y. Choi. Composing simple image descriptions using web-scale n-grams. InProceedings of the Fifteenth Conference on Computational Natural Language Learning, pages 220–228. Association for Computational Linguistics, 2011.
[27] Y. Lin, F. Lv, S. Zhu, M. Yang, T. Cour, K. Yu, L. Cao, and T. Huang. Large-scale image classification: fast feature extraction and svm training. InComputer Vision and Pattern Recognition (CVPR), 2011 IEEE Conference on, pages 1689– 1696. IEEE, 2011.
[28] V. Mast and D. Wolter. A probabilistic framework for object descriptions in indoor route instructions. In International Conference on Spatial Information Theory, pages 185–204. Springer, 2013.
[29] M. Poesio, R. Vieira, and S. Teufel. Resolving bridging references in unrestricted text. InProceedings of a Workshop on Operational Factors in Practical, Robust Anaphora Resolution for Unrestricted Texts, pages 1–6. Association for Compu-tational Linguistics, 1997.
[30] D. M. Ram´ık, C. Sabourin, and K. Madani. Autonomous knowledge acquisition based on artificial curiosity: Application to mobile robots in an indoor environ-ment. Robotics and Autonomous Systems, 61(12):1680–1695, 2013.
[31] C. Rashtchian, P. Young, M. Hodosh, and J. Hockenmaier. Collecting image annotations using amazon’s mechanical turk. In Proceedings of the NAACL HLT 2010 Workshop on Creating Speech and Language Data with Amazon’s Mechanical Turk, pages 139–147. Association for Computational Linguistics, 2010.
[32] J. Redmon, S. Divvala, R. Girshick, and A. Farhadi. You only look once: Unified, real-time object detection. InProceedings of the IEEE Conference on Computer Vision and Pattern Recognition, pages 779–788, 2016.
[34] Wikipedia. Salience (language) — wikipedia, the free encyclope-dia. https://en.wikipedia.org/w/index.php?title=Salience_(language) &oldid=742242302, 2016. [Online; accessed 25-September-2017 ].
[35] Wikipedia. Natural language generation — wikipedia, the free encyclo-pedia. https://en.wikipedia.org/w/index.php?title=Natural_language_ generation&oldid=799115735, 2017. [Online; accessed 25-September-2017 ]. [36] Wikipedia contributors. Cross-validation (statistics) — Wikipedia, the
free encyclopedia. https://en.wikipedia.org/w/index.php?title= Cross-validation_(statistics)&oldid=842330476, 2018. [Online; accessed 24-May-2018].
[37] Wikipedia contributors. Kullbackleibler divergence — Wikipedia, the free ency-clopedia. https://en.wikipedia.org/w/index.php?title=Kullback%E2%80% 93Leibler_divergence&oldid=841550520, 2018. [Online; accessed 22-May-2018].
[38] Wikipedia contributors. Mean reciprocal rank — Wikipedia, the free encyclo-pedia. https://en.wikipedia.org/w/index.php?title=Mean_reciprocal_ rank&oldid=836228058, 2018. [Online; accessed 24-May-2018].
[39] Q. You, H. Jin, Z. Wang, C. Fang, and J. Luo. Image captioning with semantic attention. In Proceedings of the IEEE Conference on Computer Vision and Pattern Recognition, pages 4651–4659, 2016.
[40] B. Zhou, H. Zhao, X. Puig, S. Fidler, A. Barriuso, and A. Torralba. Se-mantic understanding of scenes through the ade20k dataset. arXiv preprint arXiv:1608.05442, 2016.