R E S E A R C H
Open Access
Structural equation modeling to identify
the risk factors of diabetes in the adult
population of North India
Jaya Prasad Tripathy
1,2, J S Thakur
3*, Gursimer Jeet
3and Sanjay Jain
3Abstract
Background:A non-communicable disease risk factor survey (based on World Health Organization STEP approach
to Surveillance, i.e., WHO-STEPS) was done in the state of Punjab, India in a multistage stratified sample of 5127 individuals. The study subjects were administered the WHO STEPS questionnaire and also underwent anthropometric and biochemical measurements. This study aimed at exploring the risk factors of diabetes using a Structural Equation Modeling (SEM) approach in the North Indian state of Punjab.
Results:Overall prevalence of diabetes mellitus among the study participants was found out to be 8.3% (95% CI 7.3–9.4%). The final SEM had excellent fit considering the model parameters. The following risk factors deemed to have a direct statistically significant effect on blood sugar status: family history of diabetes (4.5), urban residence (3.1), triglycerides (0.46), increasing waist circumference (0.18), systolic blood pressure (0.11), and increasing age (0.05). There are specific indirect effects of alcohol use (1.43,p= 0.001), family h/o diabetes (0.844,p= 0.001), age (0.156,p< 0.001), waist circumference (0.028,p= < 0.001) and weekly fruit intake (−0.009,p= 0.034) on fasting blood glucose. Indirect effects of waist circumference, alcohol intake and age on blood sugar levels are mediated by raised blood pressure. Waist circumference mediates the indirect effects of age, family h/o of diabetes, alcohol intake and weekly fruit intake on blood sugar levels. Triglycerides also mediated the indirect effects between age and diabetes.
Conclusions:Family history of diabetes, urban residence, alcohol use, increasing age, and waist circumference are the key variables affecting diabetes status in the Indian population. The results of this study further strengthens the evidence that lifestyle changes in the form of physical activity and healthy diet are required to prevent and control diabetes. Those with family h/o diabetes constitute a high risk group and should be targeted with regular screening and lifestyle intervention package.
Keywords:Diabetes, epidemiology, STEPS survey, Waist circumference, Family history of diabetes, Structural equation modeling, Blood glucose
Background
Globally, in 2017 around 425 million adults aged 20–79 years had diabetes mellitus, and this number is ex-pected to rise to 629 million by 2045 [1]. More than three-fourth of the subjects with diabetes belongs to low-and middle-income countries (LMICs). In the South-East Asian region, current estimates indicate that 8.5% of the adult population has diabetes which is likely to increase to 11.1% by 2045. The region has the second highest number
of deaths attributable to diabetes among the seven regions with 1.1 million deaths estimated in 2017 [1].
Diabetes is growing at an alarming pace in India due to the rise in various risk factors in both urban and rural areas [2]. India is home to more than 74 million people with diabetes which is second only to China [1]. The burden of diabetes mellitus continues to increase and is primarily driven by nutrition, lifestyle and demographic transitions, unhealthy dietary habits, and physical in-activity, in the context of a stronger genetic predispos-ition to diabetes [3]. Against this background, a better understanding of the changing epidemiology of diabetes in India is required.
* Correspondence:[email protected]
3Post Graduate Institute of Medical Education and Research, Chandigarh,
India
Full list of author information is available at the end of the article
Diabetes mellitus is a condition caused by the complex interplay of various factors simultaneously with some having direct and some having indirect (i.e., mediator) effects. Several risk factors have been associated with type 2 diabetes: age, obesity, high blood pressure, lipid abnormalities, family history of diabetes, unhealthy diet, and physical inactivity [1, 4, 5]. Most available literature used traditional regression models which allow us to treat each covariate in the model as an independent dir-ect effdir-ect on diabetes. Very few studies have examined all these factors simultaneously as a network of multiple pathways leading to diabetes [6].
Structural equation modeling (SEM) or path analysis is a very powerful multivariate technique that enables measurement of both direct and indirect effects of vari-ables and incorporate models with multiple dependent variables by using several regression equations simultan-eously [7]. Thus, the present study employed SEM to test a hypothesized model of variables affecting diabetes status in the North Indian adult population using data from a large representative household survey.
Methods Study design
This study analyses data from a large household survey con-ducted in the state of Punjab, India using WHO-STEPwise approach to surveillance (STEPS) approach [8].
Study setting
The survey was carried out in Punjab, which is a pros-perous state in the northern part of India bordering Pakistan with a population of 27 million according to 2011 national census. It ranks higher than most other states in terms of Human Development Index with a per capita income twice that of the national average [9,10].
Study sampling strategy
A state-wide non-communicable disease (NCD) risk factor survey based on WHO-STEPS approach was undertaken in Punjab in 2014–2015. The survey adopted a multistage stratified sampling approach using the 2011 census sam-pling frame. A three-stage design was employed in urban areas whereas in rural areas a two-stage sampling design was followed. A total of 100 primary sampling units (PSUs) were selected (60 villages from rural areas and 40 Census Enumeration Blocks from urban areas) by probability pro-portional to size (PPS) method. From each selected PSU, 54 households were selected using systematic random sampling. The ultimate sampling units were the house-holds and one individual in the age group of 18–69 years residing in the selected household was selected using the KISH method. The details of the methodology can be found in another paper [11].
Data collection instrument
A culturally adapted,Punjabi(local language) translated and pre-tested version of the WHO STEPS question-naire (version 3.1) was used with minor adaptations [12]. As part of the household survey, sociodemographic and behavioral information on tobacco and alcohol use, diet, physical activity, history of chronic diseases, family his-tory of chronic conditions, health screening, and health care expenditure were collected in step 1. Physical mea-surements such as height, weight, blood pressure, and waist circumference were done in step 2. Biochemical tests were conducted to measure fasting blood glucose, total cholesterol, and triglycerides in step 3.
Data collection and operational definitions used
A team of trained investigators collected the survey data. SECA adult portable stadiometer was used to measure height after removing shoes, socks, slippers, and any head gear. It was measured in centimeters up to 0.1 cm. SECA digital weighing scale was used to measure weight of the individuals. The scale was regularly calibrated against a standard weight. The participants were asked to remove footwear and socks, and weight was recorded in kilograms up to 0.1 kg. Waist circumference was mea-sured using a SECA constant tension tape to the nearest 0.1 cm at the level of the midpoint between the inferior margin of the last rib and the iliac crest in the mid-axillary plane. The measurement was taken at the end of a normal expiration with the arms relaxed at the sides.
One serving of vegetable was considered to be one cup of raw green leafy vegetables or 1/2 cup of other vegetables (cooked or chopped raw). One serving of fruit was considered to be one medium size piece of apple, banana, or orange; 1/2 cup of chopped, canned fruit; or 1/2 cup of fruit juice.
servings of fruits and vegetables, and salty food intake. Obesity was defined as a BMI≥27.5 kg/m2for both gen-ders (based on the World Health Organization Expert Consultation for Asian populations) [14]. Abdominal obesity was defined as a waist circumference≥90 cm for men and≥80 cm for women [15].
For blood pressure measurement, electronic equipment (OMRON HEM 7120, Omron Corporation, Kyoto, Japan) was used. After resting for 5 min, blood pressure was re-corded in the sitting position in the right arm supported at the level of the heart. Three blood pressure measure-ments were taken at 3 min interval each. The final reading was recorded as the average of last two readings.
Biochemical measurements (step 3): every alternate in-dividual (50%) of the initial sample was subjected to bio-chemical assessment. For blood glucose, dry chemistry method was used by blood glucose measurement device (Optium H, Freestyle). For lipid profile, i.e., cholesterol and triglycerides measurements, blood samples were drawn on individuals after 10–12 h fasting. 5 ml of ven-ous blood was taken in sitting position, was centrifuged immediately to separate serum, and was transferred under cold chain condition to the Central Reference Laboratory of Department of Biochemistry, Post Graduate Institute of Medical Education and Research, Chandigarh, India which is a tertiary medical care institute.
Laboratory measurement of total cholesterol and trigly-ceride was made on Modular P 800 autoanalyzer (Roche Diagnostics, Germany) using commercially available kits (Roche Diagnostics, Germany). Hypertriglyceridemia was defined as serum triglyceride levels ≥150 mg/dl (≥1.7 mmol/l) [16].
Sample size
Taking the estimated prevalence of physical activity as 50%, 5% margin of error and 95% confidence interval, a design ef-fect of 1.5, a sample size of 4609 was derived which was ad-equate to present results by two age groups (18–44, 45–69), both sexes (male, female) and residence (urban, rural). As-suming a response rate of 85%, sample size was raised to 5400 for this study. Every second individual was subjected to step 3, i.e., biochemical assessment. Out of 2700 re-spondents eligible for step 3, 2499 (93%) gave consent to blood sampling for biochemical assessment.
Statistical analysis
The conceptual a priori model that specifies the relations among variables operationalized in this study is based on the model proposed by Bardenheier et al [17]. We used structural equation modeling withpath analysis, which in-cludes the direct and indirect effects of factors previously re-ported to be associated with diabetes (Fig.1). Direct effects are depicted as an arrow originating from an independent variable (exposure) leading and pointing to a dependent
variable (outcome). For example, see the arrow between waist circumference and systolic blood pressure. An indirect effect is not only depicted as a mediating variable having an arrow pointing to it from an independent variable but also pointing to yet another dependent variable. For example, waist circumference mediates the effect of alcohol intake on blood sugar levels. A confounder, according to the use of these arrows, is depicted as a variable with direct effects on both the exposure and the dependent variable.
In this study, we report standardized path coefficients, their standard errors and p values. As indices of the models’statistical fit to the data, we used standard criteria, including comparative fit index (CFI) > 0.90, root mean square error of approximation (RMSEA) < 0.08, and the standardized root mean square residual (SRMSR) < 0.06. Model building and estimation was done using STATA/IC version 12 (StataCorp LP, USA).
Variables assessed in SEM
We selected the sociodemographic, behavioral, anthropo-metric, and metabolic variables to be included in our SEM based on a literature review of previous theoretical models of diabetes. We assessed 13 variables including age (in years), sex, residence (rural and urban), highest level of education (no formal schooling, up to primary school-ing, up to secondary schoolschool-ing, up to higher secondary, graduate, and postgraduate degree), marital status (never married, currently married, divorced/separated/widowed), current smoking status (was defined as positive if the sub-ject smoked in the last 30 days), current alcohol status (was defined as positive if the subject consumed alcohol in the last 365 days), BMI in kg/m2, family history of diabetes (yes or no), waist circumference (in centimeters), systolic blood pressure (in mm of Hg), fasting blood glucose (in mg/dl), triglycerides (in mg/dl), total cholesterol (in mg/dl), physical activity (self-reported hours of vigorous-intensity work and sports activities/recreation and hours of walking/ cycling), and weekly fruit/vegetable intake (number of serv-ings of fruits/vegetable). We have reported pathways only for statistically significant standardized path coefficients at
p< 0.05 level.
Ethics approval
The Institute Ethics Committee of Post Graduate Institute of Medical Education and Research, Chandigarh approved the study (reference number P-727, dated 21 July 2014). Informed written consent was taken from all participants.
Results
Prevalence of diabetes
prevalence of diabetes mellitus among the study partici-pants was found out to be 8.3% (95% CI 7.3–9.4%). Indi-viduals with diabetes were more likely to be between 45 and 69 years (18%, p= 0.001), belonging to general (9.3%) and other backward caste (10.2%, p= 0.05), divorced/separated/widowed (14.9%, p= 0.001), hyper-tensive (14.3%, p = 0.001), obese (14.4%, p= 0.001), with family history of diabetes (11.9%, p= 0.001), have poor physical activity (8.6%, p= 0.008), and hypertriglyc-eridemia (10.8%,p= 0.006). Table1.
SEM model
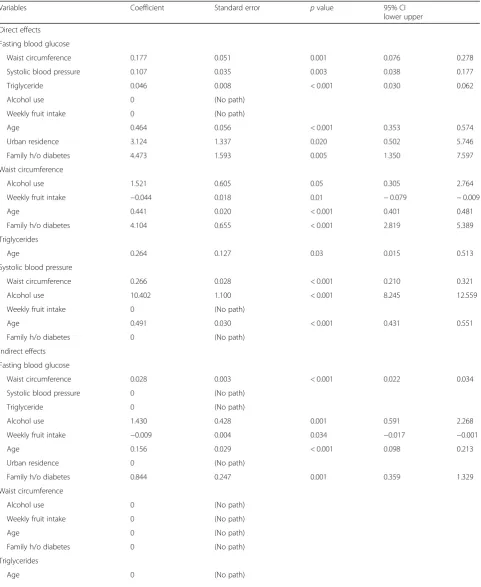
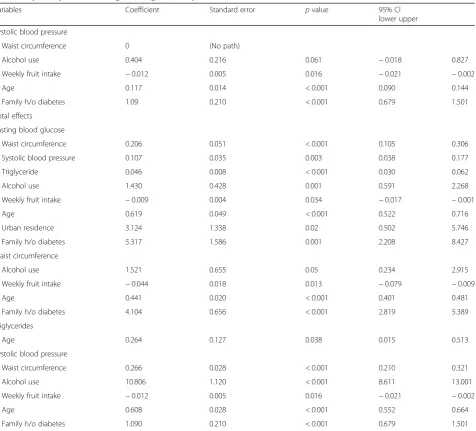
The final model had excellent fit, and the fully standardized path coefficients are presented in Fig. 1. Non-significant paths were removed and a few additional paths were added to improve model fit. Specifically, education, marital status, BMI, physical activity, smoking status, and serum choles-terol were dropped from the model for better fit. Table2 shows the coefficients and standard error of the direct and indirect effects of variables on diabetes status. The goodness-of-fit statistics of the model are shown in Table3.
The following risk factors deemed to have a direct sta-tistically significant effect on blood sugar status: family history of diabetes (4.5), urban residence (3.1), increasing age (0.05) and waist circumference (0.18), systolic blood pressure (0.11), and triglycerides (0.46) (Figure 1 and
Table 2). There are specific indirect effects of waist circumference (0.028, p= < 0.001), alcohol use (1.43,
p= 0.001), weekly fruit intake (−0.009, p= 0.034), in-creasing age (0.156, p< 0.001), and family h/o diabetes (0.844, p= 0.001) on fasting blood glucose (Table 2).
Waist circumference, alcohol intake, and increasing age impact blood sugar levels mediated by raised blood pressure. Waist circumference mediates the indirect ef-fects of age, family h/o of diabetes, alcohol intake, and weekly fruit intake on blood sugar levels. Triglycerides also mediate the indirect effect of age on diabetes status (Fig.2).
Discussion
This is the first study in India to use SEM to analyze non-modifiable and modifiable sociodemographic, be-havioral, and metabolic determinants of diabetes in India. The following risk factors were found to have a direct statistically significant effect on blood sugar status: family history of diabetes, urban residence, increasing age and waist circumference, blood pressure, and triglycerides. This model also found that there are specific indirect ef-fects of waist circumference, alcohol use, weekly fruit in-take, age, and family h/o diabetes on fasting blood glucose.
and indirect effects and performing models with mul-tiple dependent variables which are inter-related. This methodology fits well in a chronic disease setting where several factors have direct and indirect relationships with the disease through mediator variables forming a web of causation model.
The prevalence of diabetes in the study was found to be 8.3% which is slightly lower than the figure in another recent large nationally representative survey (INDIAB study) which reported prevalence to be 10% in the same state of India [5]. Place of residence has a direct associ-ation with diabetes status supported by other studies which show that the prevalence of diabetes continues to be higher in urban areas than in rural areas [5, 18, 19], although some studies show no urban-rural gap [4].
Overall, family h/o diabetes had the strongest effect on the risk of the disease, both direct and indirect. This finding is well supported by the results of the INDIAB study in both rural and urban areas [5]. Family h/o dia-betes also indirectly affected diadia-betes status through raised waist circumference. Thus, those with family h/o diabetes constitute a high risk group requiring a package of services which includes regular screening for blood Table 1Characteristics of study participants and the prevalence
of diabetes by sociodemographic and clinical factors
Characteristics Total,
N
Diabetes,
n(%)
pvalue
Total 2495 207 (8.3)
Age group 0.001
18–24 years 430 6(1.4)
25–44 years 1289 61(4.7)
45–69 years 776 140(18.0)
Gender 0.9
Male 907 76(8.4)
Female 1588 131(8.2)
Residence 0.11
Rural 1529 116(7.6)
Urban 966 91(9.4)
Social group 0.05
SC 954 61(6.4)
Other backward caste 342 35(10.2)
General 1155 107(9.3)
Educational status 0.07
Illiterate 575 51(8.9)
Up to primary education 599 63(10.3)
Up to secondary education 1065 74(6.9)
Higher education 256 19(7.4)
Marital status 0.001
Never married 413 5(1.2)
Currently married 1869 172(9.2)
Separated/divorced/widowed 195 29(14.9)
Current smokinga
0.7
Yes 101 8(7.9)
No 2394 199(8.3)
Current alcohol useb
0.1
Yes 386 40(10.4)
No 2109 167(7.9)
Hypertensionc 0.001
Yes 1031 147(14.3)
No 1464 60(4.1)
> = 5 servings of fruits and vegetables dailyd 0.4
Yes 109 10(9.2)
No 2386 197(8.3)
Obesitye 0.001
Yes 1830 96(14.4)
No 665 111(6.1)
Family history of diabetes 0.001
Yes 537 64(11.9)
No 1925 142(7.4)
Table 1Characteristics of study participants and the prevalence of diabetes by sociodemographic and clinical factors(Continued)
Characteristics Total,
N
Diabetes,
n(%)
pvalue
Family history of raised cholesterol 0.9
Yes 126 11(8.7)
No 2336 195(8.3)
Abdominal obesityf 0.001
Yes 1415 165(11.7)
No 1080 42(3.9)
Hypertriglyceridemiag 0.006
Yes 656 136(7.4)
No 1839 71(10.8)
Physical activityh
0.008
Above minimal recommended 140 04 (3.0)
Below minimal recommended 2355 203(8.6)
SCscheduled caste a
One who smoked tobacco in the last 30 days b
One who has consumed alcohol in the last year c
SBP≥140 and/or DBP≥90 or currently on medication d
One serving of vegetable was considered to be one cup of raw green leafy vegetables or 1/2 cup of other vegetables (cooked or chopped raw). One serving of fruit was considered to be one medium size piece of apple, banana or orange, 1/2 cup of chopped, canned fruit, or 1/2 cup of fruit juice e
Body mass index≥27.5 kg/m2 f
≥90 cm for males and≥80 cm for females g
Serum triglyceride > 150 mg/dl h
Table 2Coefficient and standard error of the final SEM model of risk factors for diabetes in the STEPwise approach to surveillance 2015 survey—Punjab, India among adults aged 18–69 years
Variables Coefficient Standard error pvalue 95% CI
lower upper
Direct effects
Fasting blood glucose
Waist circumference 0.177 0.051 0.001 0.076 0.278
Systolic blood pressure 0.107 0.035 0.003 0.038 0.177
Triglyceride 0.046 0.008 < 0.001 0.030 0.062
Alcohol use 0 (No path)
Weekly fruit intake 0 (No path)
Age 0.464 0.056 < 0.001 0.353 0.574
Urban residence 3.124 1.337 0.020 0.502 5.746
Family h/o diabetes 4.473 1.593 0.005 1.350 7.597
Waist circumference
Alcohol use 1.521 0.605 0.05 0.305 2.764
Weekly fruit intake −0.044 0.018 0.01 −0.079 −0.009
Age 0.441 0.020 < 0.001 0.401 0.481
Family h/o diabetes 4.104 0.655 < 0.001 2.819 5.389
Triglycerides
Age 0.264 0.127 0.03 0.015 0.513
Systolic blood pressure
Waist circumference 0.266 0.028 < 0.001 0.210 0.321
Alcohol use 10.402 1.100 < 0.001 8.245 12.559
Weekly fruit intake 0 (No path)
Age 0.491 0.030 < 0.001 0.431 0.551
Family h/o diabetes 0 (No path)
Indirect effects
Fasting blood glucose
Waist circumference 0.028 0.003 < 0.001 0.022 0.034
Systolic blood pressure 0 (No path)
Triglyceride 0 (No path)
Alcohol use 1.430 0.428 0.001 0.591 2.268
Weekly fruit intake −0.009 0.004 0.034 −0.017 −0.001
Age 0.156 0.029 < 0.001 0.098 0.213
Urban residence 0 (No path)
Family h/o diabetes 0.844 0.247 0.001 0.359 1.329
Waist circumference
Alcohol use 0 (No path)
Weekly fruit intake 0 (No path)
Age 0 (No path)
Family h/o diabetes 0 (No path)
Triglycerides
glucose and a lifestyle behavioral intervention package in terms of healthy diet and physical activity.
Raised triglyceride level is a common dyslipidemic feature accompanying type 2 diabetes. It is one of five accepted criteria for defining individuals at high risk for cardio-metabolic diseases including 2 diabetes, termed the “metabolic syndrome” [16, 20, 21]. The present study, besides an independent effect, also showed that triglyceride levels mediate the effect of age on diabetes as triglyceride levels increase with age [22].
Body fat distribution (excess abdominal fat) is associated with an increased risk of cardio-metabolic diseases such as diabetes, hypertension, dyslipidemia, and coronary heart disease. Waist circumference is often
Table 2Coefficient and standard error of the final SEM model of risk factors for diabetes in the STEPwise approach to surveillance 2015 survey—Punjab, India among adults aged 18–69 years(Continued)
Variables Coefficient Standard error pvalue 95% CI
lower upper
Systolic blood pressure
Waist circumference 0 (No path)
Alcohol use 0.404 0.216 0.061 −0.018 0.827
Weekly fruit intake −0.012 0.005 0.016 −0.021 −0.002
Age 0.117 0.014 < 0.001 0.090 0.144
Family h/o diabetes 1.09 0.210 < 0.001 0.679 1.501
Total effects
Fasting blood glucose
Waist circumference 0.206 0.051 < 0.001 0.105 0.306
Systolic blood pressure 0.107 0.035 0.003 0.038 0.177
Triglyceride 0.046 0.008 < 0.001 0.030 0.062
Alcohol use 1.430 0.428 0.001 0.591 2.268
Weekly fruit intake −0.009 0.004 0.034 −0.017 −0.001
Age 0.619 0.049 < 0.001 0.522 0.716
Urban residence 3.124 1.338 0.02 0.502 5.746
Family h/o diabetes 5.317 1.586 0.001 2.208 8.427
Waist circumference
Alcohol use 1.521 0.655 0.05 0.234 2.915
Weekly fruit intake −0.044 0.018 0.013 −0.079 −0.009
Age 0.441 0.020 < 0.001 0.401 0.481
Family h/o diabetes 4.104 0.656 < 0.001 2.819 5.389
Triglycerides
Age 0.264 0.127 0.038 0.015 0.513
Systolic blood pressure
Waist circumference 0.266 0.028 < 0.001 0.210 0.321
Alcohol use 10.806 1.120 < 0.001 8.611 13.001
Weekly fruit intake −0.012 0.005 0.016 −0.021 −0.002
Age 0.608 0.028 < 0.001 0.552 0.664
Family h/o diabetes 1.090 0.210 < 0.001 0.679 1.501
SEMstructural equation modeling,SEM modelendogenous variables are waist circumference, systolic blood pressure, triglyceride, fasting blood glucose; exogenous variables are alcohol use, weekly fruit intake, place of residence, age, family history, education and occupation,CIconfidence interval
Table 3Goodness-of-fit statistics for the structural equation model
Goodness-of-fit statistics Value
Root mean squared error of approximation 0.04, 90% CI (0.03–0.05)
pclose 0.82, < 0.05
Comparative fit index 0.93
Tucker-Lewis index 0.90
Standardized root mean squared residual 0.02
used as a surrogate marker of abdominal fat mass, be-cause it correlates with abdominal fat mass [23,24]. The present study showed that waist circumference not only had a direct effect on diabetes but also mediated the direct effects of age, family h/o of diabetes, alcohol in-take, and weekly fruit intake on blood sugar levels, thereby strengthening the evidence. The study also adds to the evidence base which states that waist circumfer-ence is a stronger predictor of diabetes than BMI, apart from other cardio-metabolic diseases [24]. It provides a unique indicator of body fat distribution, which can identify patients who are at increased risk for diabetes and other obesity-related cardio-metabolic disease, above and beyond the measurement of BMI. Waist circumference will help clinicians determine which patients should be evaluated for the presence of cardio-metabolic risk factors, such as dyslipidemia, raised blood pressure and hypergly-cemia and also response to lifestyle behavioral practices. Thus, we recommend that measuring waist circumference measurement should be part of the routine clinical care guidelines.
Although previous studies in India did not find alcohol as an independent risk factor for diabetes [4, 5], the present study showed that the effect of alcohol intake on diabetes was mediated through waist circumference and blood pressure. According to the existing evidence in medical literature, alcohol intake may be a risk factor for obesity or rise in waist circumference [25–27], though contradictory findings do exist [28–30]. Also, several possible mechanisms have been proposed to establish the association between alcohol consumption and hyper-tension which are described elsewhere [31].
Strengths and limitations
The strengths of the study include a large multistage stratified community-based sample, high participant re-sponse rate, use of standardized STEPS questionnaire, and adherence to STROBE (Strengthening the Reporting of Observational Studies in Epidemiology) guidelines for reporting the findings of the study [32]. The study also employed a robust statistical technique, i.e., SEM which allows measurement of both direct and indirect effects of variables and incorporate models with multiple dependent variables by using several regression equa-tions simultaneously.
There were a few limitations in this study. First, the main outcome measure, i.e., fasting blood glucose which defined diabetes status was assessed at one single point in time when in reality it can naturally fluctuate. Second, capillary blood glucose estimation was done in place of the ideal venous plasma glucose estimation due to logistic constraints such as non-availability of quality-controlled laboratories, storage and transport of blood specimens, varied methods of estimation, and poor compliance to venous blood collection due to its inva-sive nature. However, it has been reported that capillary blood collection is a feasible and valid alternative to ven-ous blood collection for screening in large epidemio-logical studies [33,34]. Third, the cross-sectional nature of the survey prevents us from making causal inferences about the outcome.
Conclusions
variables affecting diabetes status in the Indian popula-tion. The results of this study further strengthens the evidence that lifestyle changes in the form of physical ac-tivity and healthy diet are required to prevent and con-trol diabetes. Those with family h/o diabetes constitute a high risk group and should be targeted with a regular screening and lifestyle intervention package.
Abbreviations
BMI:Body mass index; LMICs: Low- and middle-income countries; NCD: Non-communicable disease; PPS: Probability proportional to size; PSU: Primary sampling unit; SEM: Structural equation modeling; STROBE: Strengthening the Reporting of Observational Studies in Epidemiology
Acknowledgements
We acknowledge the support of Ms. Vini Mahajan, Principal Secretary, Department of Health and Family Welfare of Punjab state for granting responsibility of conducting the NCD Risk Factors Survey in Punjab and funding this project through National Health Mission (NHM). We sincerely acknowledge the support received from the National Health Mission, Ministry of Health and Family Welfare, Government of India, World Health Organization, and participating institutions. We also thank the Department for International Development (DFID), UK, for funding the Global Operational Research Fellowship Programme at the International Union Against Tuberculosis and Lung Disease (The Union), Paris, France in which Jaya Prasad Tripathy works as a Senior Operational Research Fellow.
Funding
This project was funded by the National Health Mission, Punjab, India. We thank the Department for International Development (DFID), UK, for funding this open access publication.
Availability of data and materials
Data are available with the corresponding author (JST) and will be made accessible on request at the following e-mail: [email protected].
Authors’contributions
JPT, JST, and GB were responsible for conception of the study proposal, preparation of study tool, data collection, interpretation of data, and critical review of the manuscript. JPT was involved in data analysis and preparation of the first draft of the manuscript. SJ was responsible for conception of the study proposal, preparation of study tool, interpretation of data, and critically reviewed the manuscript. All the authors have approved the final draft for submission.
Ethics approval and consent to participate
The Institute Ethics Committee of Post Graduate Institute of Medical Education and Research, Chandigarh approved the study (reference number P-727, dated 21 July 2014). Informed written consent was taken from all participants.
Consent for publication
Not applicable
Competing interests
The authors declare that they have no competing interests.
Publisher’s Note
Springer Nature remains neutral with regard to jurisdictional claims in published maps and institutional affiliations.
Author details
1
International Union Against Tuberculosis and Lung Disease, The Union South East Asia Office, New Delhi, India.2International Union Against Tuberculosis and Lung Disease, Paris, France.3Post Graduate Institute of Medical Education and Research, Chandigarh, India.
Received: 4 May 2018 Accepted: 13 June 2018
References
1. International Diabetes Federation. IDF Diabetic Atlas 8th Edition. 2017. 2. Tripathy JP, Thakur JS, Jeet G, Chawla S, Jain S, Prasad R. Urban rural
differences in diet, physical activity and obesity in India: are we witnessing the great Indian equalisation? Results from a cross-sectional STEPS survey. BMC Public Health. 2016;16:816.
3. Mohan V. Why are Indians more prone to diabetes? J Assoc Physicians India. 2004;52:468–74.
4. Tripathy JP, Thakur JS, Jeet G, Chawla S, Jain S, Pal A, et al. Prevalence and risk factors of diabetes in a large community-based study in North India: results from a STEPS survey in Punjab, India. Diabetol Metab Syndr. 2017;9:8. 5. Anjana RM, Deepa M, Pradeepa R, Mahanta J, Narain K, Das HK, et al.
Prevalence of diabetes and prediabetes in 15 states of India: results from the ICMR-INDIAB population-based cross-sectional study. Lancet Diabetes Endocrinol. 2017;5:585–96.
6. Roman-Urrestarazu A, Ali FMH, Reka H, Renwick MJ, Roman GD, Mossialos E. Structural equation model for estimating risk factors in type 2 diabetes mellitus in a middle eastern setting: evidence from the STEPS Qatar. BMJ Open Diabetes Res Care. 2016;4:e000231.
7. Karimimalayer M, Alavifar A, Anuar MK. Structural equation modeling VS multiple regression the first and second generation of multivariate techniques. Eng Sci Technol An Int J. 2012;2:2250–3498.
8. World Health Organization. The WHO STEPwise approach to Surveillance of noncommunicable diseases (STEPS). Geneva; 2003. Available from:
http://www.who.int/ncd_surveillance/en/steps_framework_dec03.pdf. 9. Government of Punjab, India. 2016 [cited 2016 Oct 18]. Available from:
http://punjab.gov.in/.
10. Mukherjee S, Chakraborty D, Sikdar S. Three decades of human development across Indian states: inclusive growth or perpetual disparity? New Delhi; 2014. Available from:http://www.nipfp.org.in/media/medialibrary/2014/06/WP_ 2014_139.pdf.
11. Thakur JS, Jeet G, Pal A, Singh S, Singh A, Deepti SS, et al. Profile of risk factors for non-communicable diseases in Punjab, Northern India: results of a state-wide STEPS survey. PLoS One. 2016;11:e0157705.
12. World Health Organization. The WHO STEPwise approach to surveillance of noncommunicable diseases (STEPS). Geneva; 2003. [cited 2016 Aug 30]. Available from:http://www.who.int/ncd_surveillance/en/steps_framework_ dec03.pdf.
13. World Health Organization. Global Physical Activity Questionnaire (GPAQ) Analysis Guide. Geneva; 2012. [cited 2017 Apr 5]. Available from:
http://www.who.int/chp/steps/resources/GPAQ_Analysis_Guide.pdf. 14. WHO Expert Consultation. Appropriate body-mass index for Asian
populations and its implications for policy and intervention strategies. Lancet. 2004;363:157–63.
15. Regional Office for the Western Pacific (WPRO) World Health Organization. International Association for the Study of Obesity and the International Obesity Task Force. The Asia Pacific perspective: redefining obesity and its treatment. 2000.
16. Expert Panel on Detection, Evaluation, and Treatment of High Blood Cholesterol in Adults. Executive summary of the third report of the National Cholesterol Education Program (NCEP) expert panel on detection, evaluation, and treatment of high blood cholesterol in adults (Adult Treatment Panel III). JAMA. 2001;285:2486–97.
17. Bardenheier BH, Bullard KM, Caspersen CJ, Cheng YJ, Gregg EW, Geiss LS. A novel use of structural equation models to examine factors associated with prediabetes among adults aged 50 years and older: National Health and Nutrition Examination Survey 2001-2006. Diabetes Care. 2013;36:2655–62. 18. Deepa M, Anjana RM, Manjula D, Narayan KMV, Mohan V. Convergence of
prevalence rates of diabetes and cardiometabolic risk factors in middle and low income groups in urban India: 10-year follow-up of the Chennai urban population study. J Diabetes Sci Technol. 2011;5:918–27.
19. Mohan V, Mathur P, Deepa R, Deepa M, Shukla DK, Menon GR, et al. Urban rural differences in prevalence of self-reported diabetes in India—the WHO–ICMR Indian NCD risk factor surveillance. Diabetes Res Clin Pract. 2008;80:159–68.
21. Alberti KGM, Zimmet P, Shaw J, IDF Epidemiology Task Force Consensus Group. The metabolic syndrome? a new worldwide definition. Lancet. 2005;366:1059–62.
22. Tripathy JP, Thakur JS, Jeet G, Chawla S, Jain S, Pal A, Prasad R. Burden and risk factors of dyslipidemia-results from a STEPS survey in Punjab India. Diabetes Metab Syndr. 2017;11 Suppl 1:S21–S27.
23. Pouliot MC, Després JP, Lemieux S, Moorjani S, Bouchard C, Tremblay A, et al. Waist circumference and abdominal sagittal diameter: best simple anthropometric indexes of abdominal visceral adipose tissue accumulation and related cardiovascular risk in men and women. Am J Cardiol. 1994;73:460–8.
24. Klein S, Allison DB, Heymsfield SB, Kelley DE, Leibel RL, Nonas C, et al. Waist circumference and cardiometabolic risk: a consensus statement from shaping America's health: Association for Weight Management and Obesity Prevention; NAASO, the Obesity Society; the American Society for Nutrition; and the American Diabetes Association. Diabetes Care. 2007;30(6):1647–52. 25. Vadstrup ES, Petersen L, Sorensen TIA, Gronbaek M. Waist circumference in
relation to history of amount and type of alcohol: results from the Copenhagen City Heart Study. Int J Obes. 2003;27:238–46.
26. Mozaffarian D, Hao T, Rimm EB, Willett WC, Hu FB. Changes in diet and lifestyle and long-term weight gain in women and men. N Engl J Med. 2011;364:2392–404.
27. French MT, Norton EC, Fang H, Maclean JC. Alcohol consumption and body weight. Health Econ. 2009;19:814–32.
28. Liu S, Serdula MK, Williamson DF, Mokdad AH, Byers T. A prospective study of alcohol intake and change in body weight among US adults. Am J Epidemiol. 1994;140:912–20.
29. Pajari M, Pietilainen KH, Kaprio J, Rose RJ, Saarni SE. The effect of alcohol consumption on later obesity in early adulthood—a population-based longitudinal study. Alcohol Alcohol. 2010;45:173–9.
30. Tolstrup JS, Halkjaer J, Heitmann BL, Tjønneland AM, Overvad K, Sørensen TIA, et al. Alcohol drinking frequency in relation to subsequent changes in waist circumference. Am J Clin Nutr. 2008;87:957–63.
31. Husain K, Ansari RA, Ferder L. Alcohol-induced hypertension: mechanism and prevention. World J Cardiol. 2014;6:245–52. Baishideng Publishing Group Inc.
32. von Elm E, Altman DG, Egger M, Pocock SJ, Gøtzsche PC, Vandenbroucke JP, et al. The strengthening the reporting of observational studies in epidemiology (STROBE) statement: guidelines for reporting observational studies. Bull World Health Organ. 2007;85:867–72.
33. Kruijshoop M, Feskens EJM, Blaak EE, de Bruin TWA. Validation of capillary glucose measurements to detect glucose intolerance or type 2 diabetes mellitus in the general population. Clin Chim Acta. 2004;341:33–40. 34. Priya M, Mohan Anjana R, Pradeepa R, Jayashri R, Deepa M, Bhansali A, et al.